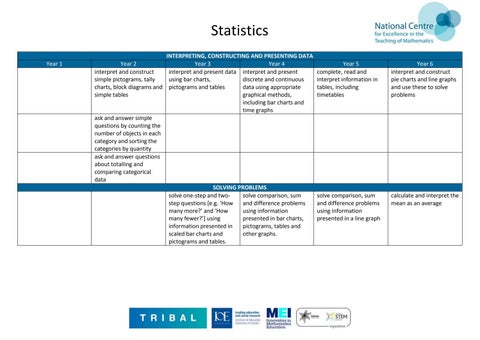
Statistics Year 1
INTERPRETING, CONSTRUCTING AND PRESENTING DATA Year 2 Year 3 Year 4 interpret and construct interpret and present data interpret and present simple pictograms, tally using bar charts, discrete and continuous charts, block diagrams and pictograms and tables data using appropriate simple tables graphical methods, including bar charts and time graphs ask and answer simple questions by counting the number of objects in each category and sorting the categories by quantity ask and answer questions about totalling and comparing categorical data SOLVING PROBLEMS solve one-step and twosolve comparison, sum step questions [e.g. ‘How and difference problems many more?’ and ‘How using information many fewer?’] using presented in bar charts, information presented in pictograms, tables and scaled bar charts and other graphs. pictograms and tables.
Year 5 complete, read and interpret information in tables, including timetables
Year 6 interpret and construct pie charts and line graphs and use these to solve problems
solve comparison, sum and difference problems using information presented in a line graph
calculate and interpret the mean as an average