Pupil Premium Strategy 2022-23 Impact Statement
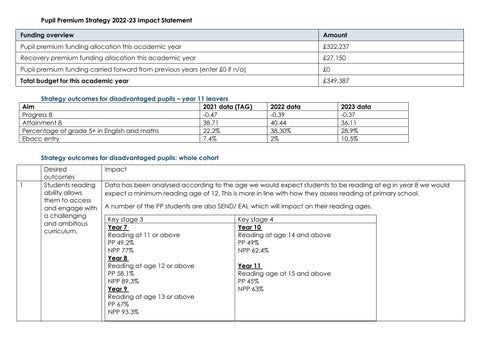
Funding overview
Pupil premium funding allocation this academic year
Recovery premium funding allocation this academic year
Pupil premium funding carried forward from previous years (enter £0 if n/a)
Total budget for this academic year
Strategy outcomes for disadvantaged pupils – year 11 leavers
£322,237
£27,150
£0
£349,387
Aim
Strategy outcomes for disadvantaged pupils: whole cohort
Desired outcomes Impact
1 Students reading ability allows them to access and engage with a challenging and ambitious curriculum.
Data has been analysed according to the age we would expect students to be reading at eg in year 8 we would expect a minimum reading age of 12. This is more in line with how they assess reading at primary school.
A number of the PP students are also SEND/ EAL which will impact on their reading ages.
Key stage 3
Year 7
Reading at 11 or above
PP 49.2%
NPP 77%
Year 8
Reading at age 12 or above
PP 58.1%
NPP 89.3%
Year 9
Reading at age 13 or above
PP 67%
NPP 93.3%
Key stage 4
Year 10
Reading at age 14 and above
PP 49%
NPP 62.4%
Year 11
Reading age at 15 and above
PP 45%
NPP 63%
2 Students attend school and as a result demonstrate positive outcomes
Whole school attendance
Finished on 90.58%
This was a 1.03% rise on the previous academic year.
PP attendance
Finished on 85.83%
This was a decline by 0.51% on the previous academic year.
PA figure whole school
29.52% of the school population were classified as persistent absentees. This was a decline by 1.12% on the previous academic year.
PA figure PP
65.3% of the students who were classified as PA were PP students.
This was an increase of 5.6% on the previous academic year.
Summary
Comparisons surrounding disadvantaged pupil’s absence rates and PA percentages do not accurately reflect the impact of strategies on improving attendance and reducing PA%.
The 2023 IDSR states:
There is nothing to highlight for overall absence in 2021/22 compared to all schools or schools with a similar level of deprivation.
There is nothing to highlight for persistent absence in 2021/22 compared to all schools or schools with a similar level of deprivation.
(NB IDSR data is lagged so 2023 is commenting on the most up to date data held by DFE)
So whilst we recognise there is still work to be done on attendance at whole school and PP level, our position is in line with the national picture and is not flagged as an area of concern on the data dashboard.
3 Students demonstrate a positive approach to learning which leads to improved engagement
In the last academic year there was a:
• 13% reduction in C3s
• 26% reduction in C4s
• 38% reduction in suspensions
• rise to 9 from 7 Permanent Exclusions
handed out in 2022/23 compared to the previous academic year.
4 Gaps in student knowledge are identified and addressed, gaps in performance between PP and NPP are eliminated across the curriculum.
Summary
Due to the ongoing challenges presented to all schools post pandemic, a revised staffing structure and a change of expectations regarding behaviour, there is no like for like comparative data to demonstrate impact of key actions identified within the plan. Our comprehensive QA cycle indicates improved behaviour for learning and conduct behaviour in lessons and there was a positive ratio of praise points to sanctions during the academic year. Suspension data, like low level behaviour data is not like for like due to post covid climate and raised expectations and new policies in place.
Continuing our focus on establishing positive behaviour for learning remains a priority.
data using SISRA as national data not available
Year 11 P8 NPP 0.41
Year 11 P8 PP -0.37
Year 11 attainment NPP 4.66
Year 11 attainment PP 3.61
Percentage of students on track to meet school set target – current year 11
5 Students know how to achieve and sustain improved wellbeing
Summary
Gaps in performance between PP and non PP remain wide across all subject areas. Again, this is reflective of the national picture. Continuing our work to close these gaps remains a priority.
Data from interventions shows positive impact:
Sessions with school counsellor
49 students across 5 year groups accessed the school counsellor in the last academic year. Of these 18 were pupil premium. Exit data gathered by the counsellor suggests the impact of the experience was positive on the whole. One reason for the reduced number of pupil premium students accessing counselling is the level of entry onto the continuum of need. Where a student is eligible for or receiving external agency support, the school counsellor does not work with them, to avoid duplication of work.
DofE
Bronze Award reintroduced - 22 Yr 9 students completed this year, 6 of whom were PP, so 27%. Of these 100% completed their Bronze Award. The Dofe budget was also used to subsidise DofE equipment such as tents, boots and rucksacks etc.
Summary
Pupil voice indicates that pupils feel safe and are confident to report incidents that cause concern. Pupils can identify at least one adult in school who they would go to if they have any issues. Issues outside of school are also communicated with school. All concerns and actions are recorded and monitored within CPOMs. There are no comparative like for like data on reporting. There has been a significant increase in the provision made for pupils based on need both internal and external. Pupils are signposted to agencies based on their tier allocated within Lancashire’s continuum of need.