PlanningYear . 2016-17 Results
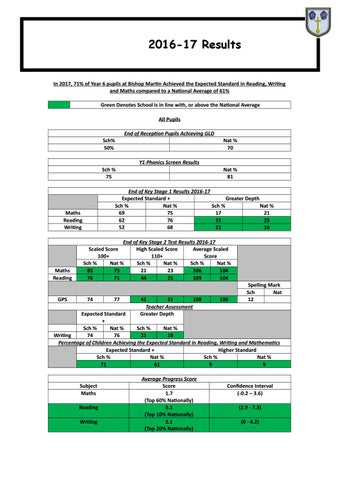
In 2017, 71% of Year 6 pupils at Bishop Martin Achieved the Expected Standard in Reading, Writing and Maths compared to a National Average of 61% Green Denotes School is in line with, or above the National Average All Pupils End of Reception Pupils Achieving GLD Sch% 50%
Nat % 70 Y1 Phonics Screen Results
Sch % 75
End of Key Stage 1 Results 2016-17 Expected Standard + Greater Depth Sch % Nat % Sch % Nat % 69 75 17 21 62 76 31 25 52 68 21 16
Maths Reading Writing
Maths Reading
GPS
Nat % 81
End of Key Stage 2 Test Results 2016-17 Scaled Score High Scaled Score Average Scaled 100+ 110+ Score Sch % Nat % Sch % Nat % Sch % Nat % 85 75 21 23 106 104 76 71 44 25 109 104
74
77
41 31 108 Teacher Assessment Greater Depth
106
Spelling Mark Sch Nat 12
Expected Standard + Sch % Nat % Sch % Nat % Writing 74 76 21 18 Percentage of Children Achieving the Expected Standard in Reading, Writing and Mathematics Expected Standard + Higher Standard Sch % Nat % Sch % Nat % 71 61 9 9
Subject Maths Reading Writing
Average Progress Score Score 1.7 (Top 60% Nationally) 5.1 (Top 10% Nationally) 2.1 (Top 20% Nationally)
Confidence Interval (-0.2 – 3.6) (2.9 - 7.3) (0 - 4.2)