PlanningYear . 2015-16 KS1 & KS2 Results
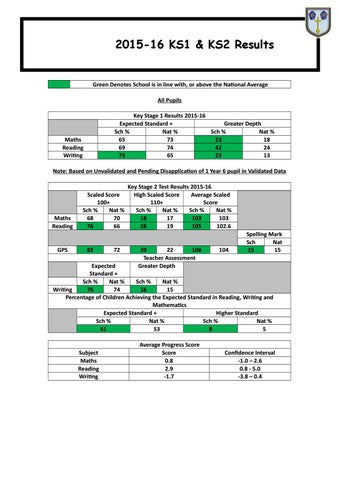
Green Denotes School is in line with, or above the National Average All Pupils Key Stage 1 Results 2015-16 Expected Standard + Greater Depth Sch % Nat % Sch % Nat % 65 73 23 18 69 74 42 24 73 65 23 13
Maths Reading Writing
Note: Based on Unvalidated and Pending Disapplication of 1 Year 6 pupil in Validated Data
Maths Reading
GPS
Key Stage 2 Test Results 2015-16 Scaled Score High Scaled Score Average Scaled 100+ 110+ Score Sch % Nat % Sch % Nat % Sch % Nat % 68 70 18 17 103 103 76 66 26 19 105 102.6
82
72
39 22 106 Teacher Assessment Greater Depth
104
Spelling Mark Sch Nat 15 15
Expected Standard + Sch % Nat % Sch % Nat % Writing 76 74 16 15 Percentage of Children Achieving the Expected Standard in Reading, Writing and Mathematics Expected Standard + Higher Standard Sch % Nat % Sch % Nat % 61 53 8 5
Subject Maths Reading Writing
Average Progress Score Score 0.8 2.9 -1.7
Confidence Interval -1.0 – 2.6 0.8 - 5.0 -3.8 – 0.4