Year 2 Phonics Screening Check 2016 SCHOOL RESULTS
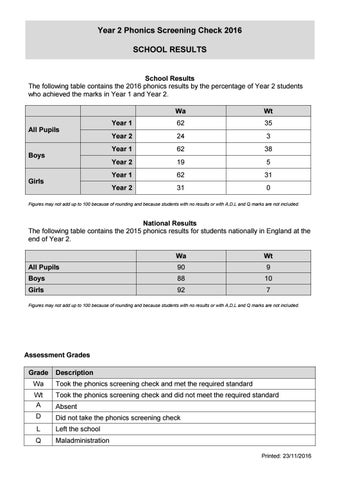
School Results The following table contains the 2016 phonics results by the percentage of Year 2 students who achieved the marks in Year 1 and Year 2. Wa
Wt
Year 1
62
35
Year 2
24
3
Year 1
62
38
Year 2
19
5
Year 1
62
31
Year 2
31
0
All Pupils
Boys
Girls
Figures may not add up to 100 because of rounding and because students with no results or with A,D,L and Q marks are not included.
National Results The following table contains the 2015 phonics results for students nationally in England at the end of Year 2. Wa
Wt
All Pupils
90
9
Boys
88
10
Girls
92
7
Figures may not add up to 100 because of rounding and because students with no results or with A,D,L and Q marks are not included.
Assessment Grades Grade
Description
Wa
Took the phonics screening check and met the required standard
Wt A
Took the phonics screening check and did not meet the required standard
D
Did not take the phonics screening check
L
Left the school
Q
Maladministration
Absent
Printed: 23/11/2016