Year 1 Phonics Screening Check 2016 SCHOOL RESULTS
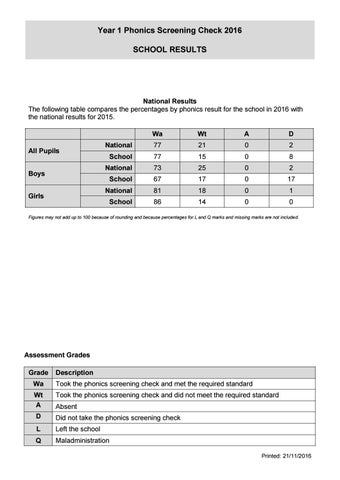
National Results The following table compares the percentages by phonics result for the school in 2016 with the national results for 2015.
All Pupils Boys Girls
Wa
Wt
A
D
National
77
21
0
2
School
77
15
0
8
National
73
25
0
2
School
67
17
0
17
National
81
18
0
1
School
86
14
0
0
Figures may not add up to 100 because of rounding and because percentages for L and Q marks and missing marks are not included.
Assessment Grades Grade
Description
Wa
Took the phonics screening check and met the required standard
Wt A
Took the phonics screening check and did not meet the required standard
D
Did not take the phonics screening check
L
Left the school
Q
Maladministration
Absent
Printed: 21/11/2016