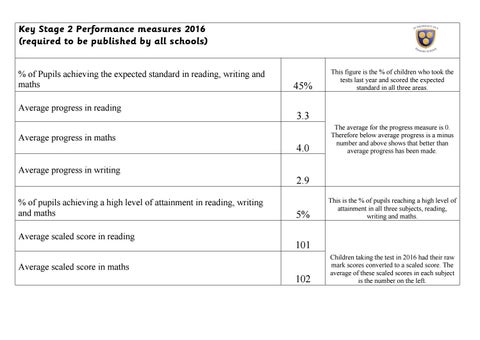
Key Stage 2 Performance measures 2016 (required to be published by all schools) % of Pupils achieving the expected standard in reading, writing and maths Average progress in reading
45%
This figure is the % of children who took the tests last year and scored the expected standard in all three areas.
3.3
Average progress in maths
4.0
The average for the progress measure is 0. Therefore below average progress is a minus number and above shows that better than average progress has been made.
Average progress in writing
2.9 % of pupils achieving a high level of attainment in reading, writing and maths Average scaled score in reading
5%
This is the % of pupils reaching a high level of attainment in all three subjects, reading, writing and maths.
101
Average scaled score in maths
102
Children taking the test in 2016 had their raw mark scores converted to a scaled score. The average of these scaled scores in each subject is the number on the left.