Our Lady of Lourdes RC Primary School
Inspection Dashboard The inspection dashboard is designed to show at a glance how well previous cohorts demonstrated characteristics of good or better performance. It contains a brief overview of published data for the last three years. It shows progress first, including from the main starting points. It includes the key groups: disadvantaged pupils, those who have special educational needs (SEN), girls and boys. Achievement of disadvantaged pupils is compared with the national performance of other (non-disadvantaged) pupils. Cohort sizes are shown; data for very small groups should be treated with caution. The front page summarises strengths and weaknesses based on only the 2014 data shown in the dashboard. The strengths give an indication of some features of good or better performance in 2014, highlighting consistency across starting points, subjects or groups.
Strengths in 2014
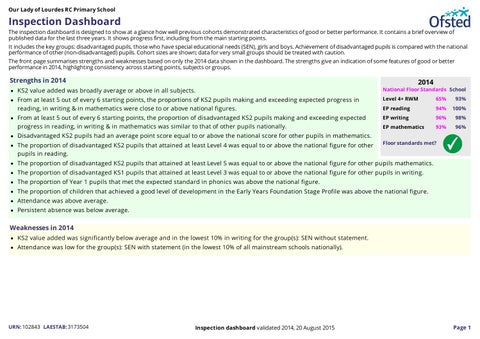
2014
National Floor Standards School KS2 value added was broadly average or above in all subjects. Level 4+ RWM 65% 93% From at least 5 out of every 6 starting points, the proportions of KS2 pupils making and exceeding expected progress in EP reading 94% 100% reading, in writing & in mathematics were close to or above national figures. EP writing 96% 98% From at least 5 out of every 6 starting points, the proportion of disadvantaged KS2 pupils making and exceeding expected progress in reading, in writing & in mathematics was similar to that of other pupils nationally. EP mathematics 93% 96% Disadvantaged KS2 pupils had an average point score equal to or above the national score for other pupils in mathematics. The proportion of disadvantaged KS2 pupils that attained at least Level 4 was equal to or above the national figure for other Floor standards met? pupils in reading. The proportion of disadvantaged KS2 pupils that attained at least Level 5 was equal to or above the national figure for other pupils mathematics. The proportion of disadvantaged KS1 pupils that attained at least Level 3 was equal to or above the national figure for other pupils in writing. The proportion of Year 1 pupils that met the expected standard in phonics was above the national figure. The proportion of children that achieved a good level of development in the Early Years Foundation Stage Profile was above the national figure. Attendance was above average. Persistent absence was below average.
Weaknesses in 2014 KS2 value added was significantly below average and in the lowest 10% in writing for the group(s): SEN without statement. Attendance was low for the group(s): SEN with statement (in the lowest 10% of all mainstream schools nationally).
URN: 102843 LAESTAB: 3173504
Inspection dashboard validated 2014, 20 August 2015
Page 1