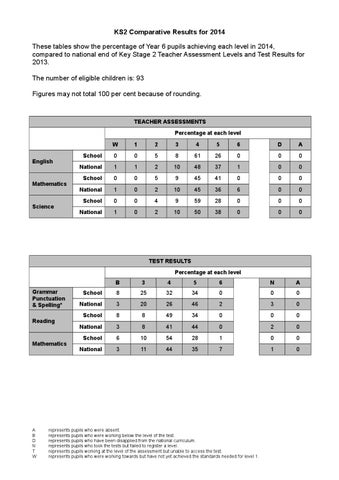
KS2 Comparative Results for 2014 These tables show the percentage of Year 6 pupils achieving each level in 2014, compared to national end of Key Stage 2 Teacher Assessment Levels and Test Results for 2013. The number of eligible children is: 93 Figures may not total 100 per cent because of rounding.
TEACHER ASSESSMENTS Percentage at each level
English
Mathematics
Science
W
1
2
3
4
5
6
D
A
School
0
0
5
8
61
26
0
0
0
National
1
1
2
10
48
37
1
0
0
School
0
0
5
9
45
41
0
0
0
National
1
0
2
10
45
36
6
0
0
School
0
0
4
9
59
28
0
0
0
National
1
0
2
10
50
38
0
0
0
TEST RESULTS Percentage at each level Grammar Punctuation & Spelling* Reading
Mathematics
A B D N T W
B
3
4
5
6
N
A
School
8
25
32
34
0
0
0
National
3
20
26
46
2
3
0
School
8
8
49
34
0
0
0
National
3
8
41
44
0
2
0
School
6
10
54
28
1
0
0
National
3
11
44
35
7
1
0
represents pupils who were absent. represents pupils who were working below the level of the test. represents pupils who have been disapplied from the national curriculum. represents pupils who took the tests but failed to register a level. represents pupils working at the level of the assessment but unable to access the test. represents pupils who were working towards but have not yet achieved the standards needed for level 1.