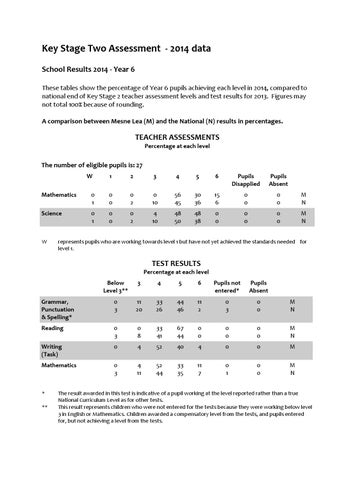
Key Stage Two Assessment - 2014 data School Results 2014 - Year 6 These tables show the percentage of Year 6 pupils achieving each level in 2014, compared to national end of Key Stage 2 teacher assessment levels and test results for 2013. Figures may not total 100% because of rounding. A comparison between Mesne Lea (M) and the National (N) results in percentages.
TEACHER ASSESSMENTS Percentage at each level
The number of eligible pupils is: 27 W
1
2
3
4
5
6
Pupils Disapplied
Pupils Absent
Mathematics
0 1
0 0
0 2
0 10
56 45
30 36
15 6
0 0
0 0
M N
Science
0 1
0 0
0 2
4 10
48 50
48 38
0 0
0 0
0 0
M N
W
represents pupils who are working towards level 1 but have not yet achieved the standards needed for level 1.
TEST RESULTS Percentage at each level Below Level 3**
3
4
5
6
Pupils not entered*
Pupils Absent
Grammar, Punctuation & Spelling*
0 3
11 20
33 26
44 46
11 2
0 3
0 0
M N
Reading
0 3
0 8
33 41
67 44
0 0
0 0
0 0
M N
Writing (Task)
0
4
52
40
4
0
0
M
Mathematics
0 3
4 11
52 44
33 35
11 7
0 1
0 0
M N
* **
The result awarded in this test is indicative of a pupil working at the level reported rather than a true National Curriculum Level as for other tests. This result represents children who were not entered for the tests because they were working below level 3 in English or Mathematics. Children awarded a compensatory level from the tests, and pupils entered for, but not achieving a level from the tests.