6 minute read
3.4 Describe the process of developing recommendations from the analysis

Being able to collect the right data is one thing but making it extremely useful to the business or project requires a different skill- and mindset. Data research and analytics is often perceived as complicated and suited to more isolated individuals within the business; therefore, achieving buy-in behind data and research findings has always been a significant challenge to external consultants. One additional factor is that internal and external stakeholders might view the consultant to be inherently biased in favour of findings that support a justification for future work (Maister: 2002)! Taking into consideration the work of several academic experts within the field of consultancy and change management, we therefore provide a synopsis of eight dimensions that overlap to enhance the process of turning raw data into analytics and then actionable recommendations (Kotter: 2012) (Maister: 2002):
1. Smart Recruitment
Advertisement
Tools can collect data, but people - who understand the business - build insights. Smart people are required to find the useful data, translate it into data-driven stories of useful knowledge - the insights. It's a team effort where combining internal business experts with external analysts might be your best bet.
2. Ask stakeholders
Go the extra mile to answer all of your stakeholders’ questions. This means tapping into the stakeholders’ aspirations and challenges by asking the right questions. Remember, if things go wrong, or not to planned, these are the significant people who might step in to save you and your team.
3. Measuring the correct variables
It's a must to formulate a clear business question before you start your next data analysis. You can easily waste hours of your time by getting lost in your data. And coming up with "insights" that are already known or not deemed important can be highly frustrating as well! You can't manage what you can’t measure (Drucker: 2001). Don’t overly worry about other company approaches. Every business is different and has its own unique research demands. Don’t fit the research outcomes, and the actions that the evidence suggests, to suit wider market wisdoms; because often the supposed experts have been proved to be wrong, or too slow to identify transformative events (Bingley: 2015).
Let's assume you run an ecommerce site. In this case you probably want to know:
• Which channels drive the most conversions?
• What are your leaking buckets? (places where people leave your website)
• Whether people use multiple devices before purchasing your products?
• What are the look-to-buy ratios for your individual products and product categories?
• What landing pages need to be improved and in which channel?
You need to think in advance about what is important for your business. It all starts with a clear measurement plan for your project/business and a good set of KPIs for the team/project members.
4. Segmentation
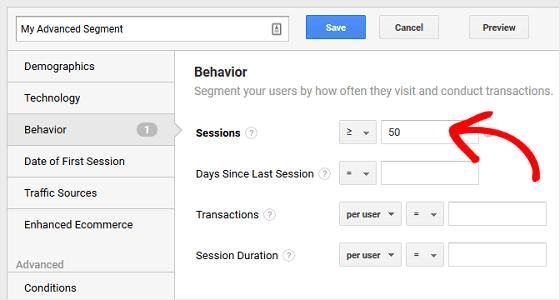
Segment from the outset. By grouping visitors that have some attributes in common, you can start digging deeper. Choosing which segments to study depends on the business question you are trying to answer. Identifying segments will greatly enhance your understanding of how your customers behave. You can use this information for setting up an optimisation plan. Digital analytics tools like Google Analytics come with a lot of inbuilt segments and provide you with all the freedom to customize them to your needs.
Figure 1: Google Analytics Example:
Source: Monster Insights accessed at: https://www.monsterinsights.com/howto-create-google-analytics-advanced-segments/
5. Present well and make it visual
The way in which you present your data will make a huge difference in the outcome. Do you remember these presentations that only include numbers and words? Think back for a moment to your best ever classroom teacher? How did they engage you and inspire you to remember their content? Presenting data analytics is no different. Rehearse and play around with your data sets. Try to disprove your findings and ask yourself uncomfortable questions beforehand. Anticipate what the experts and intelligent executives in the room might ask? What might they try to trip you up on? It's important to verbalise your data set and story with as much what, how and why behind it. This will turn your data into insights and profitable business decisions.
6. Understand existing biases within data
Don’t build your findings upon poor statistical foundations. There are lies, damn lies and statistics! Think back to the last anonymous survey that you completed. How accurate were you in your answers? Everyone has got data and their own personal data driven insight (opinion). In most cases superior understanding of
context leads to the best research, which in turn can inform the best possible decision-making.
Make sure to establish context for the data you are seeing. What do these numbers mean? Are they important? Does it really affect the business? And how is the data collected?
7. Build an optimisation plan
Consider using the Sigma Six ‘Define Measure Analyse Improve Control’ process (DMAIC) to improve your business. It's one of the Six Sigma concepts you can directly apply in your situation.
In sum:
• Define the problem or hypothesis, stakeholders and scope of analysis.
• Measure relevant data and conduct basic analysis to spot anomalies.
• Analyse correlations and patterns, put your statistics and visualisation skills to work.
• Improvement based on insights and showing several options to explore.
• Control the change by deploying Quality Control tests and monitoring KPIs.
Figure 2: DMAIC Model visualised:

Source: GoleanSixSigma.com: https://goleansixsigma.com/dmaic-five-basicphases-of-lean-six-sigma/
8. Cross-organisation involvement and research
All persons within a business community or division will have vital data: knowledge, opinions and networks. A healthy pan-organisational approach is the foundation of enhanced outcomes. Inspire, motivate and be curious about the data and the possibilities it has for your organisation and consultancy role. Treat any obstacles first and improve the communication between the business and analytics leaders (Tecce: 2009).
Reflective Exercise:
In your private notebook. Read the following article – How to create Google Analytics advanced segments – step-by-step by Lindsay Liedke (2019):
https://www.monsterinsights.com/how-to-create-google-analytics-advancedsegments/
Devise an advanced segmented Google Analytics plan to turn raw information from a large, busy car showroom that sells vehicles including ten car makes and small to medium sized vans. The business is a stand-alone, one-site business, in a major city. But the business is looking to expand to a neighbouring city, then perhaps another, next year.
Once the company has expanded into three cities, do you feel the Google Analytics tool is suitable for this project
Further Reading:
Meredith Belbin, R. (2010) Team Roles at Work. London: Routledge; 2nd Revised edition
Maister, D., (2002) The Trusted Advisor. London: Simon & Schuster
Drucker, P. (2001) Management Challenges for the 21st Century. New York:
Harper Business
References:
Maister, D., (2002) The Trusted Advisor. London: Simon & Schuster
Kotter, J. (2012) Leading Change. Cambridge USA, Harvard Business Review Press; 1R edition
Drucker, P. (2001) Management Challenges for the 21st Century. New York:
Harper Business
Bingley, R. (2015) The Security Consultant’s Handbook. Ely: IT Governance
Press
Tecce, D. (2009) Dynamic Capabilities & Strategic Management. Oxford: Oxford
University Press Lindsay Liedke (2019) How to create Google Analytics advanced segments –step-by-step, accessed on 20/1/2020 at: https://www.monsterinsights.com/how-to-create-google-analytics-advancedsegments/