8 minute read
3.2 Select a range of data analysis tools/models and evaluate the contribution to the success of an intervention project in using a range of tools/models

3.2 Select a range of data analysis tools/models and evaluate the contribution to the success of an intervention project in using a range of tools/models
Data analysis is the process of working on data with the purpose of arranging it correctly, explaining it, making it presentable, and finding a conclusion from that data. As we learned in 3.1, data analysis is conducted for finding useful information from data to make rational decisions. During 3.1, we introduced to some core overarching management of information concepts, such as PESTLE and SWOT. In this section, we will provide an overview of the operations of data analytics; the gathering, synthesising, interpreting and presenting of key data sets.
Advertisement
As it is done for decision making, it is important to understand the sole purpose of data analysis. To re-emphasise . . . the main purpose of data analysis is interpretation, evaluation & organisation of data and to make the data presentable (Foreman: 2013).
There are two methods of data analysis:
1. Qualitative Analysis – underlying meanings, motivations, interpretations 2. Quantitative Analysis – statistics, probabilities and trends. Potentially predictive.
Qualitative Analysis: Qualitative Analysis is done through interviews, openended surveys and observations.
Quantitative Analysis: Quantitative Analysis is done through surveys, statistical analysis and experiments.
The Data Analytics Process includes:
1. Data Collection 2. Working on and honing data quality 3. Building the model
4. Training the model 5. Running the model with full data (SoftwareTestingHelp.com: 2019).
Some tips to analyse the data are:
• Remove unnecessary data before the analysis. • Separate data sets. Keep core data with integrity. (I.e., that it is not corruptible.) You should not perform the analysis on a master copy of data (Hurley: 2019) (SoftwareTestingHelp.com; 2019).
Key concepts within the field of Data Analysis
Data analysis is done with the purpose of finding answers to specific questions. Data analytics techniques are similar to business analytics and business intelligence.
Data Mining is about finding the different patterns in data. For this, various mathematical and computational algorithms are applied to data and new data will get generated.
Data Modelling is about how companies organise or manage the data. Here, various methodologies and techniques are applied to data. Data analysis is required for data modelling (SoftwareTestingHelp.com: 2019)
Modern companies that harness technology and wide-scale use of data analytics can enjoy enormous returns on investment. However, without robust and insightful data management approaches with projects and firms, employees can often become overwhelmed by “information overload” (Pijpers: 2010). Achieving strict, structured management approaches around information gathering, refining and storage has now become a critical operational task for all businesses.
Five Popular Business Analytic Tools
In this section, we will take a look at five popular business data analysis software tools in brief detail along. (There are so many out there and we recommend that you search ‘data analytics tools’ and spend a couple of hours familiarising yourselves with the options.)
1. Zoho Analytics
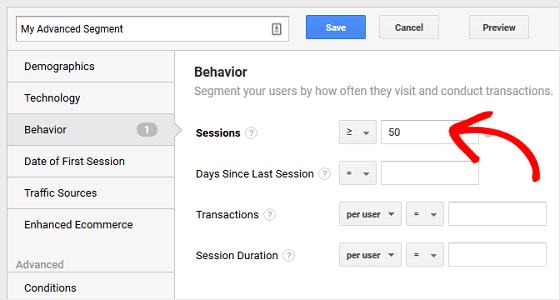
Is a self-service Business Information (BI) and analytics platform. It allows users to create insightful dashboards and visually analyse any data. It features an AIpowered assistant that allows users to ask questions and get intelligent answers in the form of meaningful reports.
Features:
• 100+ readymade connectors for popular business apps, cloud drives, and databases. • Wide variety of visualisation options in the form of Charts, Pivot tables, Summary views, KPI widgets, and Custom themed dashboards. • Unified business analytics that analyses data from across business apps. • Augmented analytics using an AI and ML-powered intelligent assistant that can understand queries asked in natural language. • White label solutions for embedded analytics and BI/analytics portals.
Best Features: Intelligent assistant, unified business analytics, white-label / embedded BI, 100+ connectors with pre-built reports and dashboards.
Verdict: The tool provides smart data alerts and forecasting. It makes use of AI, ML and NLP technologies.
Website: https://www.zoho.com/analytics/
2. Tableau Public
Tableau Public will help you to create charts, graphs, applications, dashboards, and maps. It allows you to share and publish all your creations. It can be used on Windows and Mac operating systems.
It provides solutions for desktop and server and has an online solution too. Tableau Online will allow you to connect with any data, from anywhere. Tableau Public provides six products, which include Tableau Desktop, Tableau Server, Tableau Online, Tableau Prep, Tableau Public, and Tableau Reader.
Features:
• It provides automatic phone and tablet layouts. • It enables you to customise these layouts. • You can create transparent filters, parameters, and highlighters. • You can see the preview of the dashboard zones. • It allows you to join datasets, based on location. • With the help of Tableau Online, you can connect with cloud databases, Amazon Redshift, and Google BigQuery. • Tableau Prep provides features like immediate results, which will allow you to directly select and edit the values.
Verdict: Tableau Public provides many solutions with different features for each solution. The system is easy to use. This tool can be used by an organisation of any size.
Website; https://public.tableau.com/en-us/s/
3. RapidMiner
RapidMiner is a software platform for data preparation, machine learning, deep learning, text mining, and predictive model deployment. It provides all data prep capabilities.
The tool will help data scientists and analysts in improving their productivity through automated machine learning. You will not have to write the code, to do the data analysis with the help of RapidMiner Radoop.
Features:
• Built-in security controls. • Radoop eliminates the need to write the code. • It has a visual workflow designer for Hadoop and Sparx • Radoop enables you to use large datasets for training in Hadoop. • Centralised workflow management. Great for project Managers. • It provides support for Kerberos, Hadoop impersonation, and sentry/ranger. • It groups the requests and reuses Spark containers for smart optimisation of processes. • Team Collaboration.
Verdict: Tool is easy to use. It provides a powerful GUI – Graphical User Interface (screen). Even beginners can use this tool. No coding skills are required. Great tool for machine learning. RapidMiner provides five products for data analysis, RapidMiner Studio, RapidMiner Auto Model, RapidMiner Turbo Prep, RapidMiner Server, and RapidMiner Radoop.
Website: https://rapidminer.com/
4. OpenRefine
OpenRefine is a free and open-source data analysis software.
Even if your data is in a mess, OpenRefine will help you to clean, transform, and extend it. This tool will help you to transform data from one form to another. It will also help you to extend the data using web services and external data. At the time of writing, it is available in fourteen languages.
Features:
• You will be able to work with large data sets easily. • It allows you to link and extend the data using web services. • For some services, you can upload the data to a central database through
OpenRefine. • You can clean and transform the data. • It allows you to import CSV, TSV, XML, RDF, JSON, Google Spreadsheets, and Google Fusion Tables. • You can export the data in TSV, CSV, HTML table, and Microsoft Excel.
Verdict: This desktop application can be used by small, medium, and large companies. It allows you to select multiple rows using filters and apply commands. It supports many file formats for import and export. At the time of writing, you can open a functioning account for free.
Website: http://openrefine.org/
5. Google Fusion Tables
It is a web application that will help you to gather, visualise, and share the information in data tables. It can work with large data sets. You can filter the data from thousands of rows. You can visualise the data through charts, maps, and network graphs.
Features:
• Automatically saves the data to Google Drive. • You can search and view public fusion tables. • Data tables can be uploaded from spreadsheets, CSV, and KML. • Using Fusion Tables API, you can insert, update, and delete the data programmatically as well. • Data can be exported in CSV or KML file formats. • It allows you to publish your data and the published data will always show the real-time data values. • You can merge two tables. This feature will allow you to merge other people’s data.
• Even after merging, if the data of one table is updated then you will see this updated data in the merged table. Location tables can be converted into maps.
Verdict: As it is a free web-based application, it can be accessed through a browser on any system. With fusion tables, you can work with large data sets. It allows to merge table of the other people with yours, but at the same time, it also provides privacy options. You can easily share the data through links.
Reflective Exercise
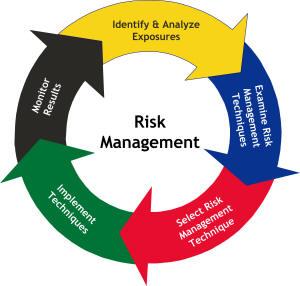
In your private notebooks. Pijpers cites “information overload” as being a significant risk for employees and project managers. Imagine that you are data management director for a multinational insurance firm specialising in military vehicles. You are tasked to run a project team that looks at the risk facing your clients who exist in almost every country. What data sources and data analytics tools would you choose to assist with this project and why?
Further Reading:
Foreman, J. (2013) Data Smart: Using Data Science to Transform Information into Insight. London: Wiley Hurley, R. (2019) Predictive Analytics: The Secret to Predicting Future Events Using Big Data and Data Science Techniques Such as Data Mining, Predictive Modelling, Statistics, Data Analysis, and Machine Learning. Amazon Media (Kindle) Pijpers, G. (2010) Information Overload: a system for better managing everyday data. London: Wiley
References:
Foreman, J. (2013) Data Smart: Using Data Science to Transform Information into Insight. London: Wiley SoftwareTestingHelp.com (2019) 10 Best Data Analysis Tools For Perfect Data Management. Accessed on 20/1/2020 at:
https://www.softwaretestinghelp.com/data-analysis-tools/
Ibid. Ibid.
Hurley, R. (2019) Predictive Analytics: The Secret to Predicting Future Events Using Big Data and Data Science Techniques Such as Data Mining, Predictive Modelling, Statistics, Data Analysis, and Machine Learning. Amazon Media (Kindle) Pijpers, G. (2010) Information Overload: a system for better managing everyday data. London: Wiley