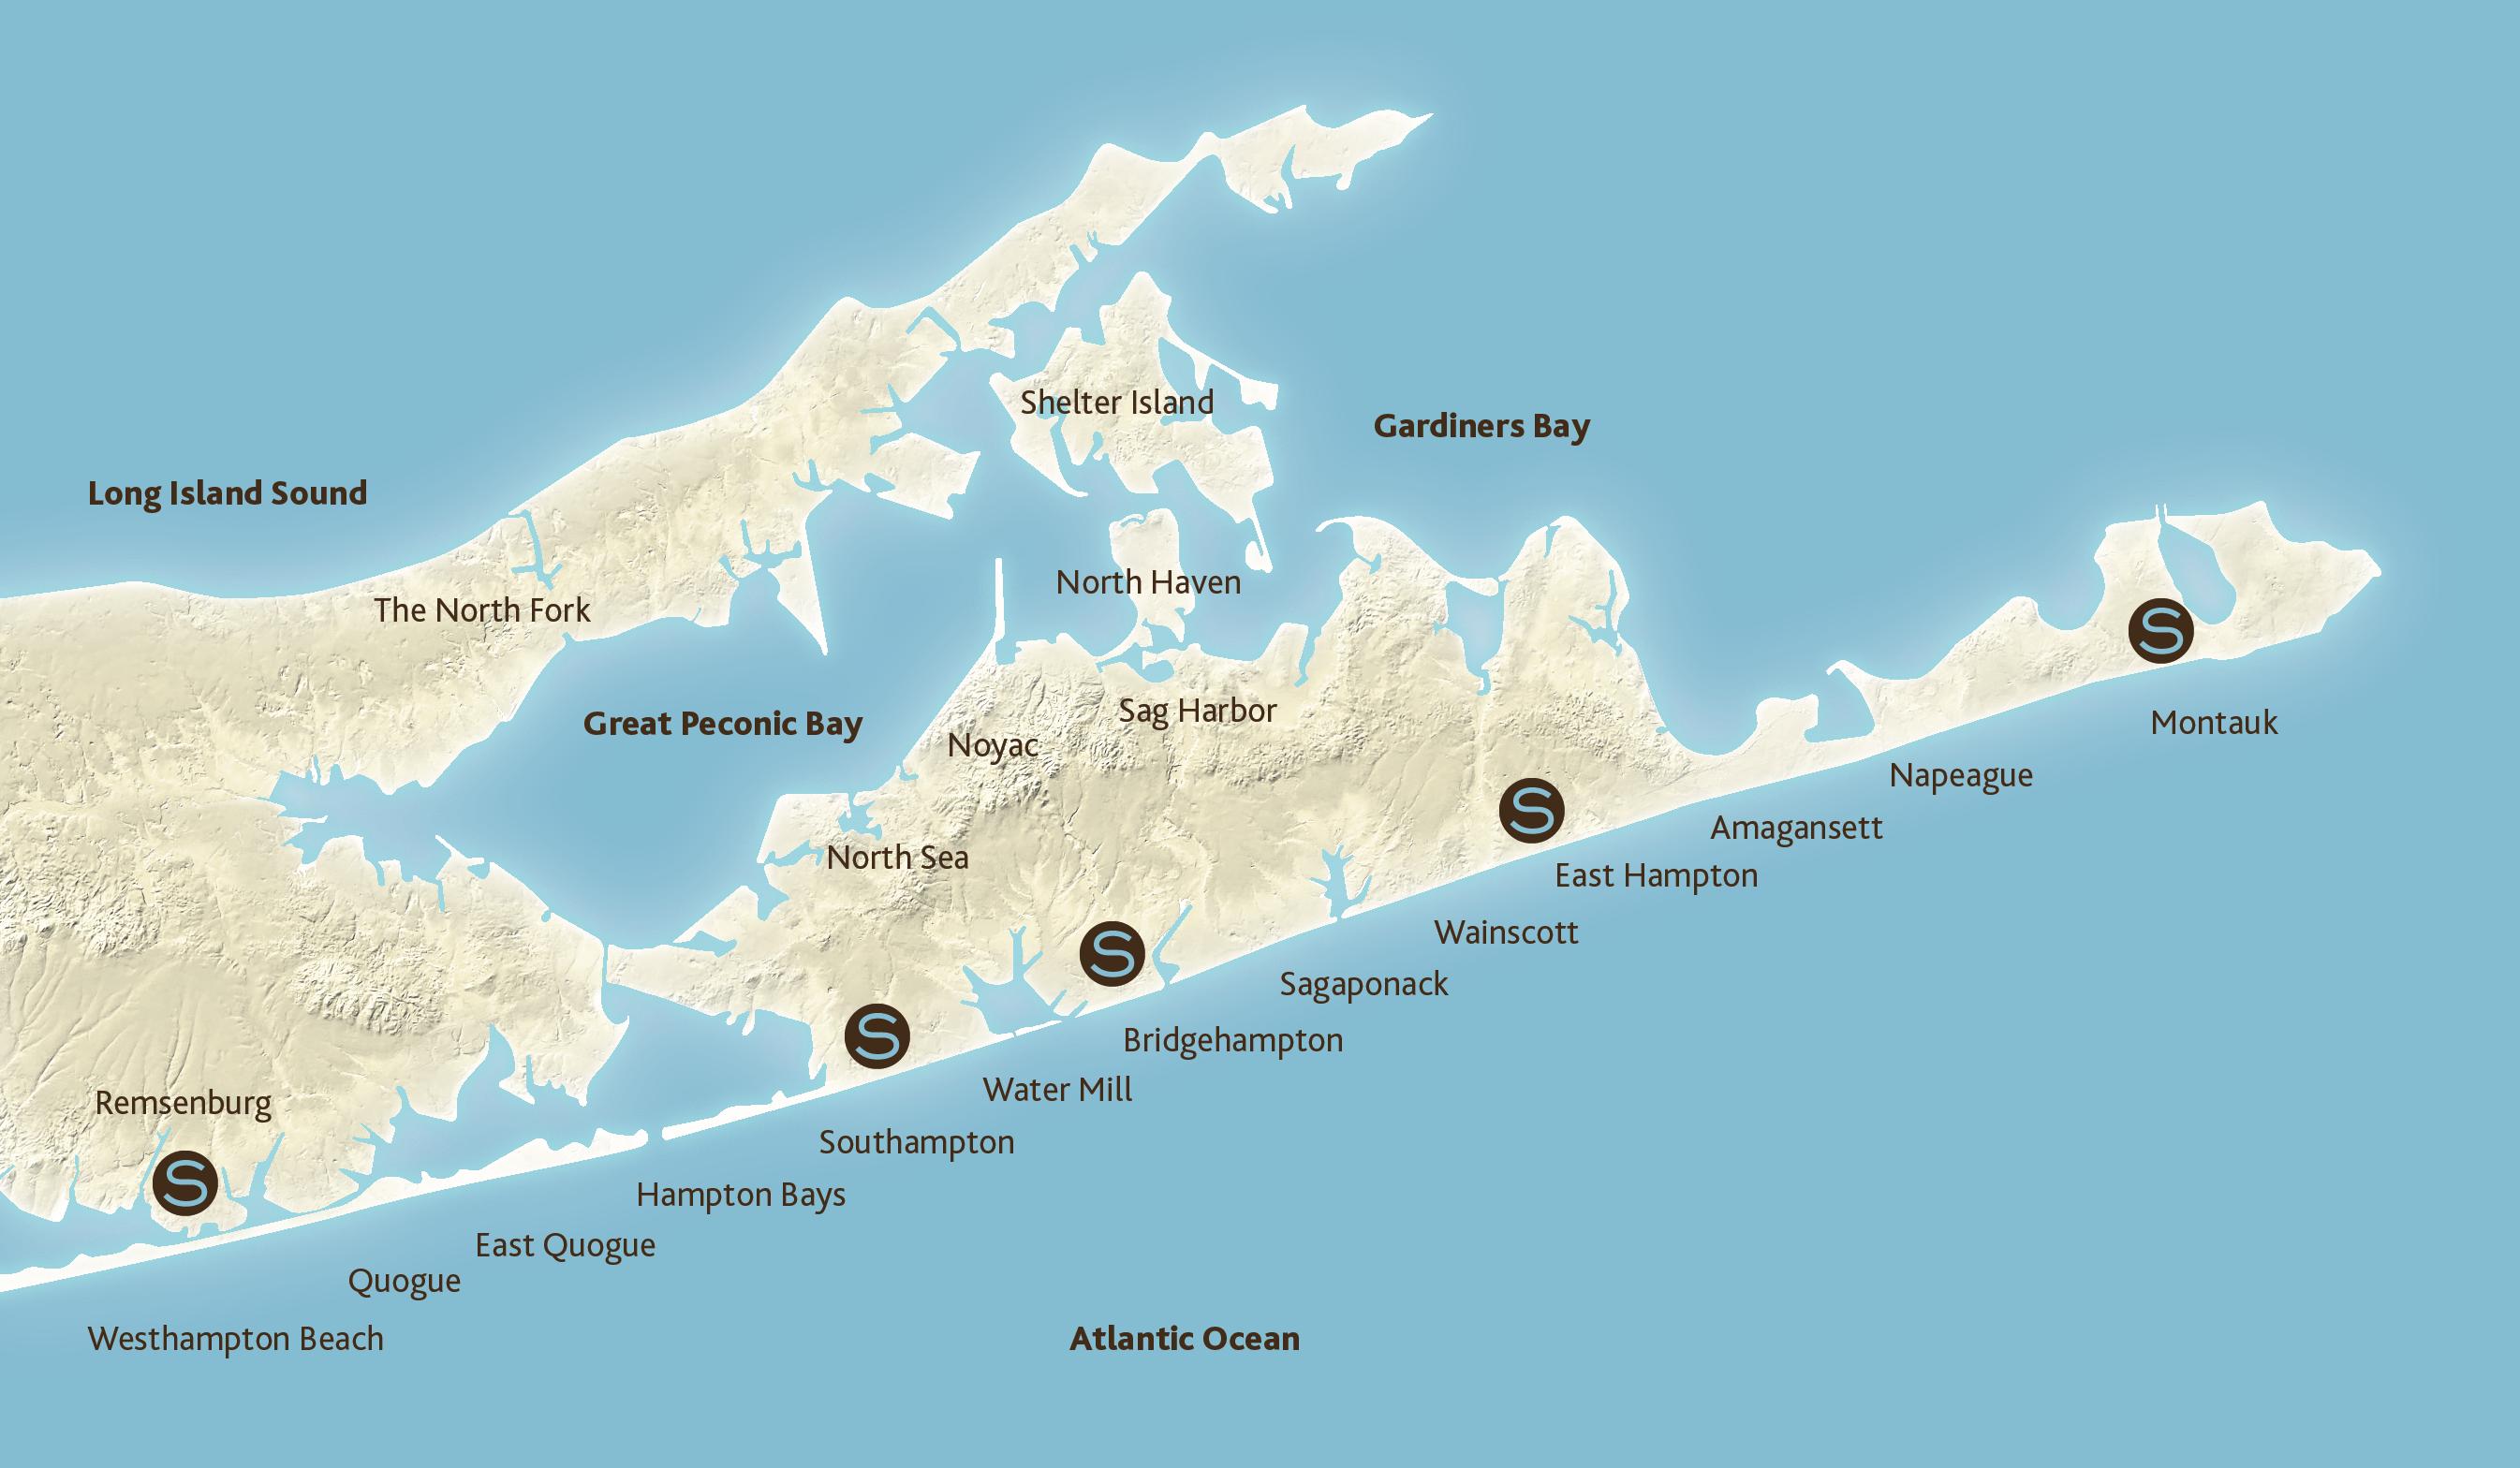
hamptons real estate market report SaundersMarketReport.com FIRST HALF 2023 PUBLISHED AUGUST 16TH, 2023 amagansett bridgehampton east hampton east quogue hampton bays montauk north haven quogue remsenburg sagaponack sag harbor shelter island southampton wainscott water mill westhampton
THE HAMPTONS LEADING REAL ESTATE BROKERAGE FIRM

$4.55 BILLION SOLD AND RENTED IN 2021 + 2022
Saunders & Associates’ unique model for getting our listings seen and sold continues to capture market share and establish new performance milestones.
hamptons real estate market
ALL HAMPTONS - Q2 2022 VS. 2023
ALL HAMPTONS - FIRST HALF 2022 VS. 2023
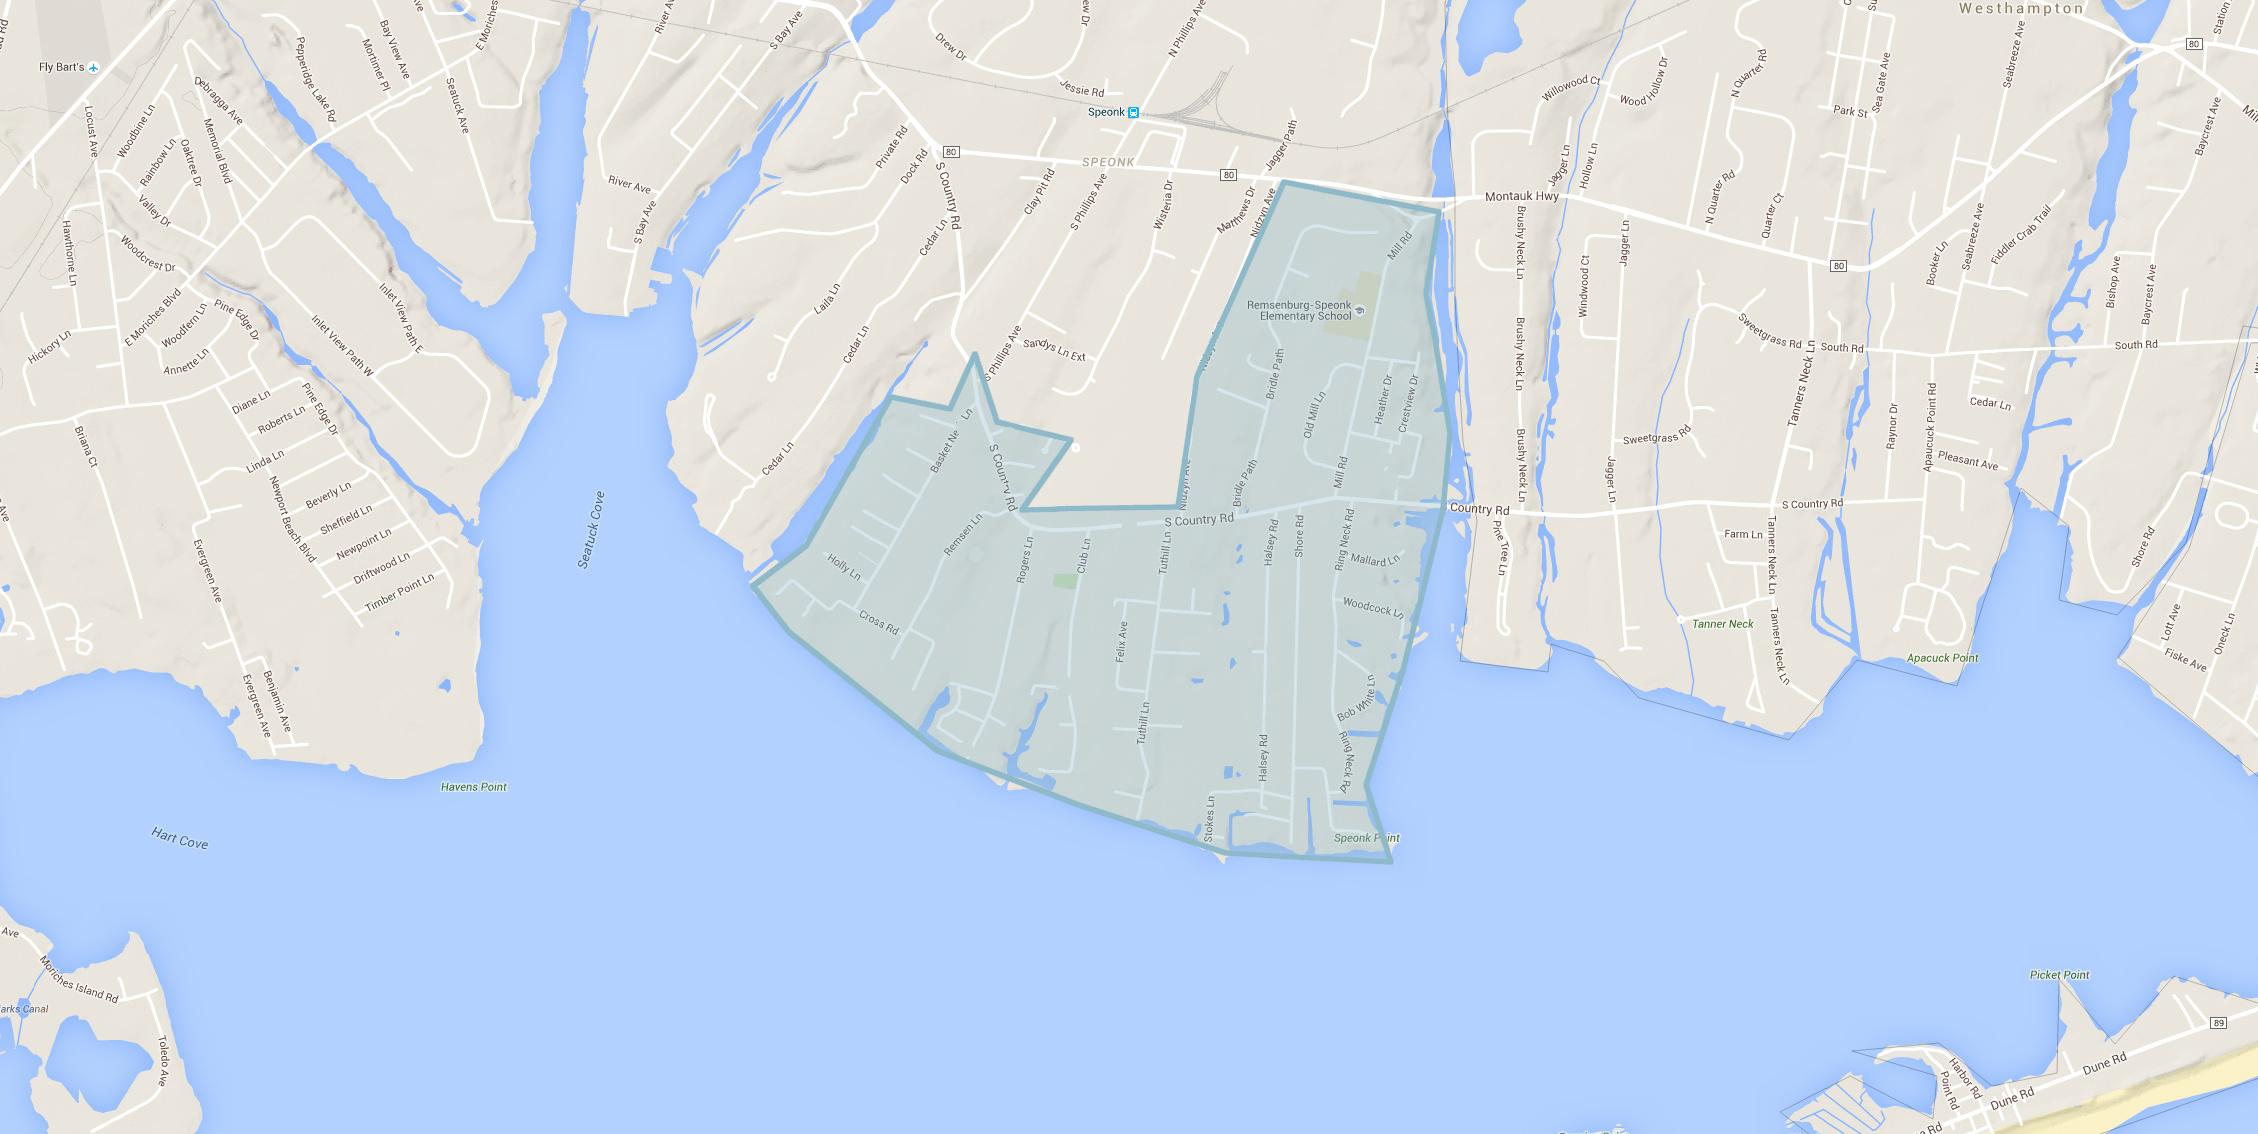
REMSENBURG
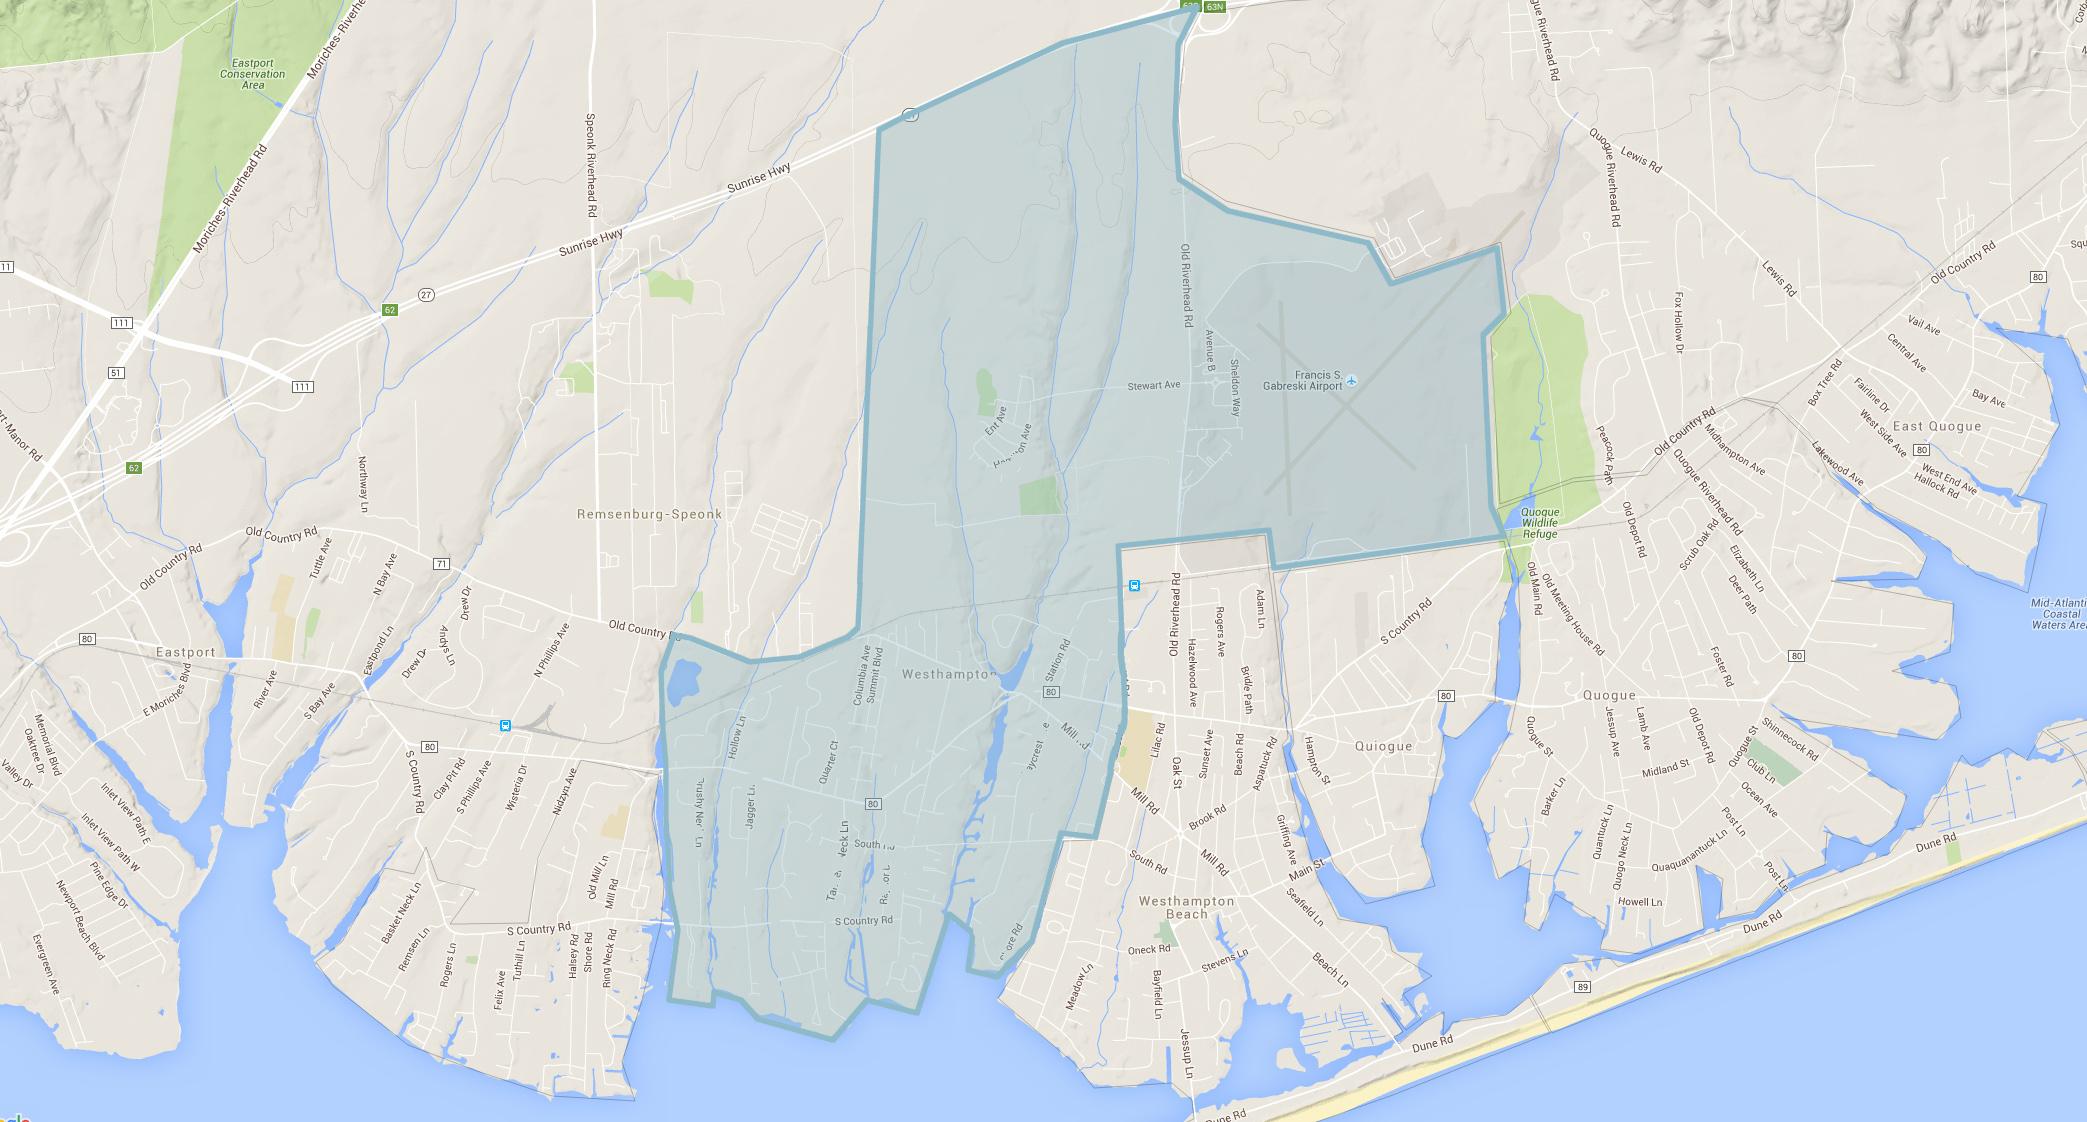
WESTHAMPTON
VILLAGE OF WESTHAMPTON BEACH
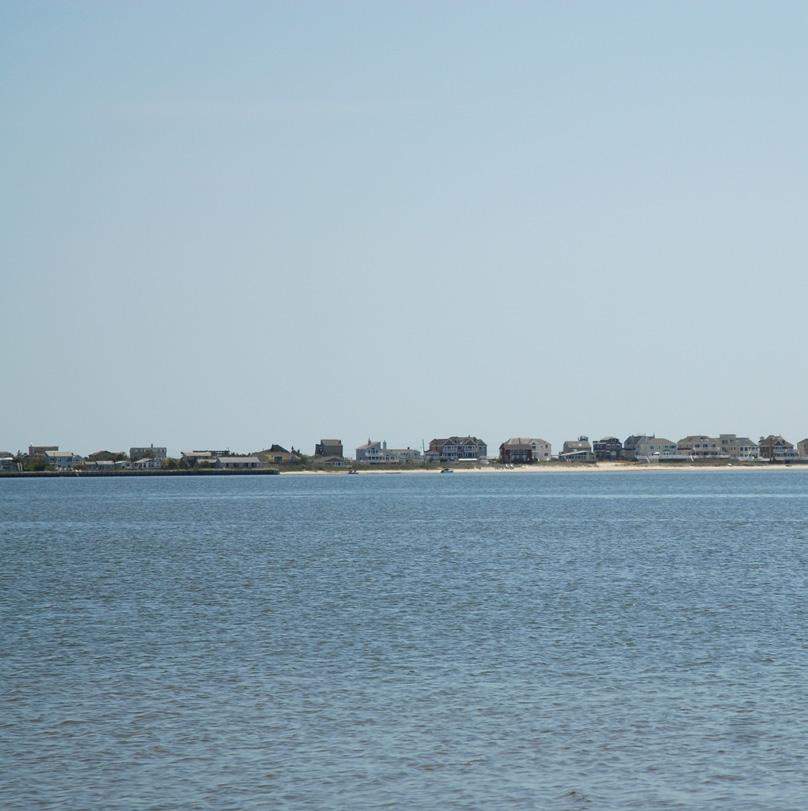
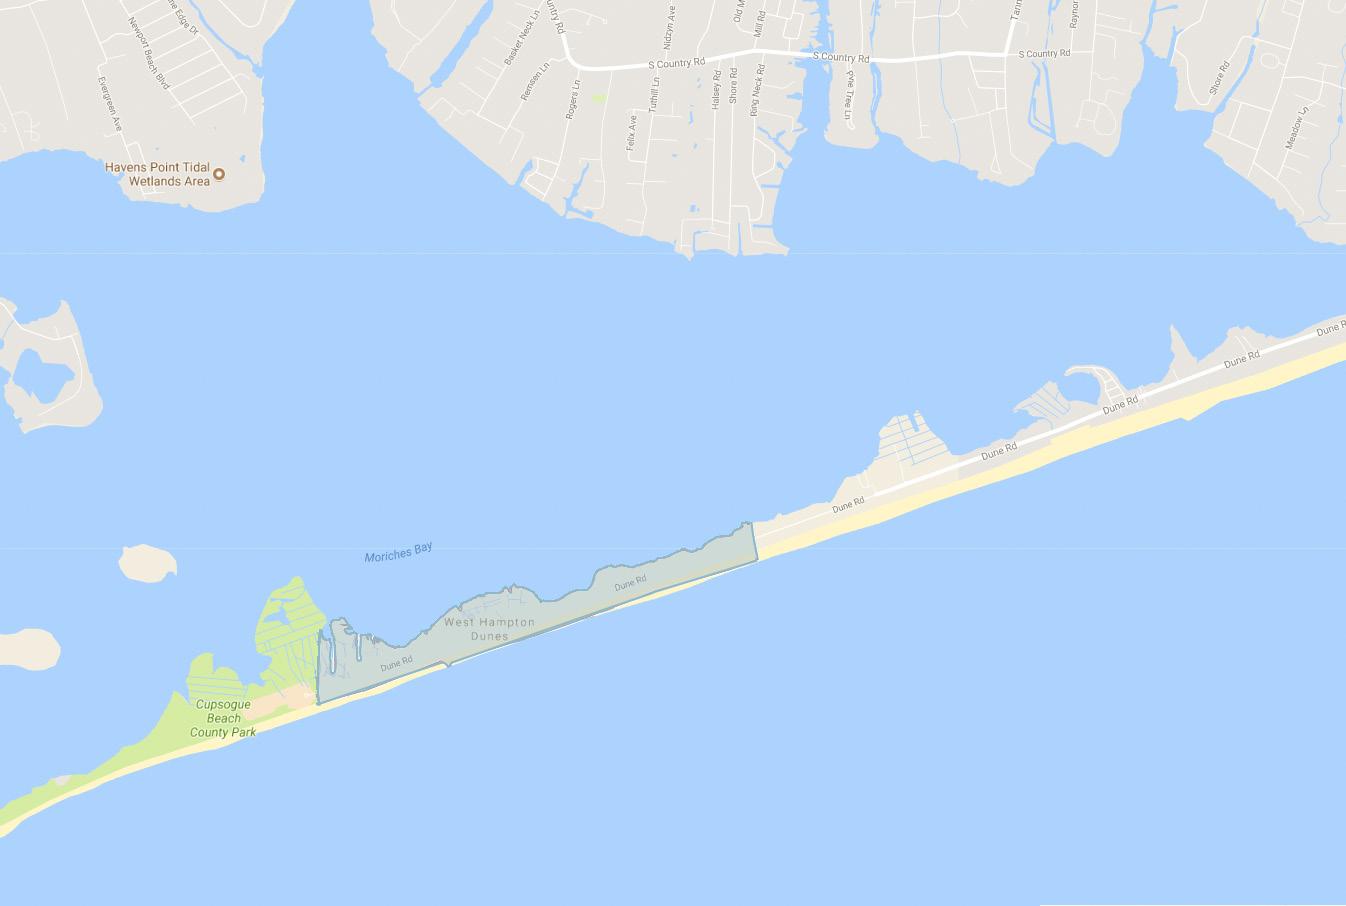
WEST HAMPTON DUNES
QUIOGUE
QUOGUE VILLAGE
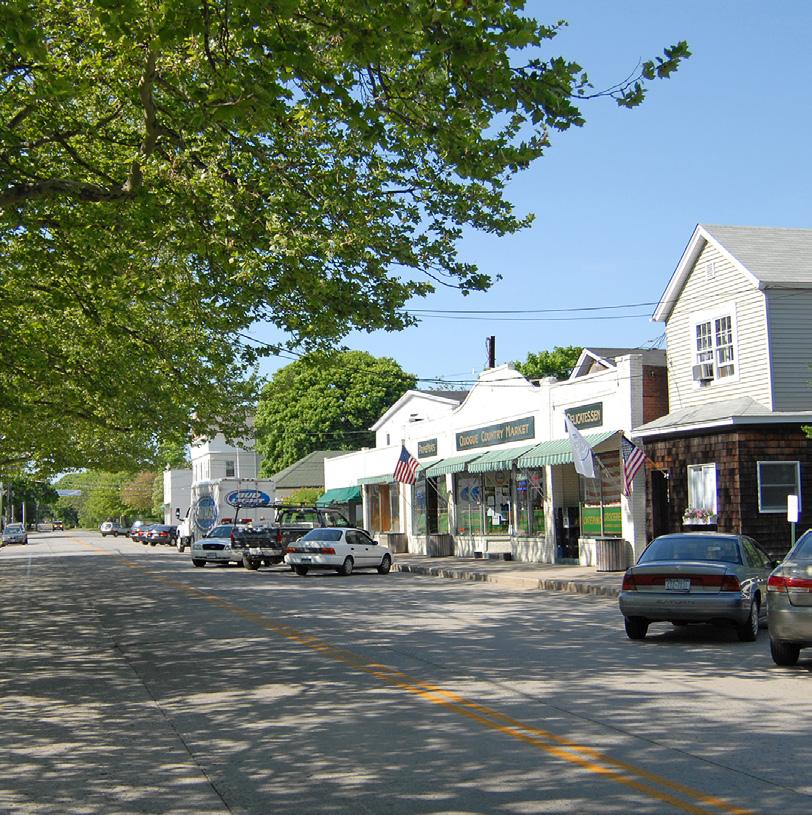
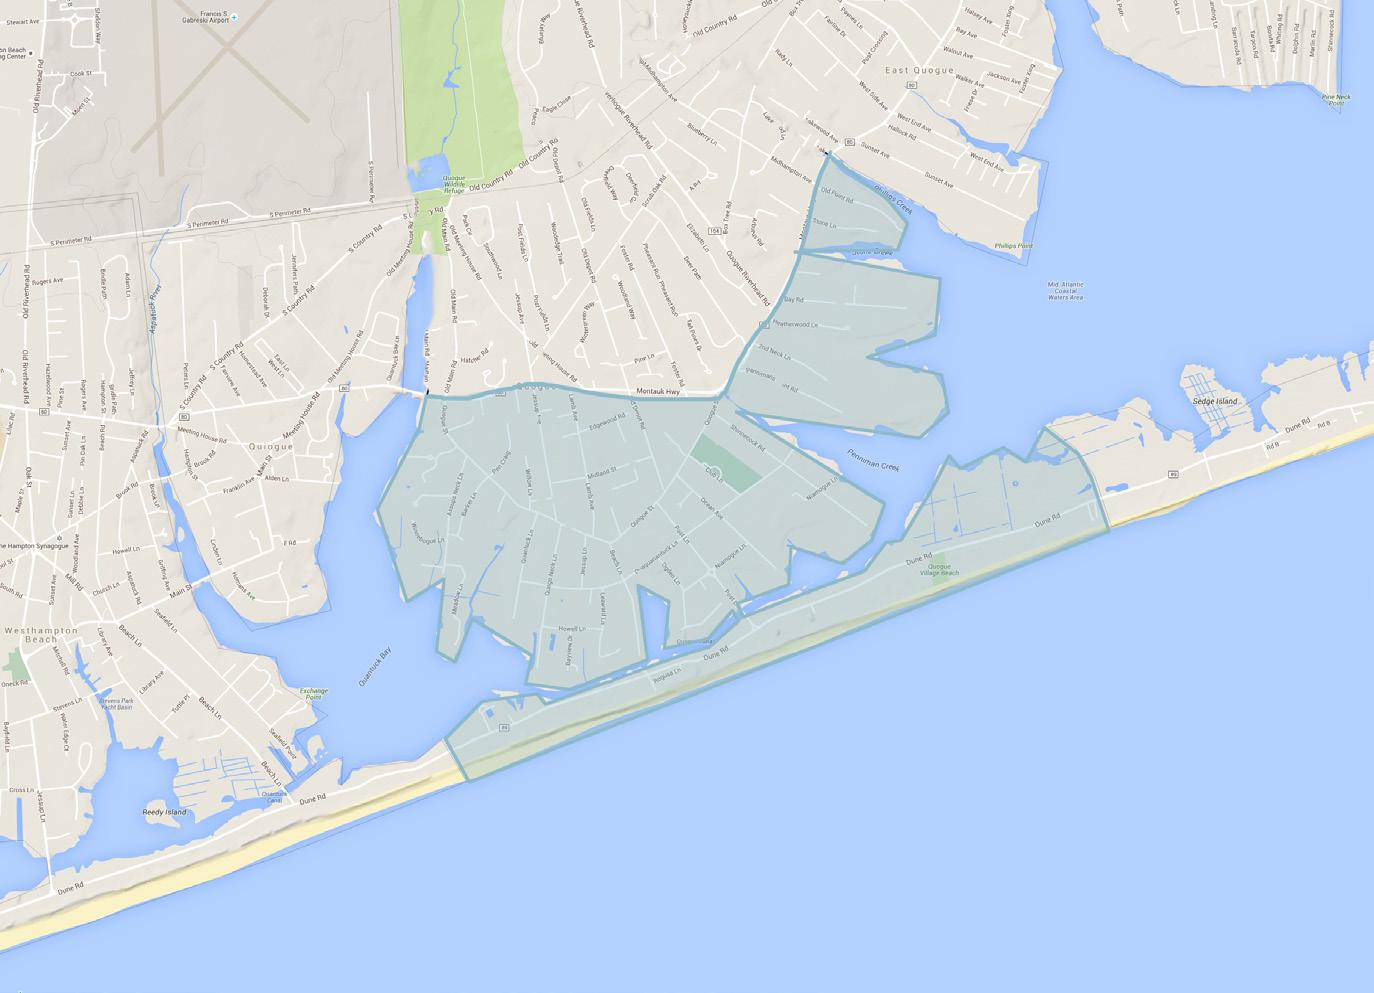
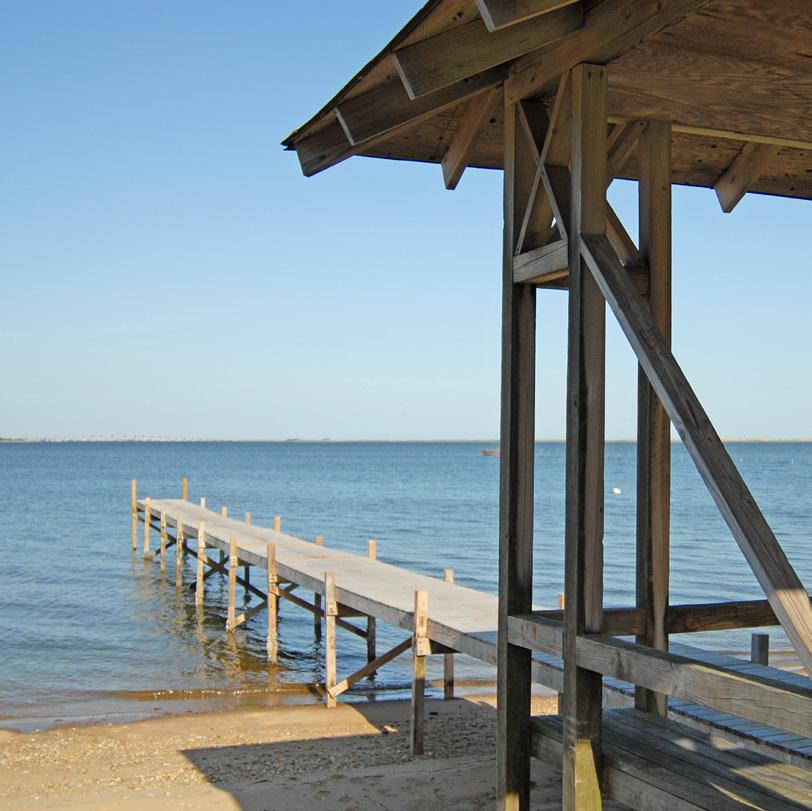
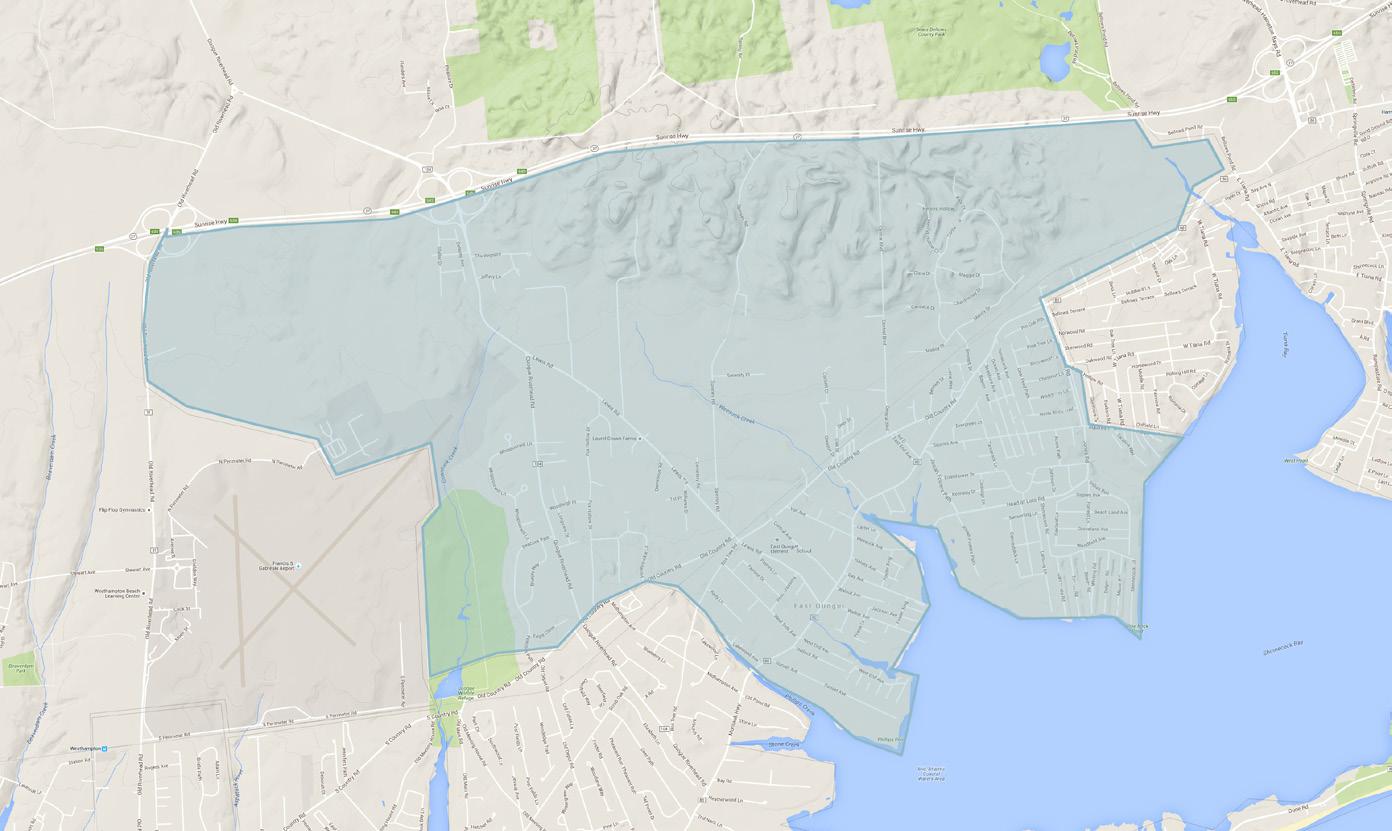
EAST QUOGUE
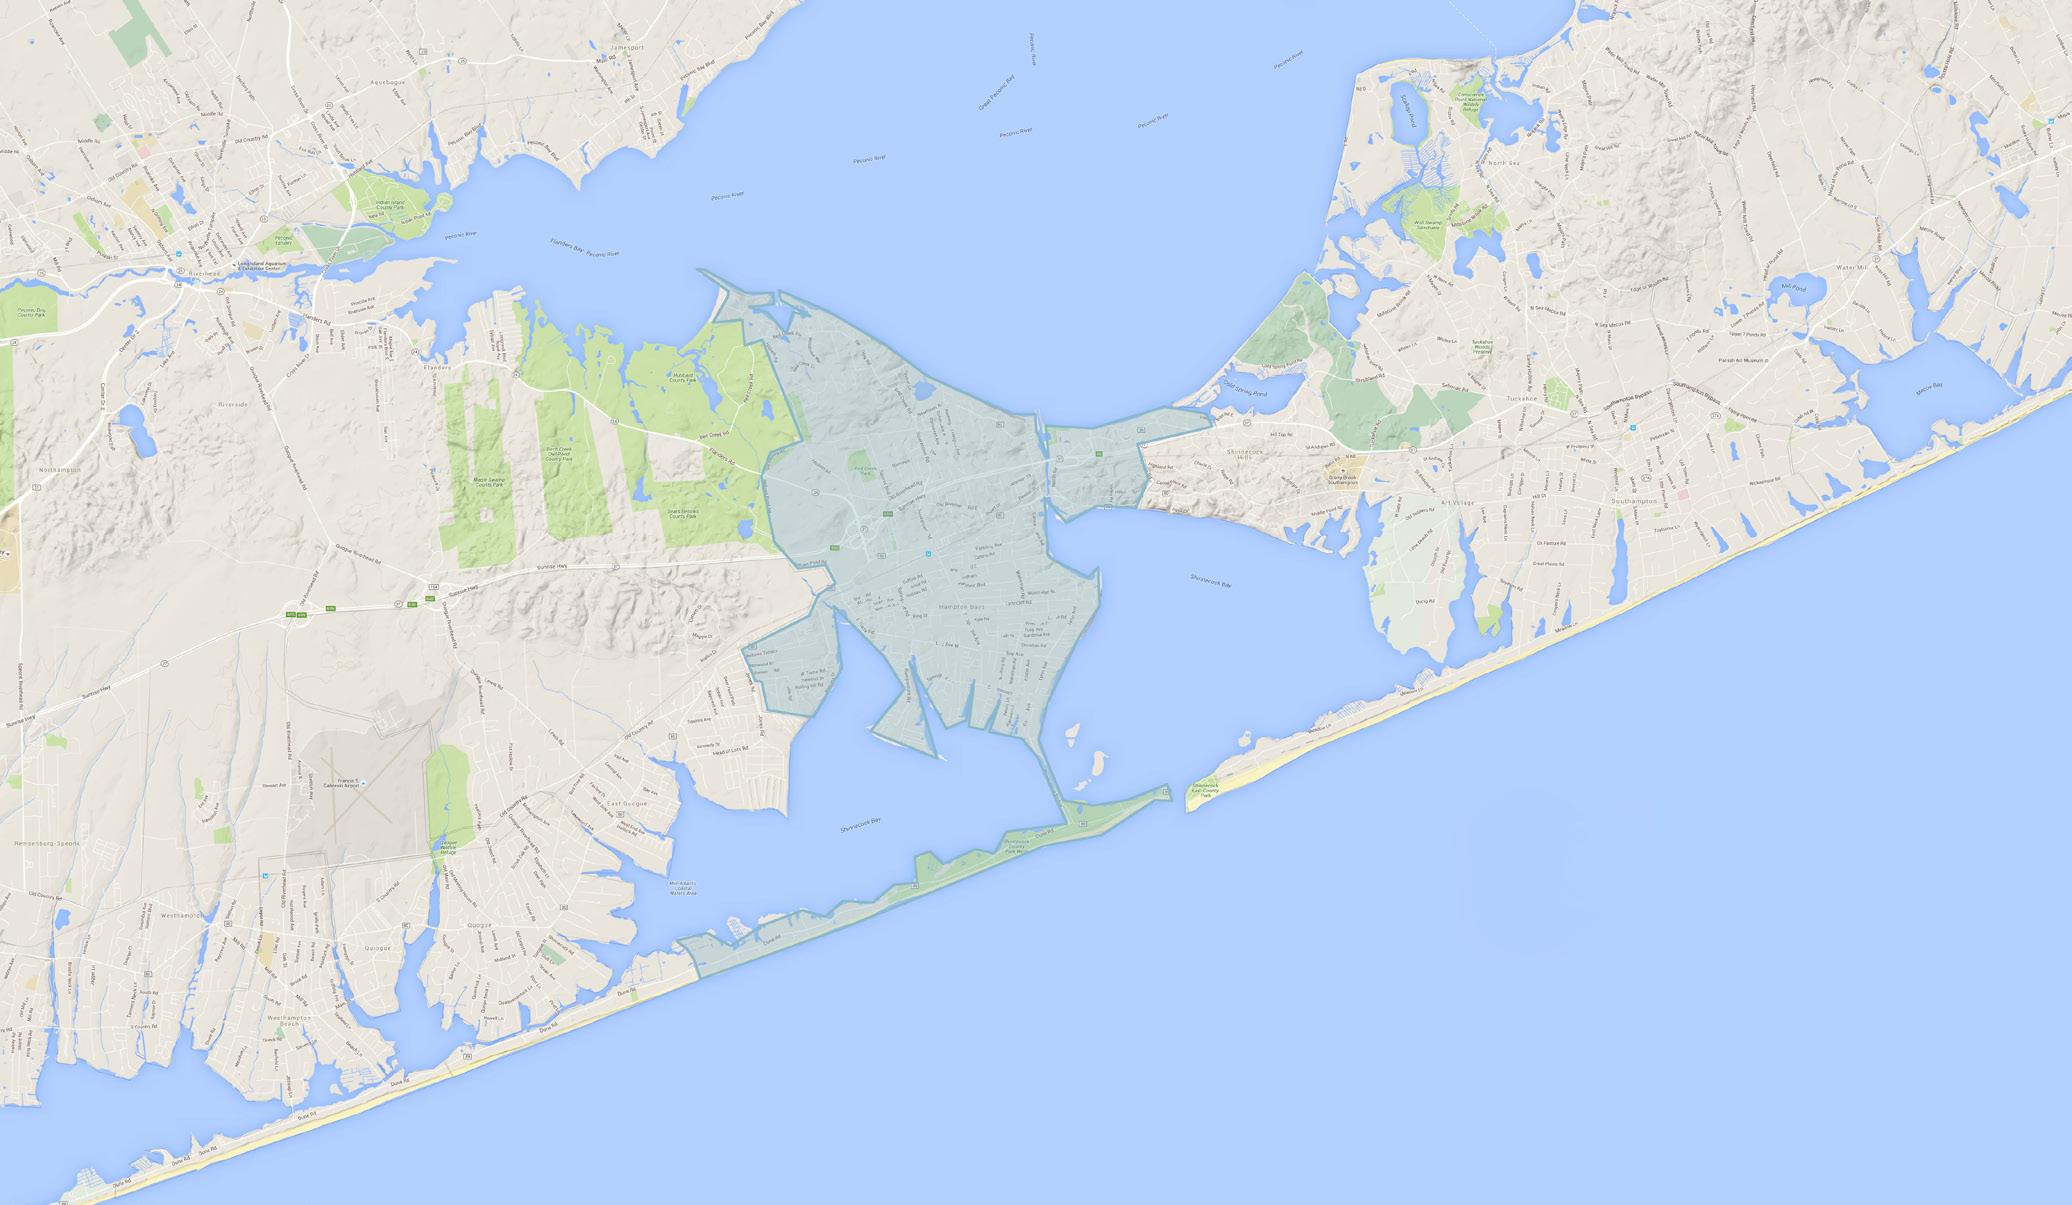
HAMPTON BAYS
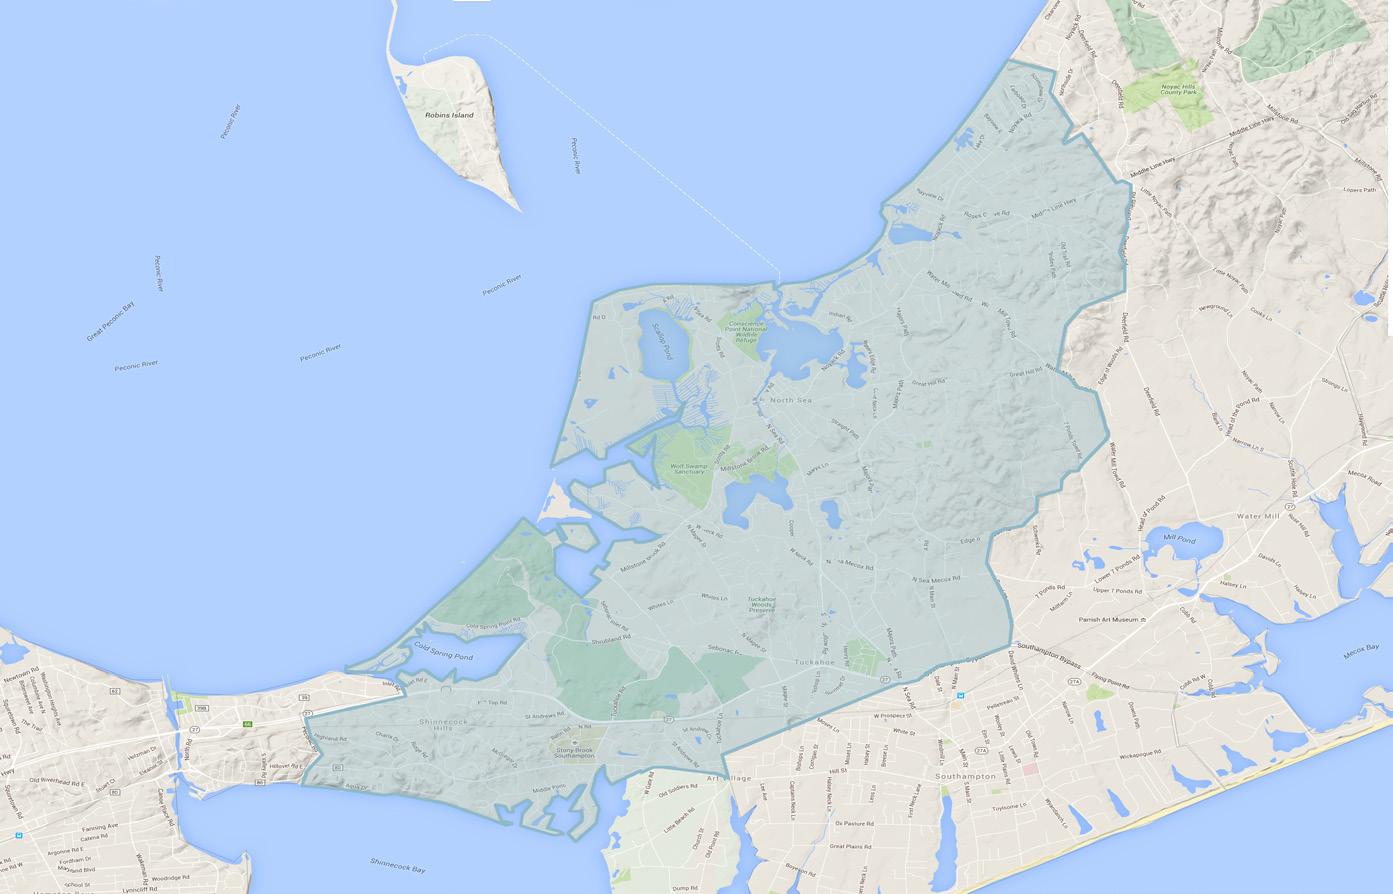
SOUTHAMPTON
SOUTHAMPTON VILLAGE
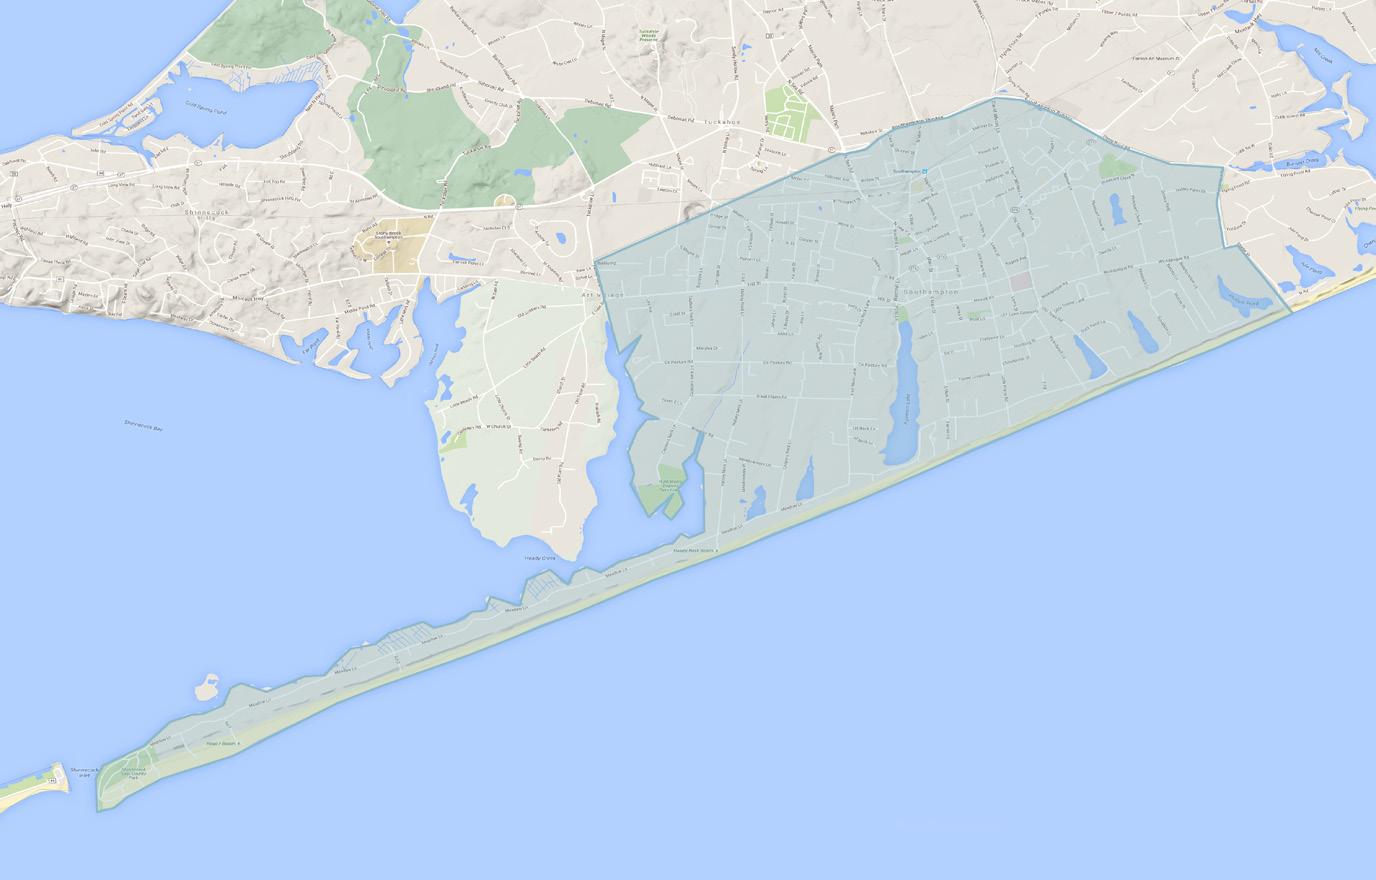
WATER MILL
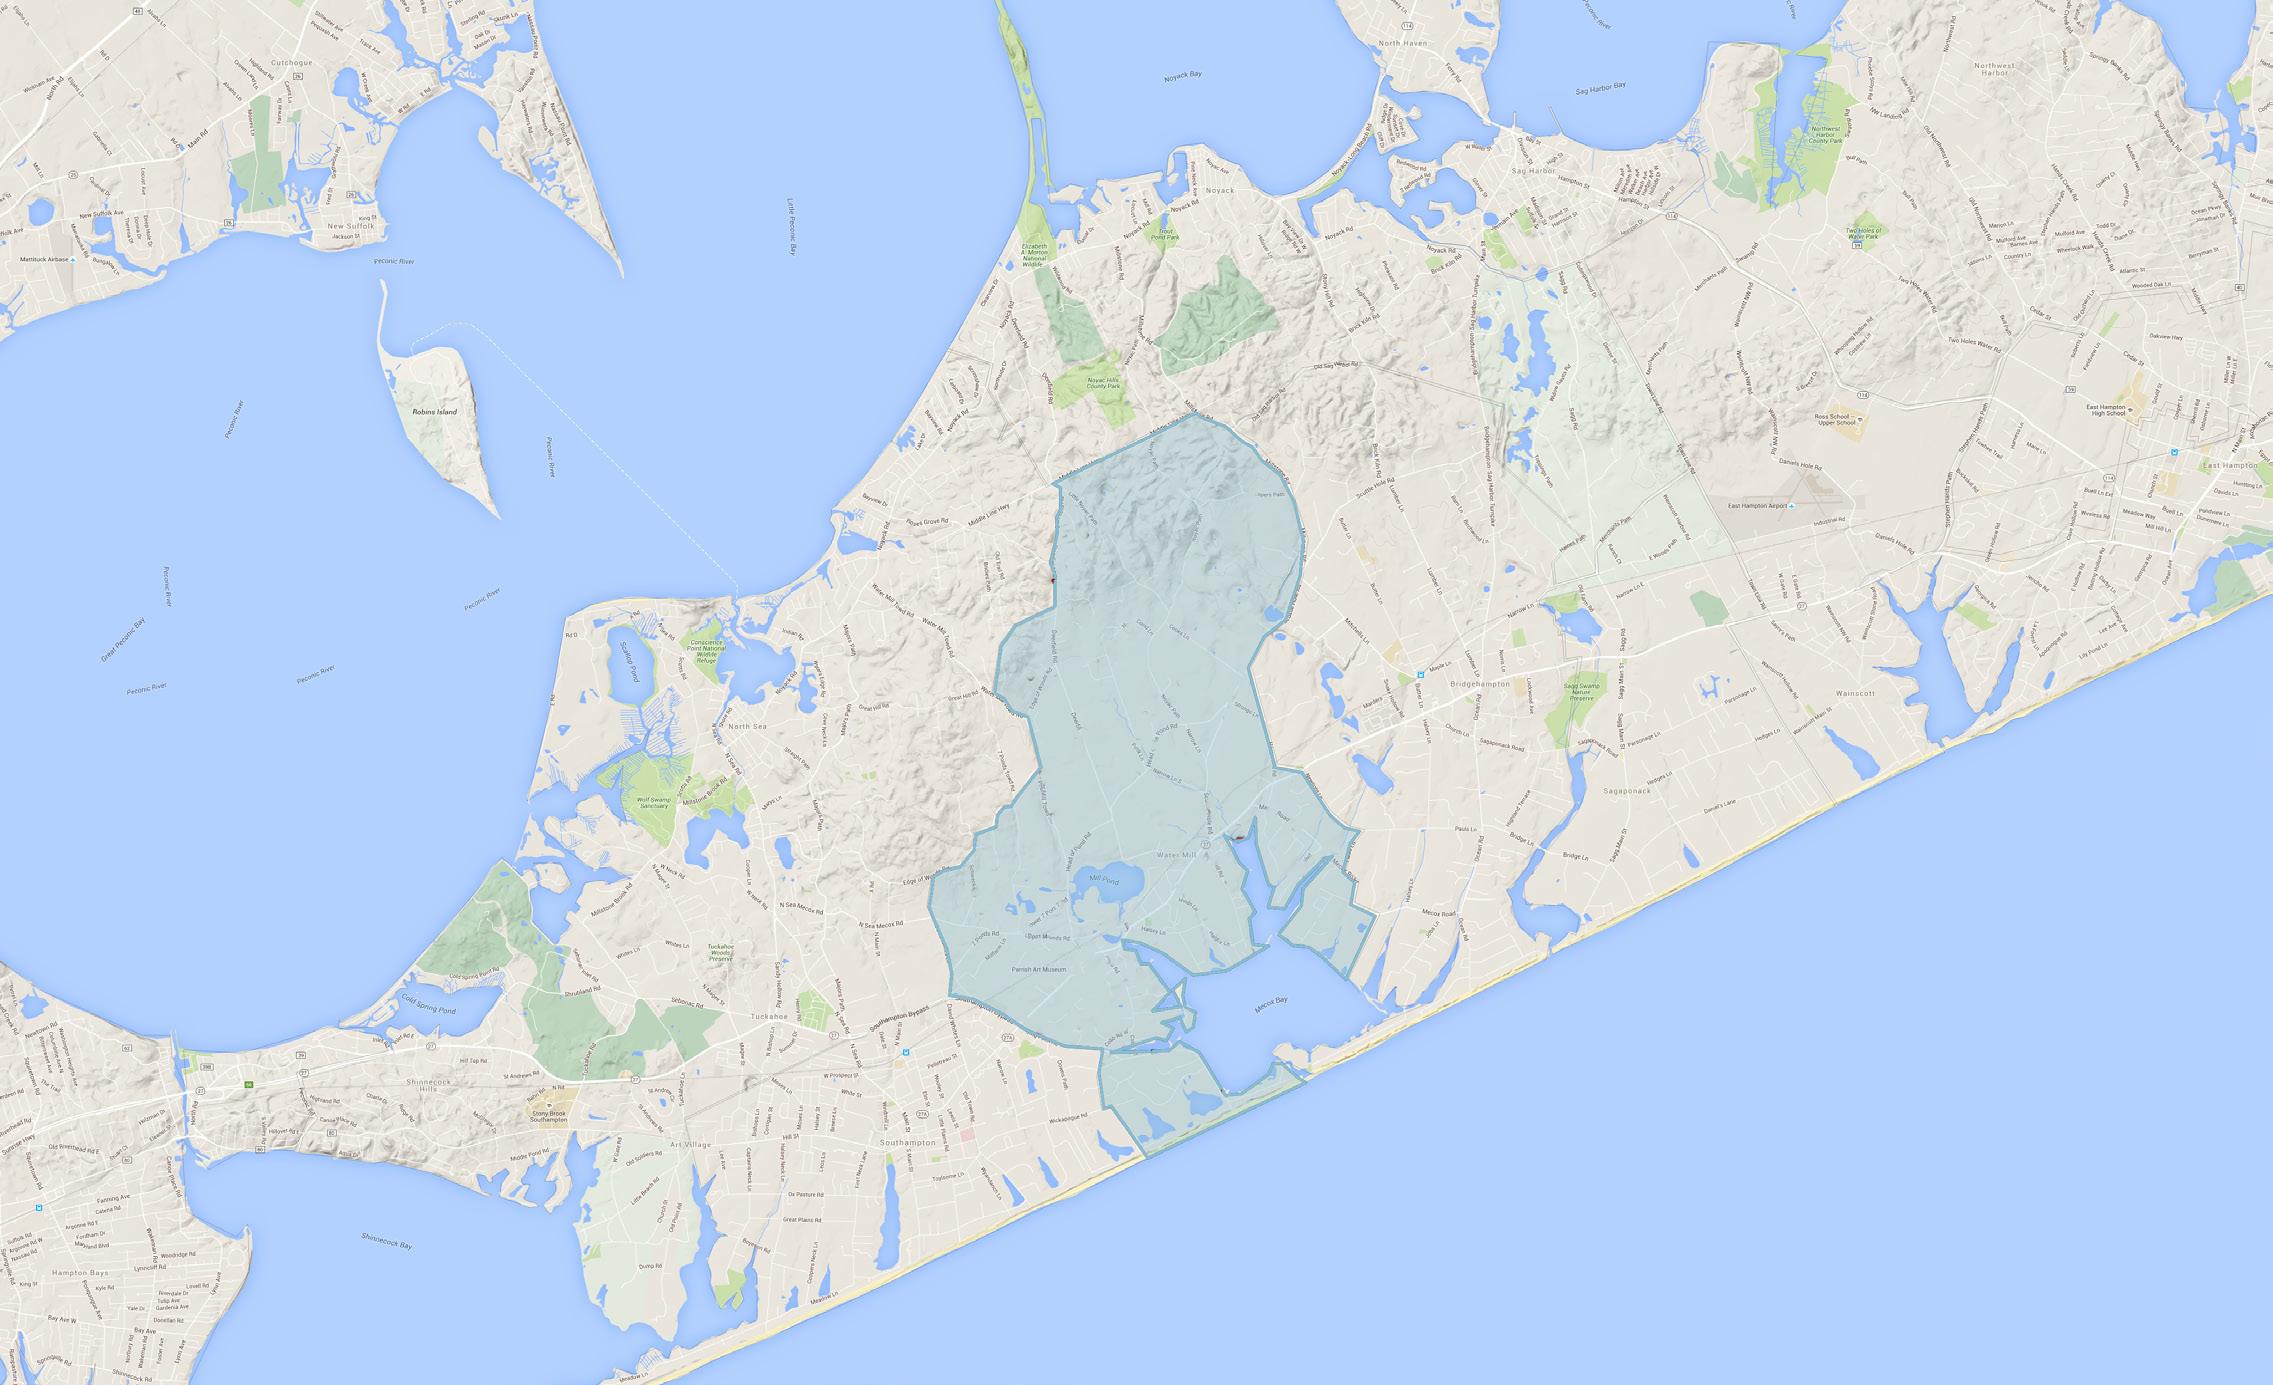
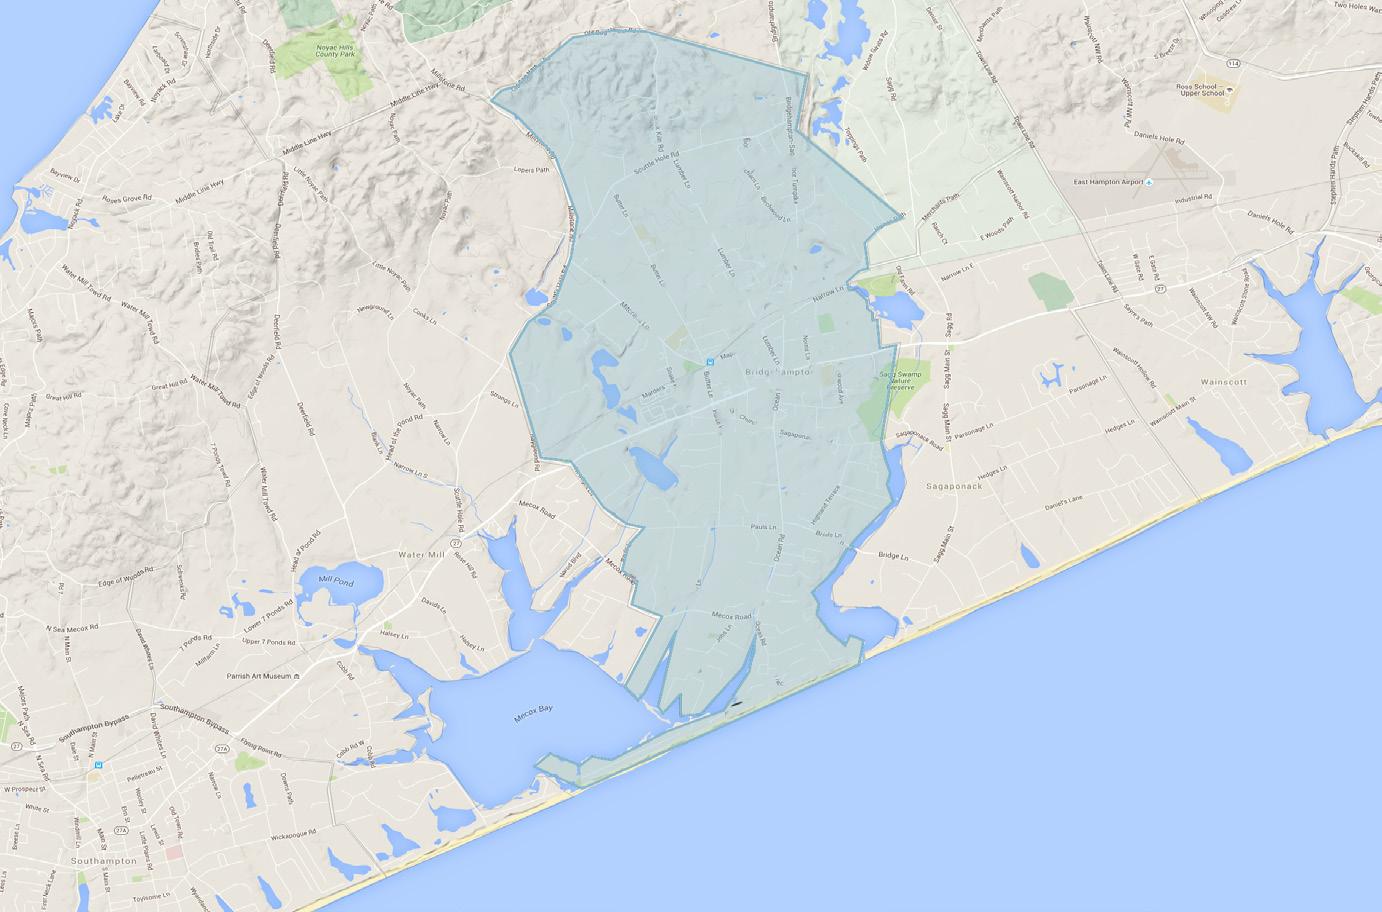
BRIDGEHAMPTON
SAG HARBOR
SAG HARBOR VILLAGE
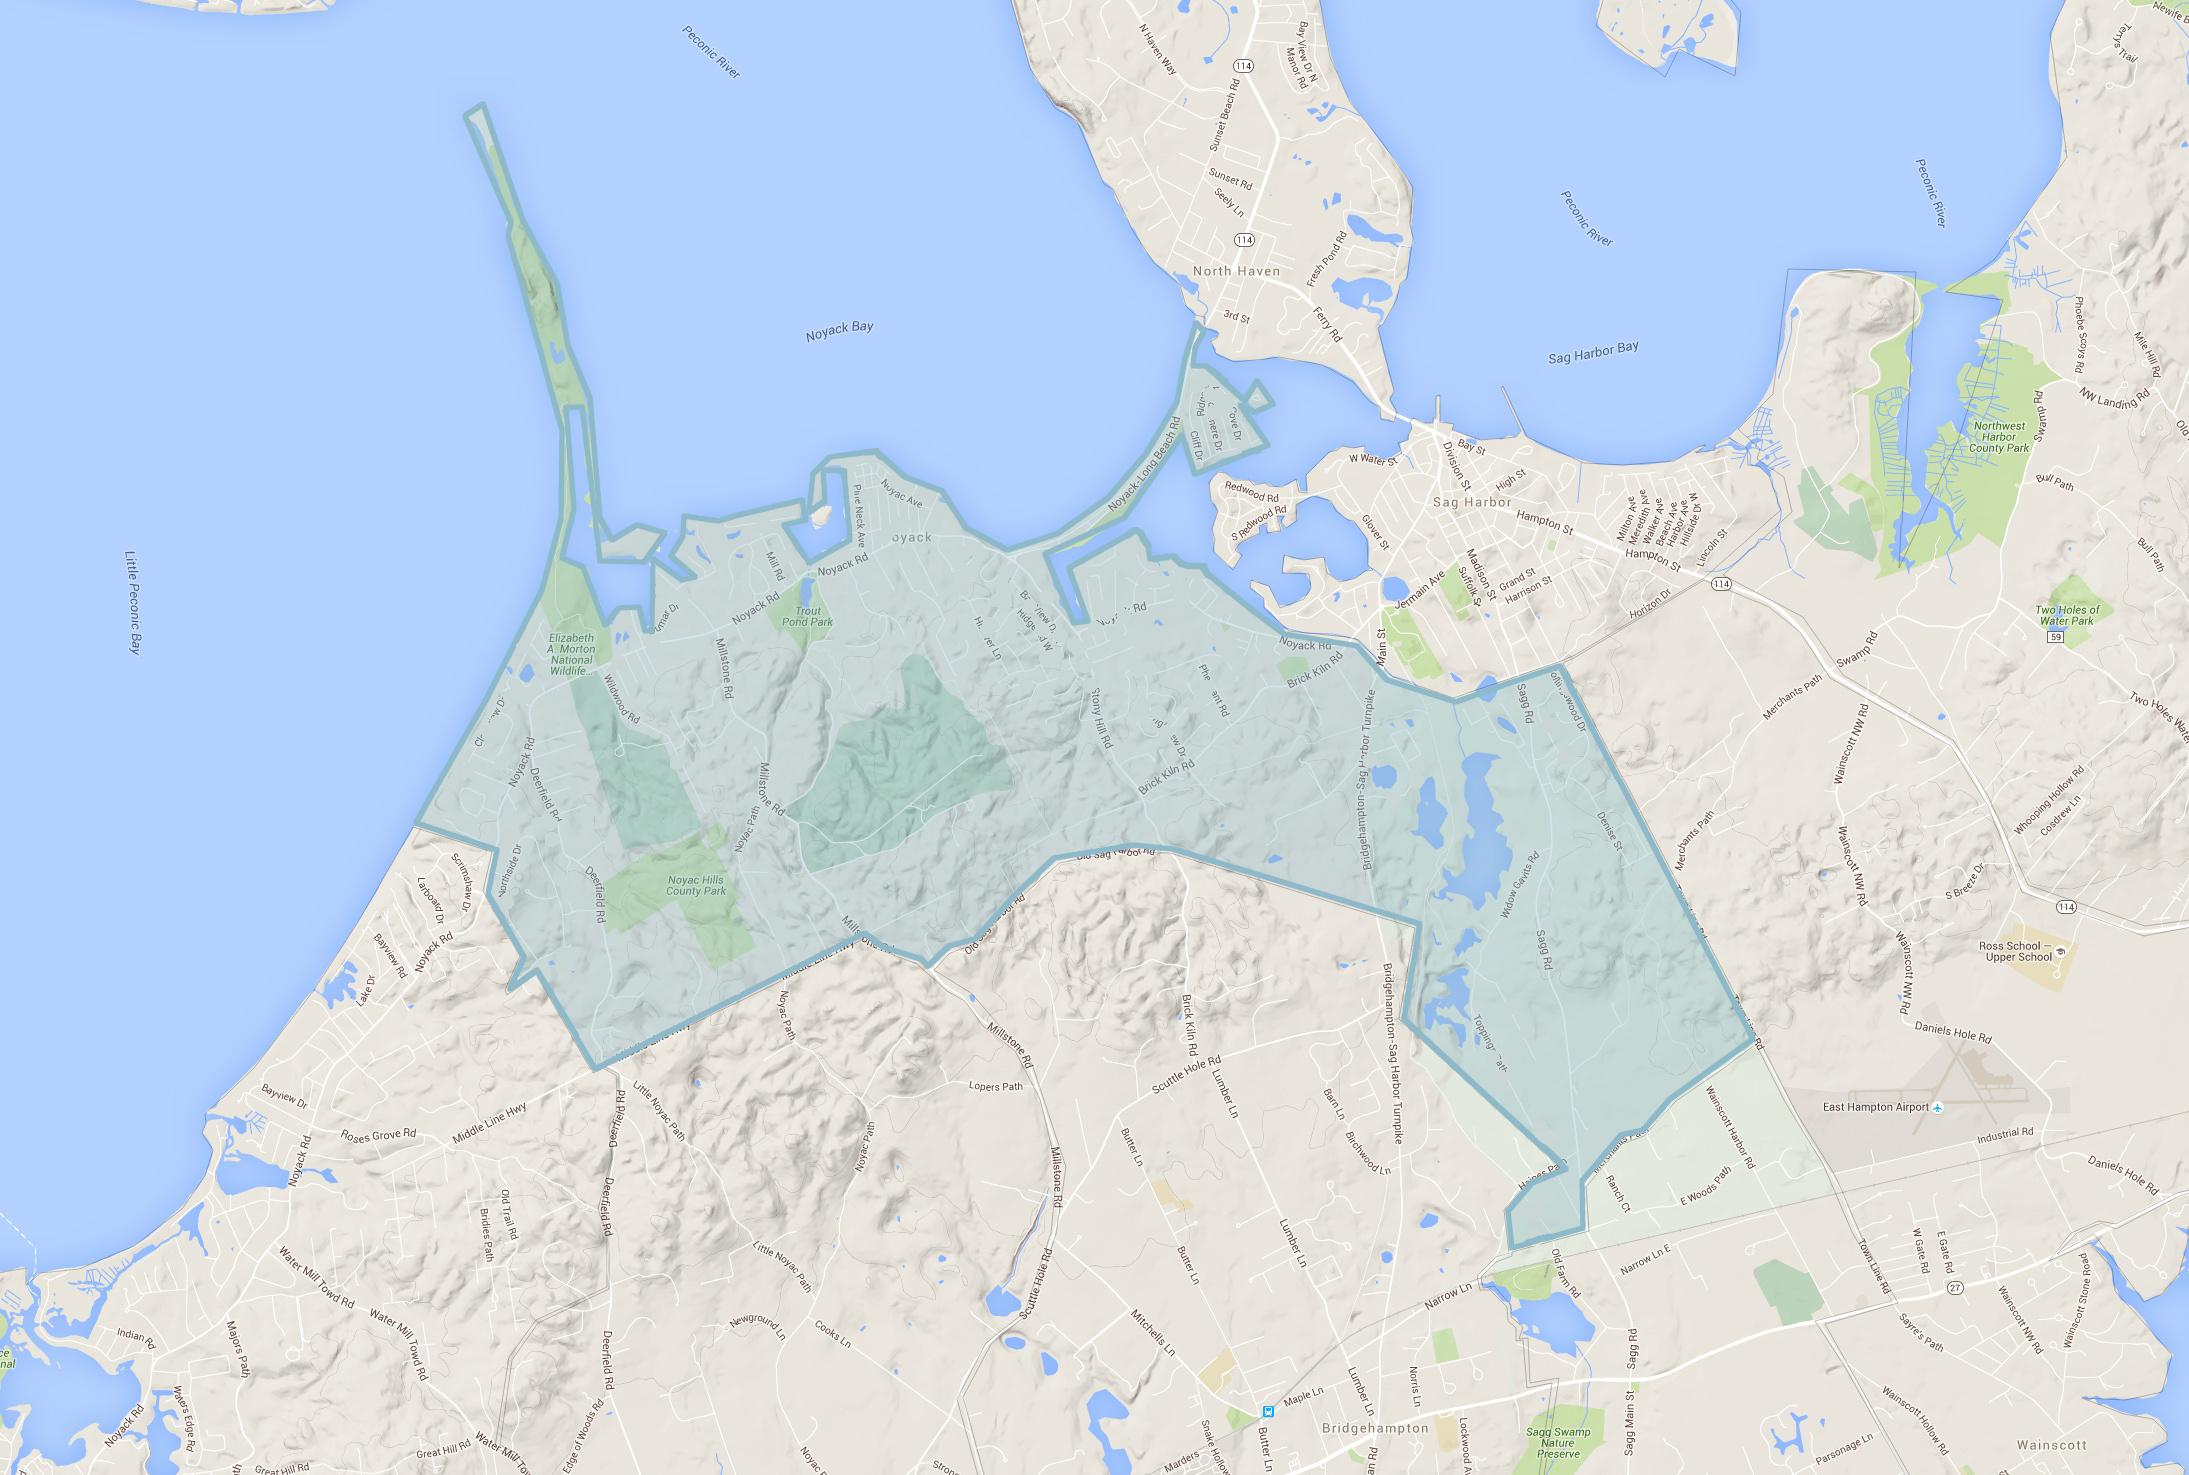
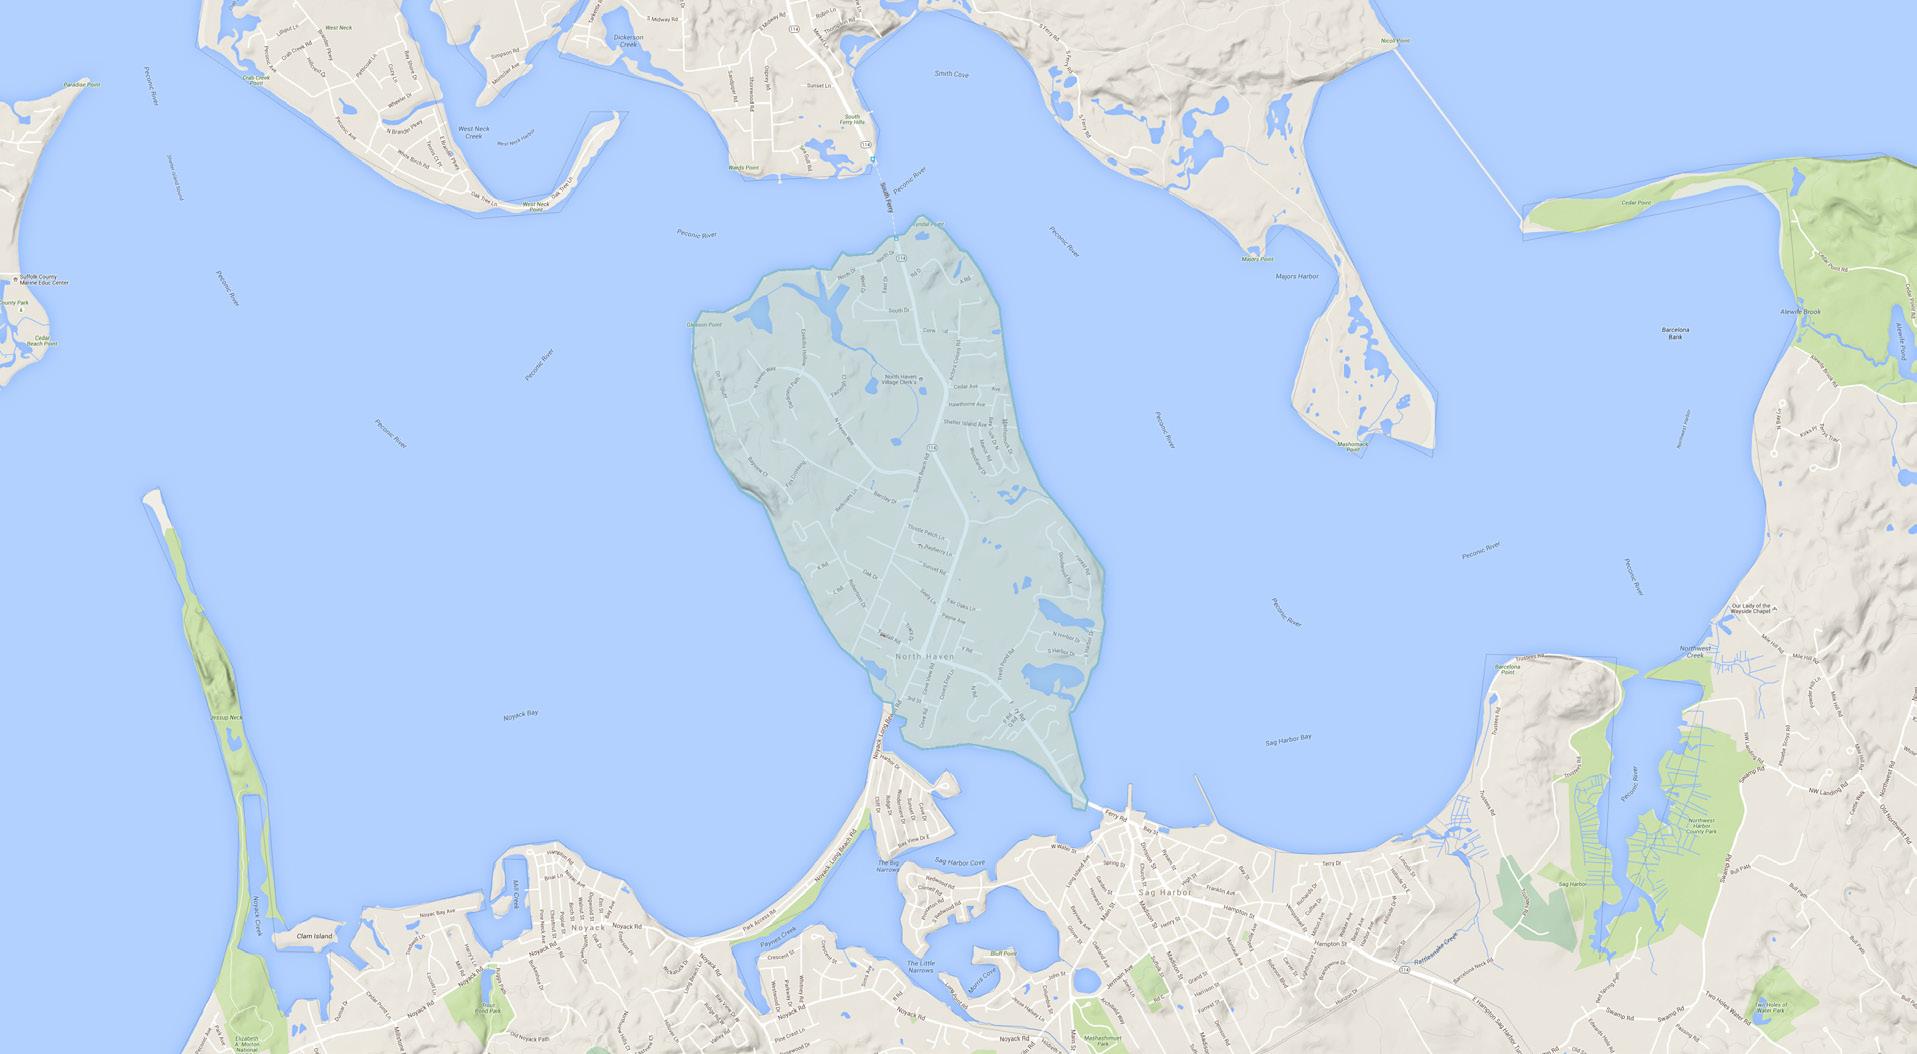
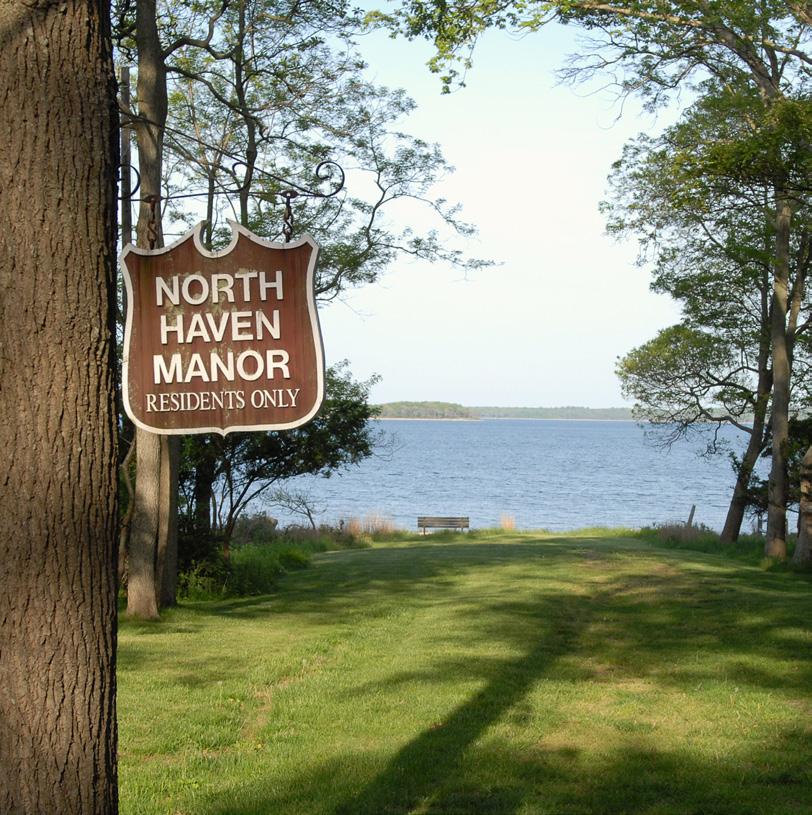
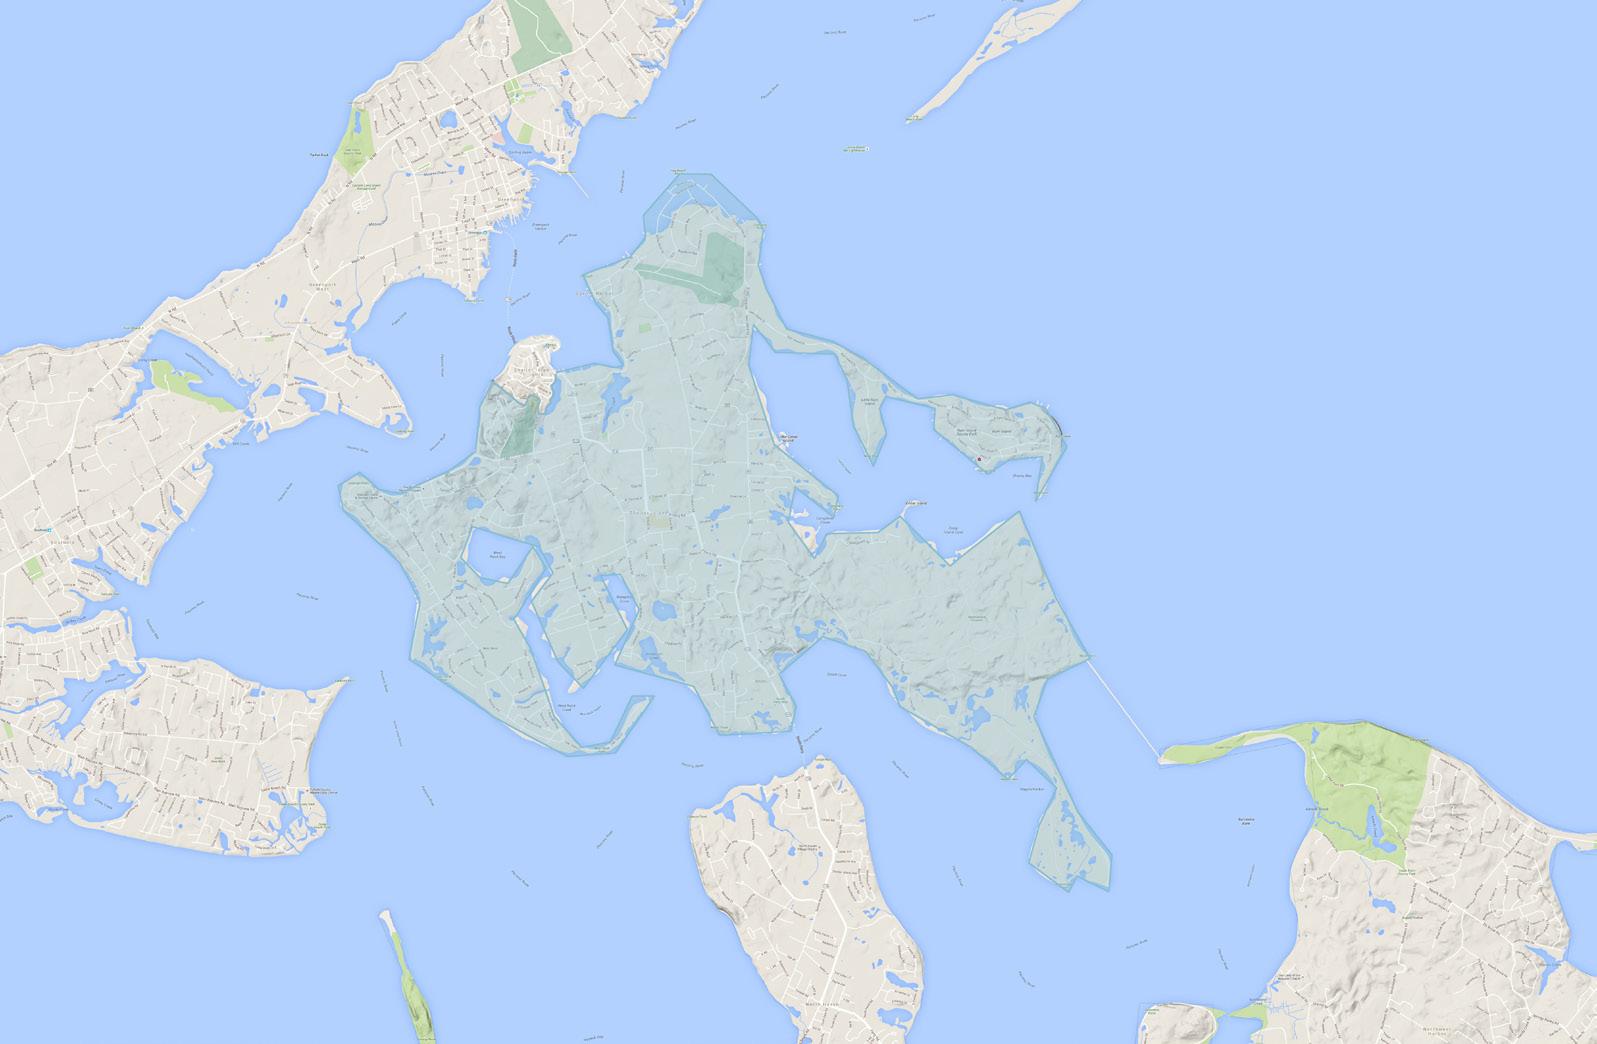
NORTH HAVEN
SHELTER ISLAND
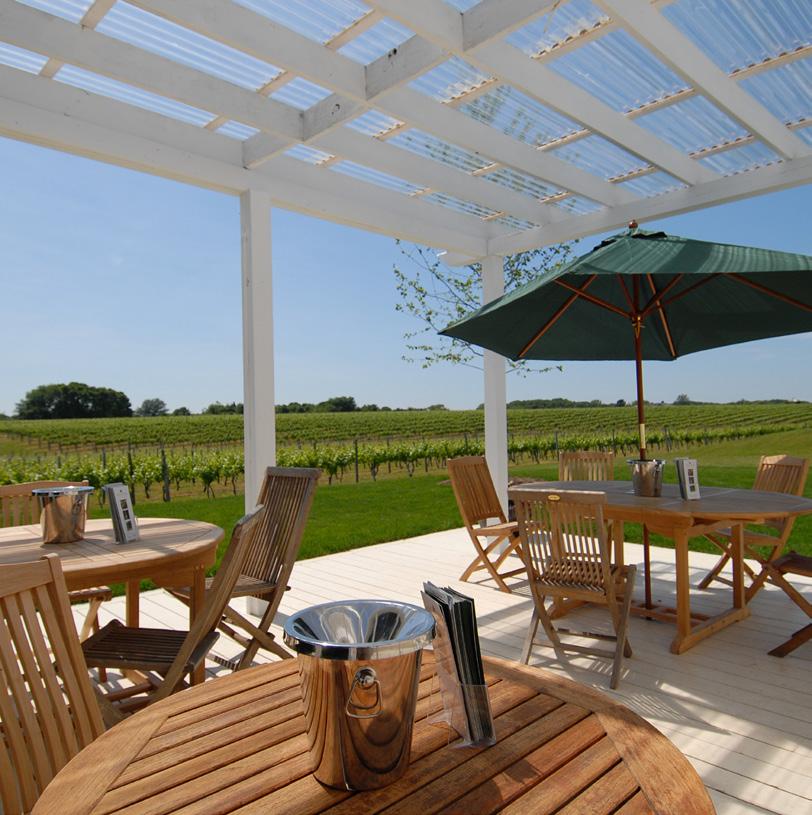
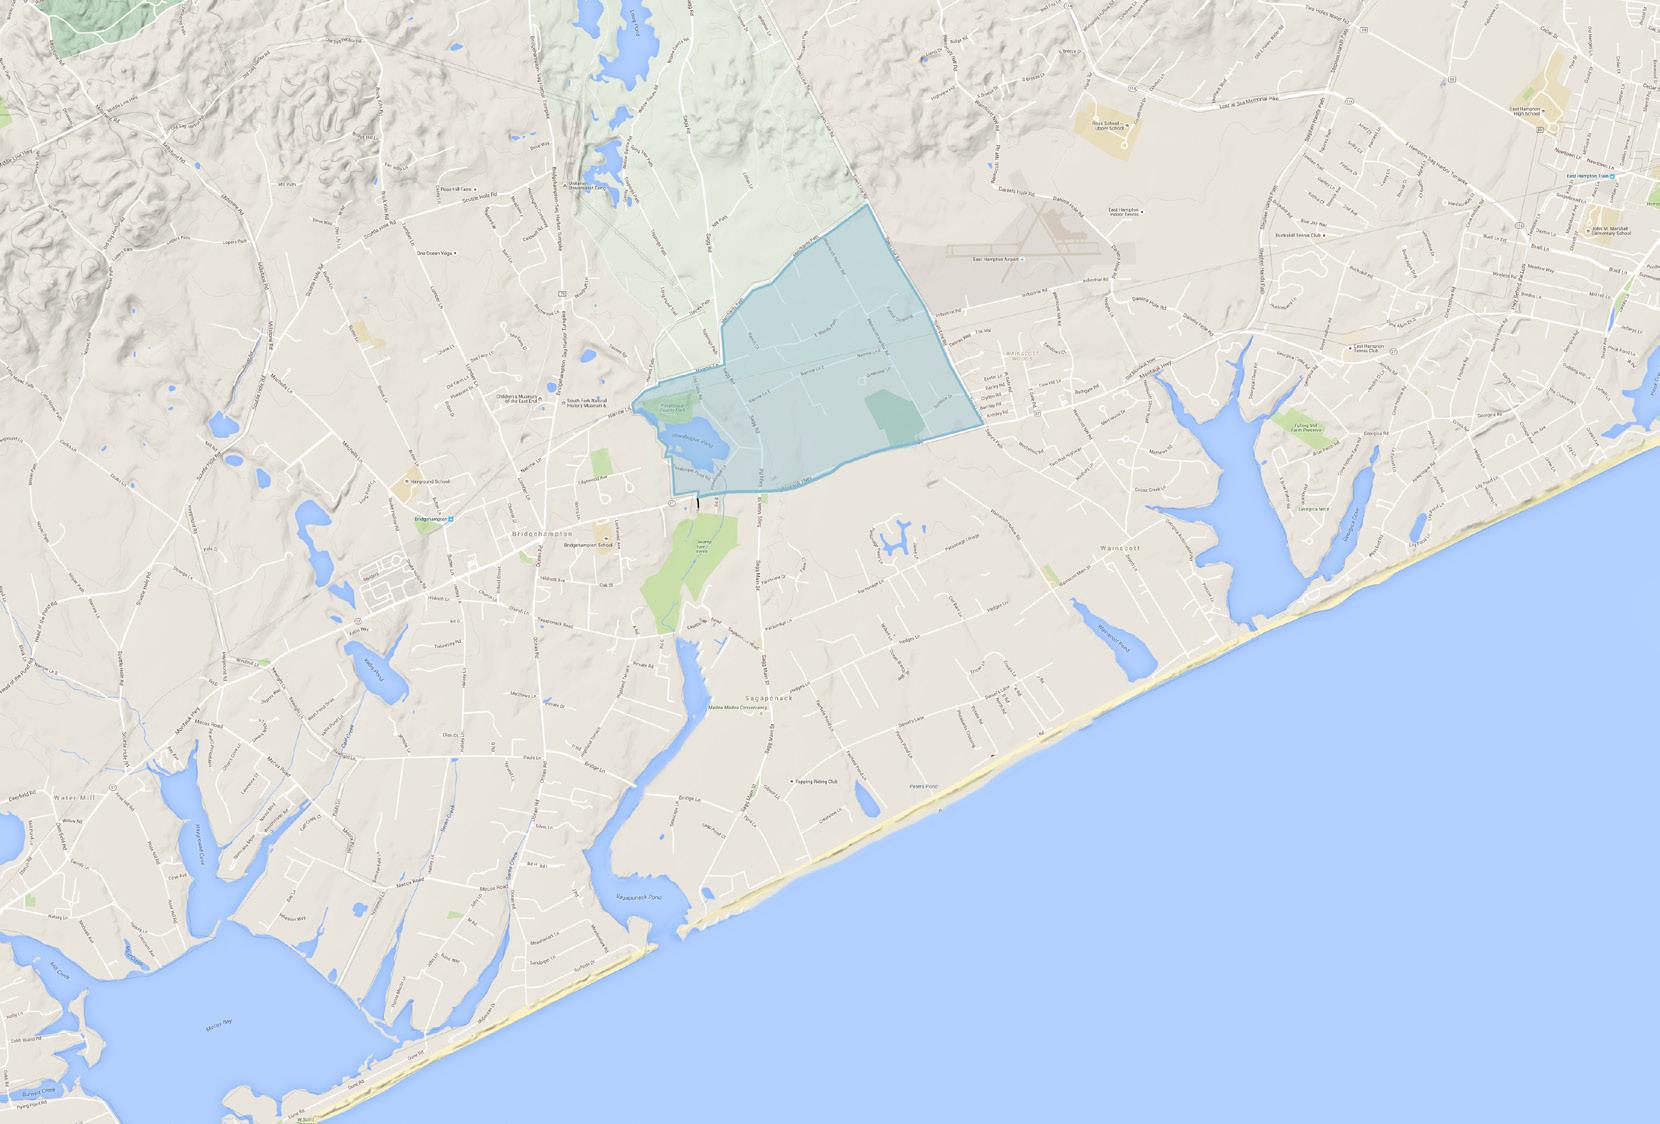
SAGAPONACK
SAGAPONACK VILLAGE
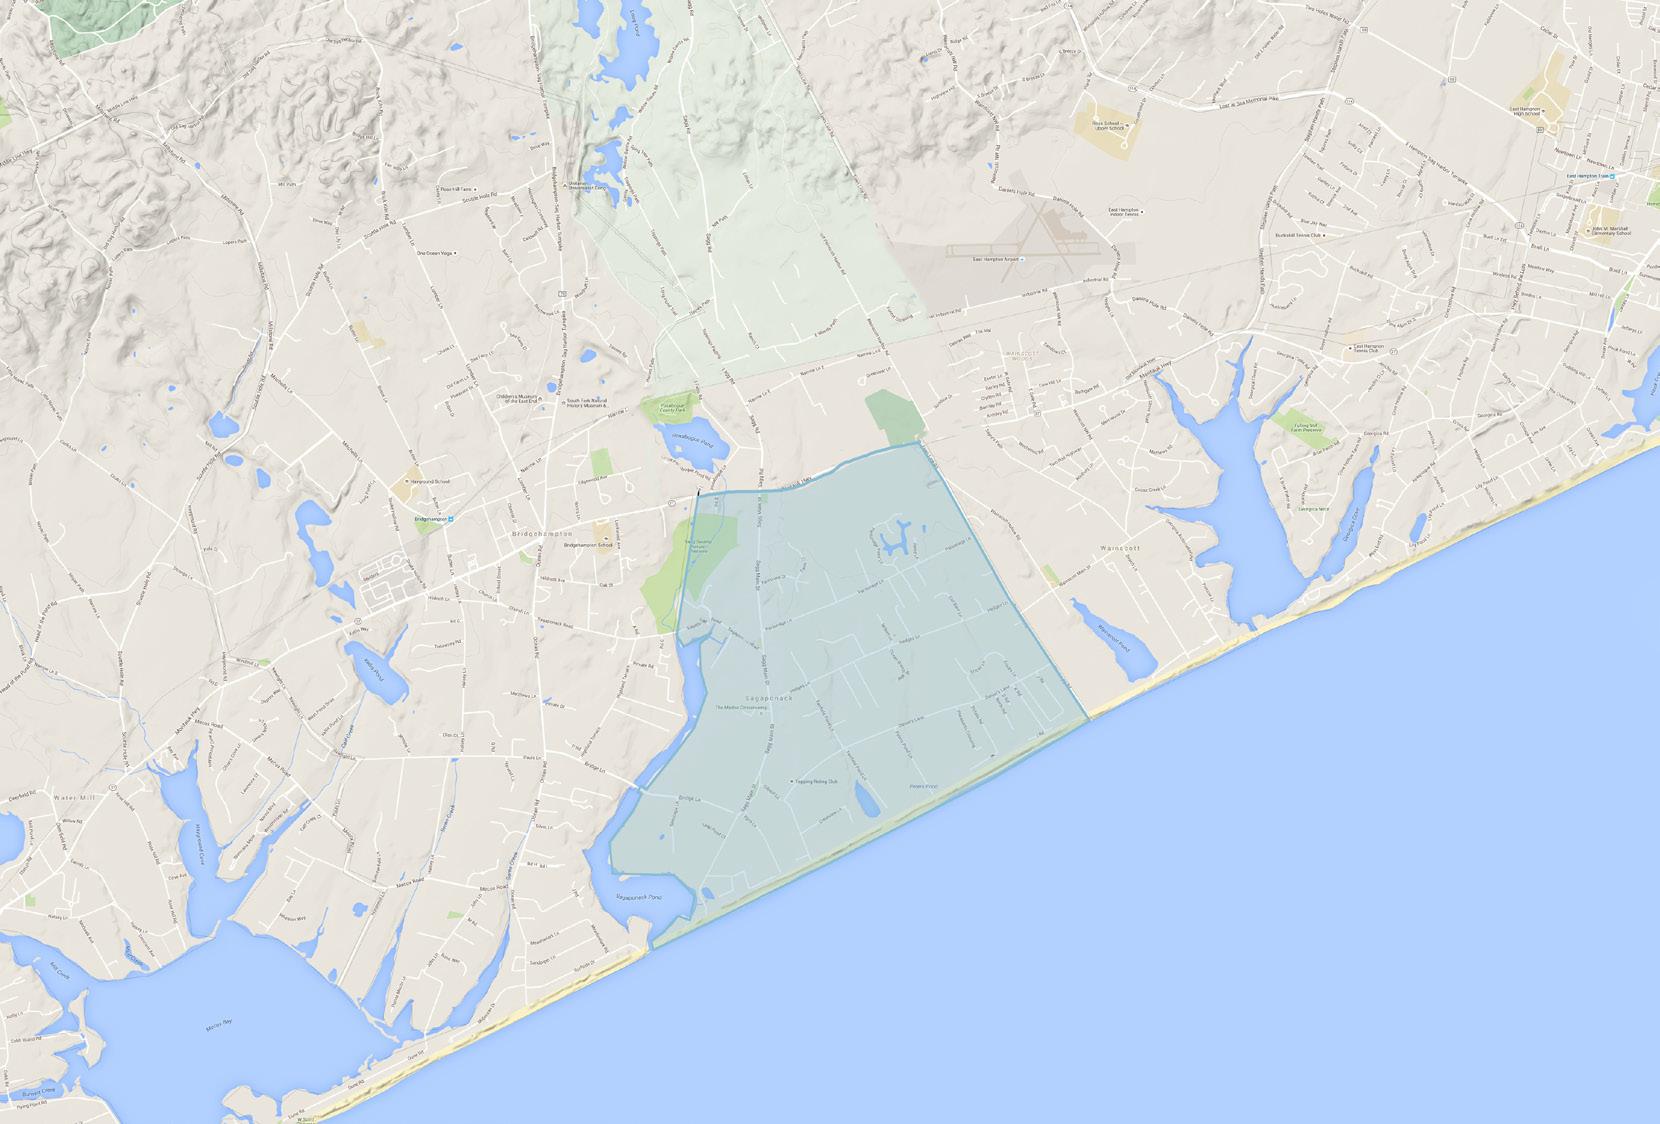
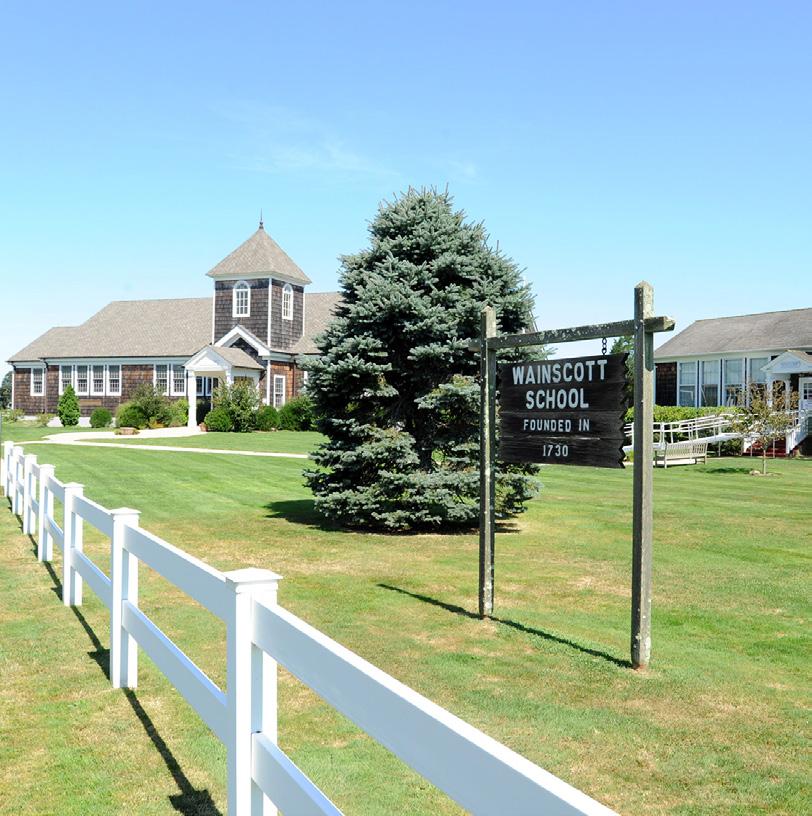
WAINSCOTT
EAST HAMPTON MIDDLE
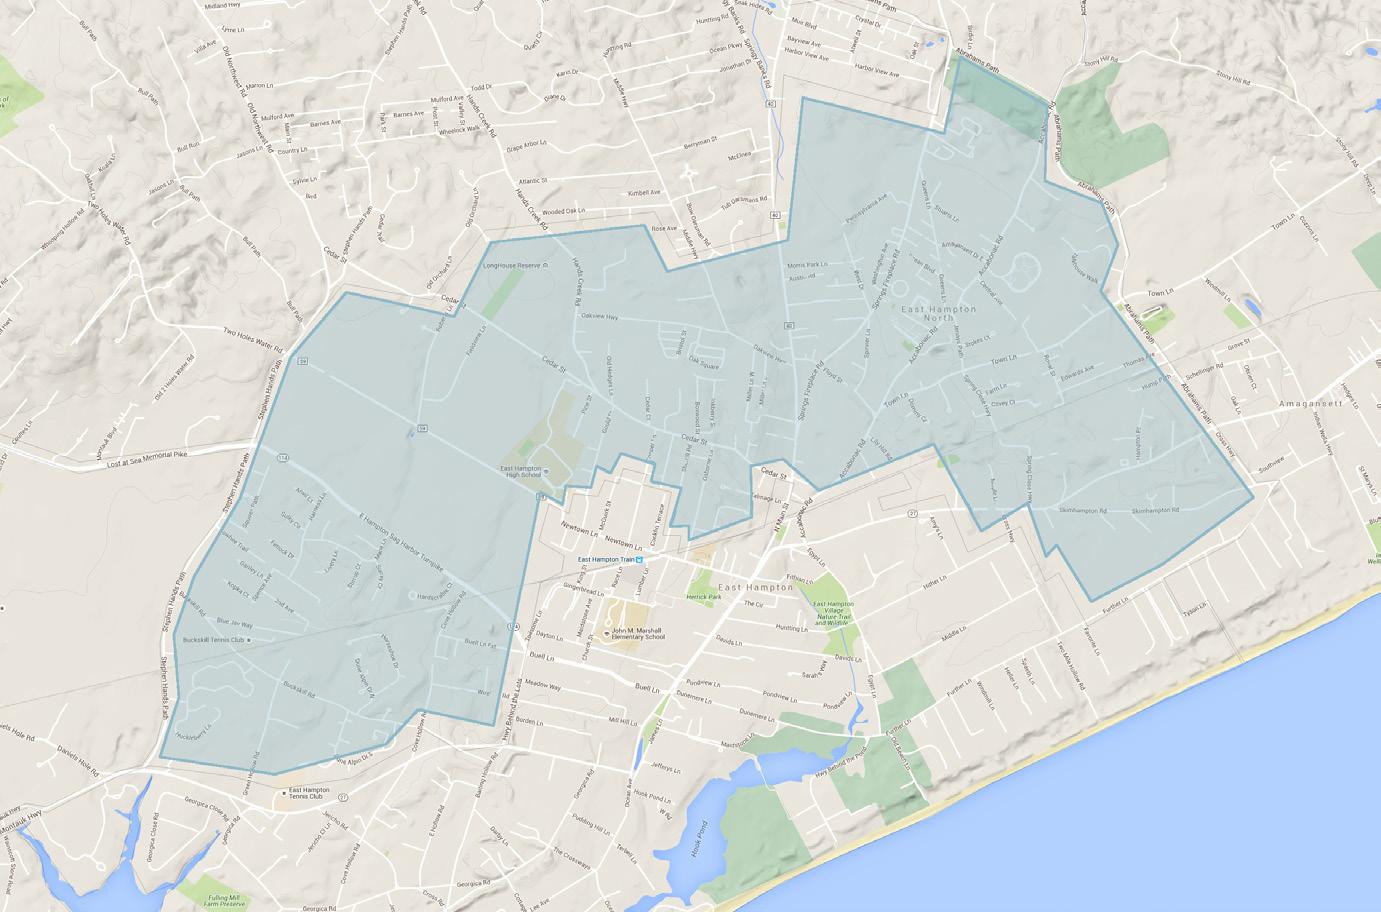
EAST HAMPTON VILLAGE
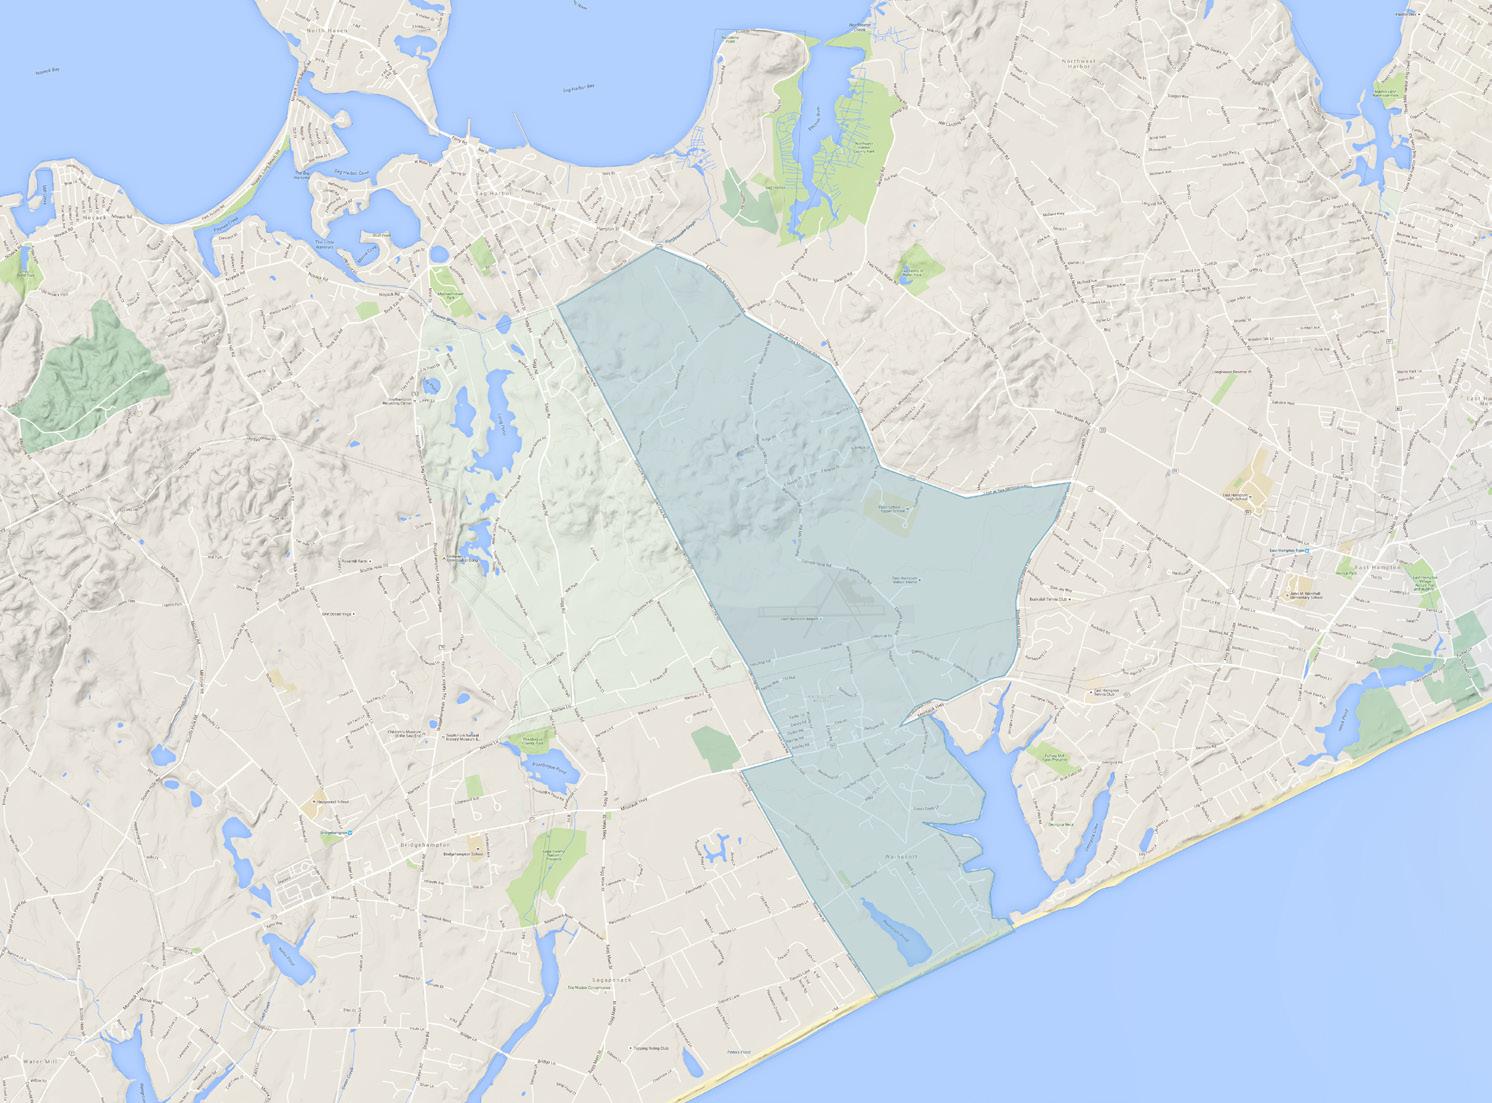
EAST HAMPTON SPRINGS
EAST HAMPTON NORTHWEST
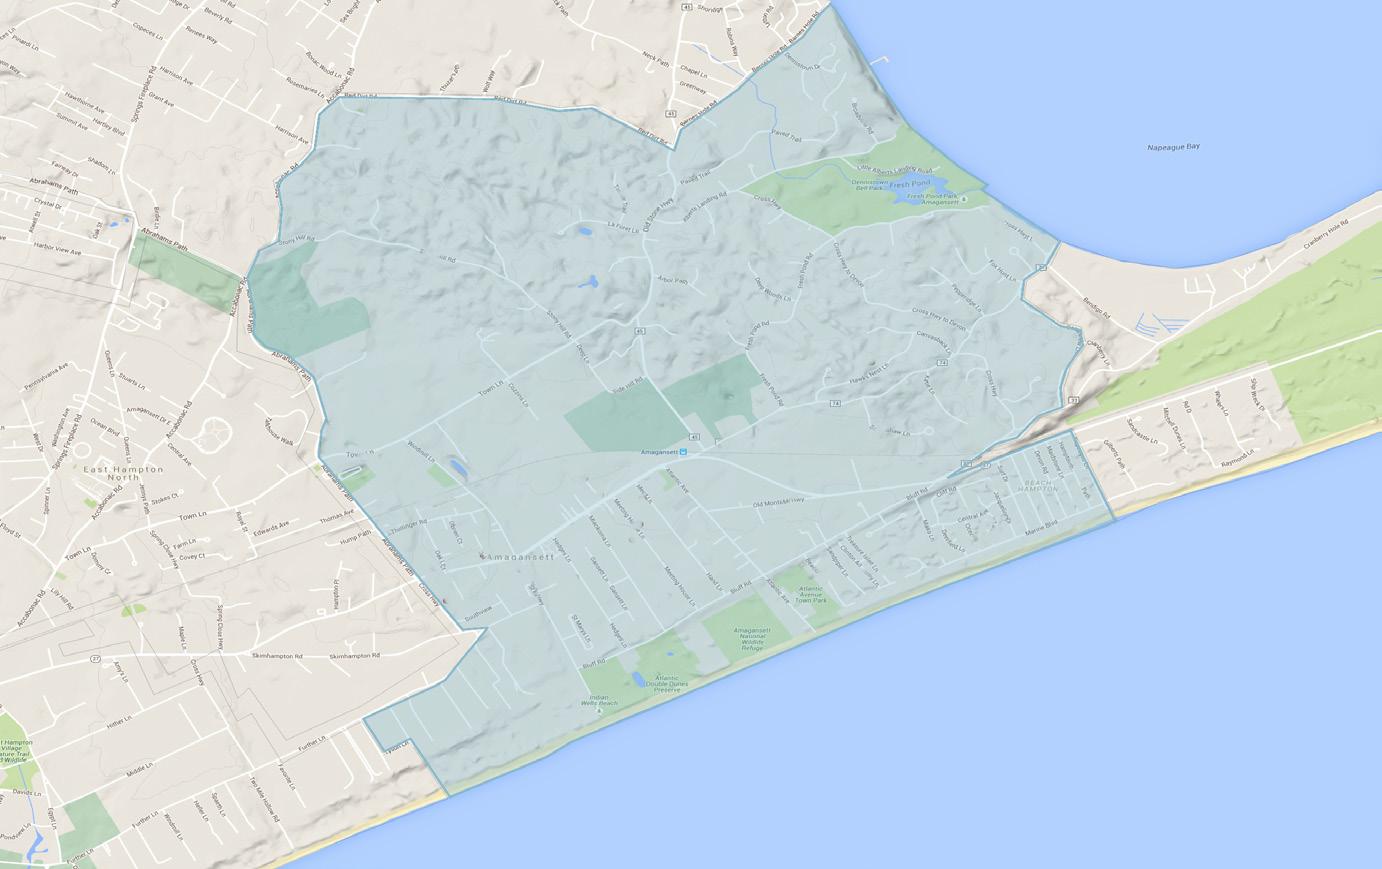
AMAGANSETT
MONTAUK
4 5 6 7 8 9 10 11 12 13 14 15 16 17 18 19 20 21 22 23 24 25 26 27 28 29 30
published august 16th, 2023 FIRST HALF 2023 SaundersMarketReport.com
report
SALES TRANSACTIONS 59% MEDIAN PRICE 2%
all hamptons

TOTAL


4 HAMPTONS REAL ESTATE MARKET REPORT, FIRST HALF 2022 VS. 2023 HOME SALES FIRST HALF 2022 VS. 2023 HOME SALES Q2 2022 VS. 2023 TOP 5 HOME SALES 2ND QTR 2023 LAND SALES SECOND QUARTER 2022 VS. 2023 HOME SALES SECOND QUARTER 2022 VS. 2023 PRICE CATEGORY 2022 SALES 2023 SALES % CHANGE Under $1M 138 60 -57% $1M - $1.99M 176 74 -58% $2M - $2.99M 88 36 -59% $3M - $4.99M 82 41 -50% $5M - $9.99M 56 16 -71% $10M - $19.99M 23 8 -65% OVER $20M 9 1 -89% Sales Transactions 572 236 -59% Median Price $1.77M $1.81M 2% Dollar Volume $1.85B $646.93M -65%
CONDO SALES SECOND QUARTER 2022 VS. 2023 CONDO 2022 2023 % CHANGE Sales Transactions 54 11 -80% Median Price $989K $880K -11% Dollar Volume $94.9M $17.18M -82% LAND 2022 2023 % CHANGE Sales Transactions 91 26 -71% Median Price $810K $671K -17% Dollar Volume $145.16M $32.13M -78% HOME/LAND/CONDO/ COMMERCIAL TOTAL SALES 2022 TOTAL SALES 2023 TOTAL % CHANGE Sales Transactions 740 279 -63% Median Price $1.65M $1.72M 5% Dollar Volume $2.28B $730.96M -68% COMMERCIAL SALES SECOND QUARTER 2022 VS. 2023 COMMERCIAL 2022 2023 % CHANGE Sales Transactions 23 6 -74% Median Price $2.33M $2.58M 11% Dollar Volume $185.53M $34.72M -81% PROPERTY ADDRESS SOLD PRICE 232 Gibson Lane, Sagaponack $20,500,000 103 Great Plains Rd., Southampton $18,700,000 446 First Neck Lane, Southampton $16,950,000 143 Meadowmere Ln., Southampton $16,000,000 376 First Neck Lane, Southampton $12,500,000
DOLLAR VOLUME 65% SALES TRANSACTIONS SECOND QUARTER 2022 VS. 2023
TOTAL SALES TRANSACTIONS FIRST HALF 2022 VS. 2023
HOME SALES Q2 2022 VS. 2023
SALES TRANSACTIONS 56% MEDIAN PRICE 5% LAND 2022 2023 % CHANGE Sales Transactions 154 65 -58% Median Price $830K $950K 15% Dollar Volume $249.73M $115.12M -54% TOP 5 HOME SALES 2023
PROPERTY ADDRESS SOLD PRICE 32 Windmill Lane, East Hampton $77,775,000 51 West End Road, East Hampton $35,000,000 35 Dune Road, Bridgehampton $33,480,000 31Two Mile Hollow Rd, East Hampton $29,000,000 1 Boatmans Lane, Southampton $28,075,000
HOME/LAND/CONDO/ COMMERCIAL TOTAL SALES 2022 TOTAL SALES 2023 TOTAL % CHANGE Sales Transactions 1,518 649 -57% Median Price $1.6M $1.65M 3% Dollar Volume $4.39B $1.87B -57% COMMERCIAL SALES FIRST HALF 2022 VS. 2023 COMMERCIAL 2022 2023 % CHANGE Sales Transactions 52 16 -69% Median Price $1.98M $1.9M -4% Dollar Volume $241.1M $80.44M -67%
5 HAMPTONS REAL ESTATE MARKET REPORT, FIRST HALF 2022 VS. 2023 LAND SALES FIRST HALF 2022 VS. 2023 HOME SALES FIRST HALF 2022 VS. 2023 PRICE CATEGORY 2022 SALES 2023 SALES % CHANGE Under $1M 329 145 -56% $1M - $1.99M 372 163 -56% $2M - $2.99M 189 79 -58% $3M - $4.99M 162 90 -44% $5M - $9.99M 105 39 -63% $10M - $19.99M 44 15 -66% OVER $20M 16 8 -50% Sales Transactions 1,217 539 -56% Median Price $1.7M $1.78M 5% Dollar Volume $3.75B $1.64M -56%
all hamptons
DOLLAR VOLUME 56% CONDO SALES FIRST HALF 2022 VS. 2023 CONDO 2022 2023 % CHANGE Sales Transactions 93 29 -69% Median Price $980K $915K -7% Dollar Volume $145.25M $41.37M -72%
SALES TRANSACTIONS 36%
MEDIAN PRICE 4%
DOLLAR VOLUME 41%

6 HAMPTONS REAL ESTATE MARKET REPORT, FIRST HALF 2022 VS. 2023 HOME SALES FIRST HALF 2022
2023 TOP 5 HOME SALES 2023 LAND SALES FIRST HALF 2022 VS. 2023 Under $1M 7 3 -57% $1M - $1.99M 11 8 -27% $2M - $2.99M 1 3 200% $3M - $4.99M 3 - -100% $5M - $9.99M - -$10M - $19.99M - -OVER $20M - -Sales Transactions 22 14 -36% Median Price $1.59M $1.53M -4% Dollar Volume $37.04M $21.98M -41%
VS.
remsenburg PROPERTY ADDRESS SOLD PRICE 6 Fish Creek Lane $2,500,000 1 Mallard Lane $2,400,000 139 South Country Road $2,200,000 11 Woodcock Lane $1,950,000 8 Woodcock Lane $1,800,000 LAND 2022 2023 % CHANGE Sales Transactions 4 1 -75% Median Price $402K $250K -38% Dollar Volume $1.64M $250K -85%

7 HAMPTONS REAL ESTATE MARKET REPORT, FIRST HALF 2022 VS. 2023 HOME SALES FIRST HALF 2022 VS. 2023 HOME SALES FIRST HALF 2022 VS. 2023 TOP 5 HOME SALES 2023 LAND SALES FIRST HALF 2022 VS. 2023 CONDO SALES FIRST HALF 2022 VS. 2023 MEDIAN PRICE 14% DOLLAR VOLUME
SALES TRANSACTIONS 46% PROPERTY ADDRESS SOLD PRICE 651 Dune Road $3,400,000 11 Fiddler Crab Trail $3,075,000 8 Sweetgrass Road $2,759,768 12 Bay Meadow Lane $2,300,000 1 Shore Lane $1,990,000 westhampton PRICE CATEGORY 2022 SALES 2023 SALES % CHANGE Under $1M 13 8 -39% $1M - $1.99M 14 6 -57% $2M - $2.99M 3 2 -33% $3M - $4.99M 2 2$5M - $9.99M 1 - -100% $10M - $19.99M - -OVER $20M - -Sales Transactions 33 18 -46% Median Price $1.33M $1.14M -14% Dollar Volume $48.66M $26.18M -46% CONDO 2022 2023 % CHANGE Sales Transactions 6 4 -33% Median Price $982K $468K -53% Dollar Volume $6.24M $2.29M -63% LAND 2022 2023 % CHANGE Sales Transactions 3 3Median Price $350K $670K 91% Dollar Volume $1.18M $2.1M 77%
46%
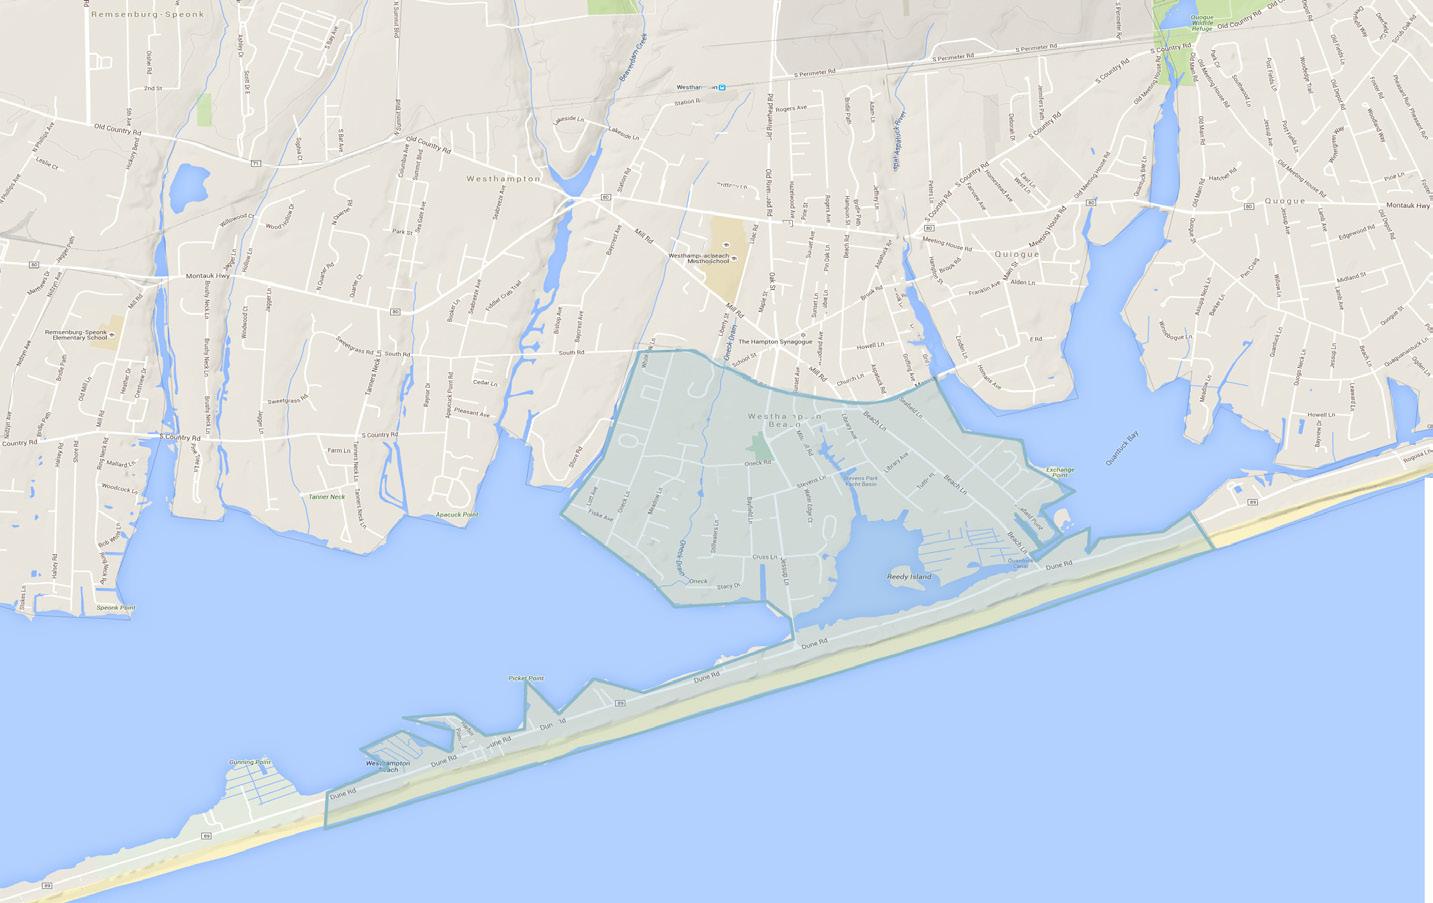
8 HAMPTONS REAL ESTATE MARKET REPORT, FIRST HALF 2022 VS. 2023 HOME SALES FIRST HALF 2022 VS. 2023 HOME SALES FIRST HALF 2022 VS. 2023 LAND SALES FIRST HALF 2022 VS. 2023 CONDO SALES FIRST HALF 2022 VS. 2023 TOP 5 HOME SALES 2023 SALES TRANSACTIONS 52% MEDIAN PRICE 41% DOLLAR VOLUME 44% PROPERTY ADDRESS SOLD PRICE 121 Jessup Lane $8,100,000 127 Jessup Lane $7,200,000 1 Fiske Avenue $5,900,000 7 Cross Lane $5,651,127 62 Beach Lane $3,450,000
CONDO 2022 2023 % CHANGE Sales Transactions 4 2 -50% Median Price $867K $1.72M 99% Dollar Volume $3.73M $3.45M -8% PRICE CATEGORY 2022 SALES 2023 SALES % CHANGE Under $1M 5 2 -60% $1M - $1.99M 2 4 100% $2M - $2.99M 7 - -100% $3M - $4.99M 7 1 -86% $5M - $9.99M 1 4 300% $10M - $19.99M 1 - -100% OVER $20M - -Sales Transactions 23 11 -52% Median Price $2.9M $1.72M -41% Dollar Volume $68.57M $38.11M -44% LAND 2022 2023 % CHANGE Sales Transactions 4 2 -50% Median Price $2.17M $4.46M 106% Dollar Volume $9.65M $8.93M -8%
village of westhampton beach
west hampton dunes

9 HAMPTONS REAL ESTATE MARKET REPORT, FIRST HALF 2022 VS. 2023 HOME SALES FIRST HALF 2022 VS. 2023 HOME SALES FIRST HALF 2022 VS. 2023 LAND SALES FIRST HALF 2022 VS. 2023
TRANSACTIONS 71%
PRICE 12%
VOLUME
SALES
MEDIAN
DOLLAR
PRICE CATEGORY 2022 SALES 2023 SALES % CHANGE Under $1M 1 - -100% $1M - $1.99M 1 1$2M - $2.99M 2 - -100% $3M - $4.99M 2 1 -50% $5M - $9.99M 1 - -100% $10M - $19.99M - -OVER $20M - -Sales Transactions 7 2 -71% Median Price $2.4M $2.69M 12% Dollar Volume $21.5M $5.38M -75% 75% TOP HOME SALES 2023 PROPERTY ADDRESS SOLD PRICE 854 Dune Road $3,995,000 774A Dune Road $1,380,000 LAND 2022 2023 % CHANGE Sales Transactions 2 - -100% Median Price $2.02M - -100% Dollar Volume $4.04M - -100%
69%
SALES TRANSACTIONS
MEDIAN PRICE 83% DOLLAR VOLUME 60%
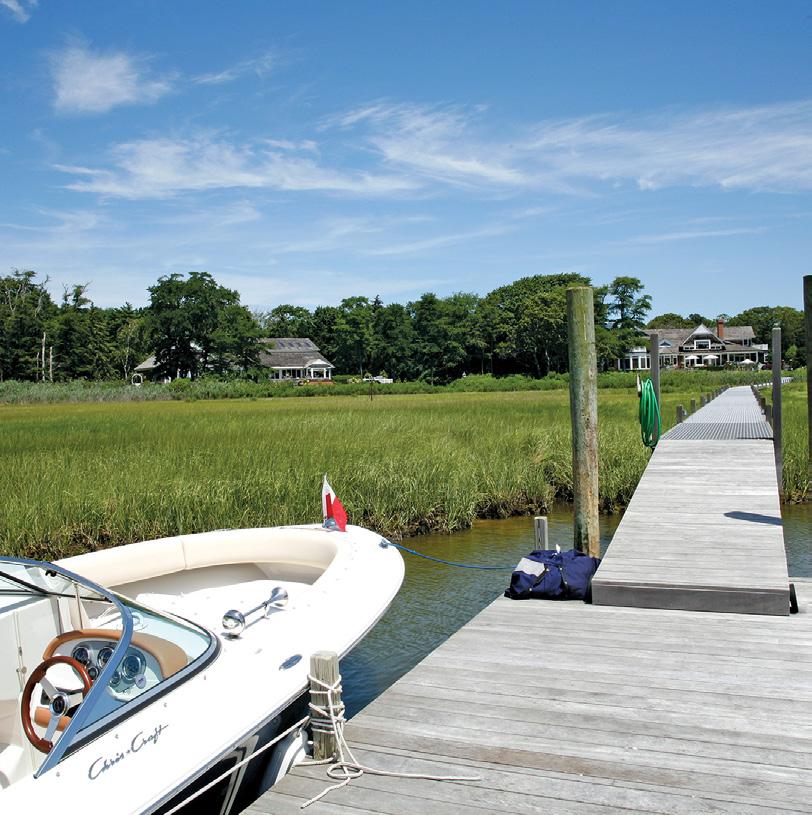
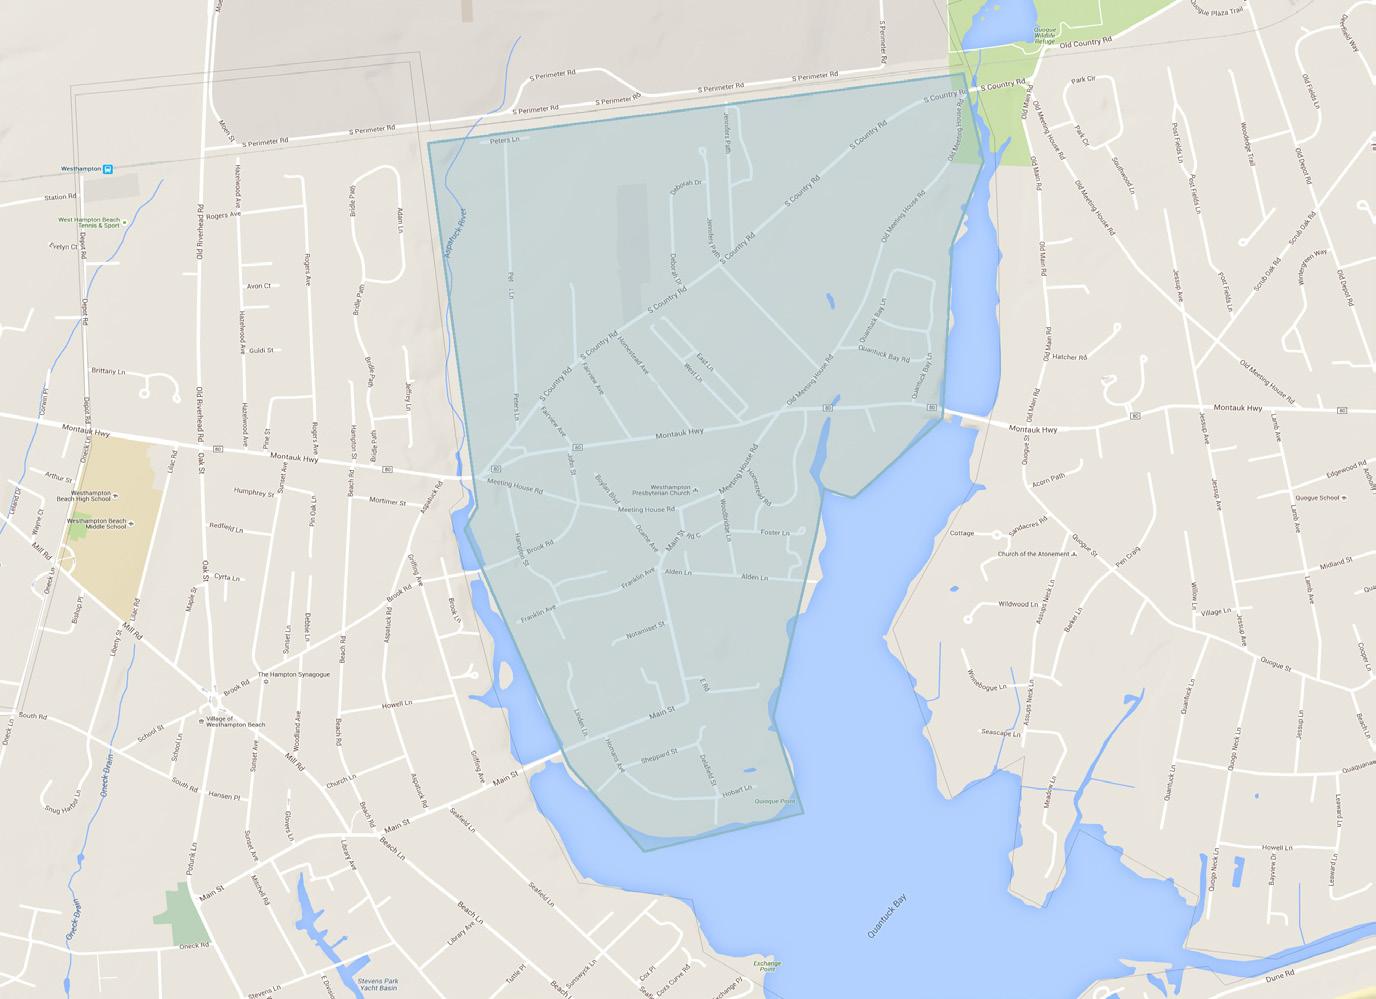
10 HAMPTONS REAL ESTATE MARKET REPORT, FIRST HALF 2022 VS. 2023 HOME SALES FIRST HALF 2022 VS. 2023 LAND SALES FIRST HALF 2022 VS. 2023 TOP HOME SALES 2023 quiogue PRICE CATEGORY 2022 SALES 2023 SALES % CHANGE Under $1M 4 - -100% $1M - $1.99M 3 1 -67% $2M - $2.99M 2 1 -50% $3M - $4.99M 2 1 -50% $5M - $9.99M 2 1 -50% $10M - $19.99M - -OVER $20M - -Sales Transactions 13 4 -69% Median Price $1.8M $3.3M 83% Dollar Volume $34.69M $13.88M -60%
LAND 2022 2023 % CHANGE Sales Transactions 2 - -100% Median Price $525K - -100% Dollar Volume $1.05M - -100% PROPERTY ADDRESS SOLD PRICE 4 Post Lane $4,100,000 115 Dune Road $3,950,000 3 Piperwoods Lane $3,500,000 1 Waters Edge Drive $3,500,000 28 Post Fields Lane $2,900,000
47% SALES TRANSACTIONS
68%
2% MEDIAN PRICE DOLLAR VOLUME
11 HAMPTONS REAL ESTATE MARKET REPORT, FIRST HALF 2022 VS. 2023 HOME SALES FIRST HALF 2022 VS. 2023 TOP 5 HOME SALES 2023 LAND SALES FIRST HALF 2022 VS. 2023 CONDO SALES FIRST HALF 2022 VS. 2023
quogue village
PRICE CATEGORY 2022 SALES 2023 SALES % CHANGE Under $1M - -$1M - $1.99M 8 1 -88% $2M - $2.99M 1 4 300% $3M - $4.99M 2 4 100% $5M - $9.99M 4 - -100% $10M - $19.99M 2 - -100% OVER $20M - -Sales Transactions 17 9 -47% Median Price $2.95M $2.9M -2% Dollar Volume $80.68M $25.92M -68% LAND 2022 2023 % CHANGE Sales Transactions 7 1 -86% Median Price $1.8M $1.65M -8% Dollar Volume $16.38M $1.65M -90% CONDO 2022 2023 % CHANGE Sales Transactions 1 - -100% Median Price $1.5M - -100% Dollar Volume $1.5M - -100% PROPERTY ADDRESS SOLD PRICE 4 Post Lane $4,100,000 115 Dune Road $3,950,000 3 Piperwoods Lane $3,500,000 1 Waters Edge Drive $3,500,000 28 Post Fields Lane $2,900,000
12 HAMPTONS REAL ESTATE MARKET REPORT, FIRST HALF 2022 VS. 2023 HOME SALES FIRST HALF 2022 VS. 2023 HOME SALES FIRST HALF 2022 VS. 2023 TOP 5 HOME SALES 2023 LAND SALES FIRST HALF 2022 VS. 2023 CONDO SALES FIRST HALF 2022 VS. 2023
PROPERTY ADDRESS SOLD PRICE 4 Squires Avenue $12,350,000 47 Shinnecock Road $3,375,000 5 Corbett Drive $2,200,000 2 Rosebud Lane $1,915,000 7 Blueberry Court $1,820,000 52% SALES TRANSACTIONS 7% MEDIAN PRICE 39% DOLLAR VOLUME PRICE CATEGORY 2022 SALES 2023 SALES % CHANGE Under $1M 32 15 -53% $1M - $1.99M 24 12 -50% $2M - $2.99M 5 1 -80% $3M - $4.99M 1 1$5M - $9.99M - -$10M - $19.99M - 1 N/A OVER $20M - -Sales Transactions 62 30 -52% Median Price $980K $1.04M 7% Dollar Volume $73.84M $45.23M -39% CONDO 2022 2023 % CHANGE Sales Transactions 3 - -100% Median Price $425K - -100% Dollar Volume $1.38M - -100% LAND 2022 2023 % CHANGE Sales Transactions 7 1 -86% Median Price $475K $349K -27% Dollar Volume $2.95M $349K -88%
east quogue


13 HAMPTONS REAL ESTATE MARKET REPORT, FIRST HALF 2022 VS. 2023 HOME SALES FIRST HALF 2022 VS. 2023 TOP 5 HOME SALES 2023 LAND SALES FIRST HALF 2022 VS. 2023 CONDO SALES FIRST HALF 2022 VS. 2023 PROPERTY ADDRESS SOLD PRICE 20 Peconic Crescent $4,565,000 10 Bay View Drive $2,500,000 8B Old North Highway $1,975,000 3 Schooner Lane $1,875,000 296 East Montauk Highway $1,817,250 53% SALES TRANSACTIONS PRICE CATEGORY 2022 SALES 2023 SALES % CHANGE Under $1M 119 56 -53% $1M - $1.99M 30 14 -53% $2M - $2.99M 3 1 -67% $3M - $4.99M - 1 N/A $5M - $9.99M - -$10M - $19.99M - -OVER $20M - -Sales Transactions 152 72 -53% Median Price $762K $766K 1% Dollar Volume $129.19M $66.63M -48% CONDO 2022 2023 % CHANGE Sales Transactions 4 3 -25% Median Price $532K $750K 41% Dollar Volume $2.12M $2.34M 10% LAND 2022 2023 % CHANGE Sales Transactions 7 - -100% Median Price $355K - -100% Dollar Volume $3.2M - -100% 1%
MEDIAN PRICE 48% DOLLAR VOLUME
14 HAMPTONS REAL ESTATE MARKET REPORT, FIRST HALF 2022 VS. 2023 HOME SALES FIRST HALF 2022 VS. 2023 HOME SALES FIRST HALF 2022 VS. 2023 TOP 5 HOME SALES 2023 LAND SALES FIRST HALF 2022 VS. 2023 CONDO SALES FIRST HALF 2022 VS. 2023 southampton PROPERTY ADDRESS SOLD PRICE 425 North Main Street $9,711,392 8 Studio Lane $7,480,000 112 Wooleys Drive $6,499,000 39 Lenape Road $5,000,000 249 North Magee Street $4,626,500 51% 53% SALES TRANSACTIONS DOLLAR VOLUME PRICE CATEGORY 2022 SALES 2023 SALES % CHANGE Under $1M 34 16 -53% $1M - $1.99M 45 19 -58% $2M - $2.99M 24 9 -63% $3M - $4.99M 15 11 -27% $5M - $9.99M 5 4 -20% $10M - $19.99M 2 - -100% OVER $20M - -Sales Transactions 125 59 -53% Median Price $1.62M $1.79M 11% Dollar Volume $274.49M $134.91M -51% CONDO 2022 2023 % CHANGE Sales Transactions 21 2 -91% Median Price $908K $955K 5% Dollar Volume $19.06M $1.91M -90% 11% MEDIAN PRICE LAND 2022 2023 % CHANGE Sales Transactions 18 10 -44% Median Price $475K $225K -53% Dollar Volume $10.18M $4.65M -54%
15 HAMPTONS REAL ESTATE MARKET REPORT, FIRST HALF 2022 VS. 2023 HOME SALES FIRST HALF 2022 VS. 2023 HOME SALES FIRST HALF 2022 VS. 2023 TOP 5 HOME SALES 2023 LAND SALES FIRST HALF 2022 VS. 2023 CONDO SALES FIRST HALF 2022 VS. 2023 southampton village PROPERTY ADDRESS SOLD PRICE 1 Boatmans Lane $28,075,000 103 Great Plains Road $18,700,000 446 First Neck Lane $16,950,000 143 Meadowmere Lane $16,000,000 793 Wickapogue Road $13,050,000 59% 57% SALES TRANSACTIONS 17% MEDIAN PRICE DOLLAR VOLUME PRICE CATEGORY 2022 SALES 2023 SALES % CHANGE Under $1M 6 3 -50% $1M - $1.99M 12 4 -67% $2M - $2.99M 11 6 -46% $3M - $4.99M 16 7 -56% $5M - $9.99M 14 5 -64% $10M - $19.99M 11 6 -46% OVER $20M 4 1 -75% Sales Transactions 74 32 -57% Median Price $3.52M $4.12M 17% Dollar Volume $499.58M $207.45M -59% LAND 2022 2023 % CHANGE Sales Transactions 2 1 -50% Median Price $4.8M $1.5M -69% Dollar Volume $9.6M $1.5M -84% CONDO 2022 2023 % CHANGE Sales Transactions 23 2 -91% Median Price $3.21M $1.83M -43% Dollar Volume $66.22M $3.66M -95%


16 HAMPTONS REAL ESTATE MARKET REPORT, FIRST HALF 2022 VS. 2023 HOME SALES FIRST HALF 2022 VS. 2023 TOP 5 HOME SALES 2023 LAND SALES FIRST HALF 2022 VS. 2023 CONDO SALES FIRST HALF 2022 VS. 2023 PROPERTY ADDRESS SOLD PRICE 180 Rose Hill Road $20,000,000 535 Flying Point Road $17,000,000 31 Morrison Lane $15,250,000 5 Burnetts Cove Road $11,500,000 91 Osprey Way $9,400,000 36% 51% SALES TRANSACTIONS 39% MEDIAN PRICE DOLLAR VOLUME PRICE CATEGORY 2022 SALES 2023 SALES % CHANGE Under $1M 3 - -100% $1M - $1.99M 10 3 -70% $2M - $2.99M 7 5 -29% $3M - $4.99M 11 5 -55% $5M - $9.99M 10 6 -40% $10M - $19.99M 5 3 -40% OVER $20M 1 1Sales Transactions 47 23 -51% Median Price $3.25M $4.5M 39% Dollar Volume $228.62M $147.37M -36% LAND 2022 2023 % CHANGE Sales Transactions 14 2 -86% Median Price $2.04M $4.05M 99% Dollar Volume $39.17M $8.1M -79% CONDO 2022 2023 % CHANGE Sales Transactions 1 - -100% Median Price $2.6M - -100% Dollar Volume $2.6M - -100%
62% SALES TRANSACTIONS
64%
21% MEDIAN PRICE DOLLAR VOLUME
17 HAMPTONS REAL ESTATE MARKET REPORT, FIRST HALF 2022 VS. 2023 HOME SALES FIRST HALF 2022 VS. 2023 TOP 5 HOME SALES 2023 LAND SALES FIRST HALF 2022 VS. 2023 CONDO SALES FIRST HALF 2022 VS. 2023 CONDO 2022 2023 % CHANGE Sales Transactions 2 - -100% Median Price $1.05M - -100% Dollar Volume $2.1M - -100% bridgehampton PROPERTY ADDRESS SOLD PRICE 35 Dune Road $33,480,000 182 Jobs Lane $8,600,000 93 Silver Lane $7,105,000 9 Kellis Way $5,600,000 11 Osprey Way $4,950,000
PRICE CATEGORY 2022 SALES 2023 SALES % CHANGE Under $1M 4 1 -75% $1M - $1.99M 6 4 -33% $2M - $2.99M 9 6 -33% $3M - $4.99M 11 4 -64% $5M - $9.99M 12 3 -75% $10M - $19.99M 8 - -100% OVER $20M - 1 N/A Sales Transactions 50 19 -62% Median Price $3.68M $2.9M -21% Dollar Volume $258.94M $93.54M -64% LAND 2022 2023 % CHANGE Sales Transactions 5 7 40% Median Price $1.89M $2.7M 43% Dollar Volume $8.49M $23.75M 180%
18 HAMPTONS REAL ESTATE MARKET REPORT, FIRST HALF 2022 VS. 2023 HOME SALES FIRST HALF 2022 VS. 2023 TOP 5 HOME SALES 2023 LAND SALES FIRST HALF 2022 VS. 2023 PROPERTY ADDRESS SOLD PRICE 24 Crescent Street $5,995,000 23 Fourteen Hills Court $5,955,000 26 Cedar Point Lane $4,995,000 15 Sag Harbor Court $4,850,000 540 Ruggs Path $4,795,000 34% 47% SALES TRANSACTIONS 13% MEDIAN PRICE DOLLAR VOLUME PRICE CATEGORY 2022 SALES 2023 SALES % CHANGE Under $1M 21 12 -43% $1M - $1.99M 35 12 -66% $2M - $2.99M 8 4 -50% $3M - $4.99M 4 9 125% $5M - $9.99M 5 2 -60% $10M - $19.99M - -OVER $20M - -Sales Transactions 73 39 -47% Median Price $1.4M $1.58M 13% Dollar Volume $133.22M $87.77M -34% LAND 2022 2023 % CHANGE Sales Transactions 4 4Median Price $769K $868K 13% Dollar Volume $3.85M $7.24M 88%

19 HAMPTONS REAL ESTATE MARKET REPORT, FIRST HALF 2022 VS. 2023 HOME SALES FIRST HALF 2022 VS. 2023 TOP 5 HOME SALES 2023 LAND SALES FIRST HALF 2022 VS. 2023 CONDO SALES FIRST HALF 2022 VS. 2023 PROPERTY ADDRESS SOLD PRICE 52 Glover Street $5,900,000 286 Division Street $5,500,000 40 Lincoln Street $4,000,000 127 Bay Street $3,800,000 15 Bluff Point Lane $3,495,000 68% 20% MEDIAN PRICE DOLLAR VOLUME PRICE CATEGORY 2022 SALES 2023 SALES % CHANGE Under $1M 5 - -100% $1M - $1.99M 24 8 -67% $2M - $2.99M 10 3 -70% $3M - $4.99M 13 7 -46% $5M - $9.99M 2 2$10M - $19.99M 3 - -100% OVER $20M - -Sales Transactions 57 20 -65% Median Price $2M $2.4M 20% Dollar Volume $168.71M $53.58M -68% 65% SALES TRANSACTIONS CONDO 2022 2023 % CHANGE Sales Transactions 8 4 -50% Median Price $3.01M $2.03M -33% Dollar Volume $23.81M $12.19M -49% LAND 2022 2023 % CHANGE Sales Transactions 2 1 -50% Median Price $4.25M $525K -88% Dollar Volume $8.5M $525K -94%
SALES TRANSACTIONS
24% MEDIAN PRICE DOLLAR VOLUME
87%
20 HAMPTONS REAL ESTATE MARKET REPORT, FIRST HALF 2022 VS. 2023
SALES FIRST HALF
LAND
FIRST HALF
TOP 5 HOME SALES 2023
HOME
2022 VS. 2023
SALES
2022 VS. 2023
PRICE CATEGORY 2022 SALES 2023 SALES % CHANGE Under $1M 2 - -100% $1M - $1.99M 7 1 -86% $2M - $2.99M 2 2$3M - $4.99M 4 3 -25% $5M - $9.99M 6 - -100% $10M - $19.99M 2 - -100% OVER $20M 1 - -100% Sales Transactions 24 6 -75% Median Price $3.97M $3.02M -24% Dollar Volume $135.54M $17.2M -87% LAND 2022 2023 % CHANGE Sales Transactions 2 - -100% Median Price $1.98M - -100% Dollar Volume $3.95M - -100% 75% PROPERTY ADDRESS SOLD PRICE 28 Payne Avenue $3,650,000 18 South Harbor Drive $3,650,000 8 Fresh Pond Road $3,100,000 36 Woodland Drive $2,950,000 27 Cedar Avenue $2,600,000

21 HAMPTONS REAL ESTATE MARKET REPORT, FIRST HALF 2022 VS. 2023 HOME SALES FIRST HALF 2022 VS. 2023 LAND SALES FIRST HALF 2022 VS. 2023 TOP 5 HOME SALES 2023 30% SALES TRANSACTIONS 21% MEDIAN PRICE DOLLAR VOLUME LAND 2022 2023 % CHANGE Sales Transactions 13 3 -77% Median Price $510K $600K 18% Dollar Volume $7.48M $2.34M -69% 48% PROPERTY ADDRESS SOLD PRICE 29 Winthrop Road $8,725,000 10B Club Drive $4,600,000 58 Westmoreland Drive $3,225,000 30 Winthrop Road $2,750,000 58 Country Club Drive $2,175,000 PRICE CATEGORY 2022 SALES 2023 SALES % CHANGE Under $1M 8 4 -50% $1M - $1.99M 12 4 -67% $2M - $2.99M 2 2$3M - $4.99M 3 2 -33% $5M - $9.99M - 1 N/A $10M - $19.99M - -OVER $20M - -Sales Transactions 25 13 -48% Median Price $1.6M $1.93M 21% Dollar Volume $44.58M $31.44M -30%
SALES TRANSACTIONS 91% 71%
MEDIAN PRICE
97%
DOLLAR VOLUME
22 HAMPTONS REAL ESTATE MARKET REPORT, FIRST HALF 2022 VS. 2023 HOME SALES FIRST HALF 2022 VS. 2023 LAND SALES FIRST HALF 2022 VS. 2023
PRICE CATEGORY 2022 SALES 2023 SALES % CHANGE Under $1M 1 2 100% $1M - $1.99M 1 - -100% $2M - $2.99M - -$3M - $4.99M 3 - -100% $5M - $9.99M 2 - -100% $10M - $19.99M - -OVER $20M - -Sales Transactions 7 2 -71% Median Price $3.98M $364K -91% Dollar Volume $25.85M $728K -97%
TOP HOME SALES 2023 PROPERTY ADDRESS SOLD PRICE 187 Merchants Path $428,000 560 Toppings Path $300,000 LAND 2022 2023 % CHANGE Sales Transactions 3 1 -67% Median Price $1.52M $1.5M -2% Dollar Volume $6.62M $1.5M -77%
67% SALES TRANSACTIONS

75%
7% MEDIAN PRICE DOLLAR VOLUME
23 HAMPTONS REAL ESTATE MARKET REPORT, FIRST HALF 2022 VS. 2023
HOME SALES FIRST HALF 2022 VS. 2023
TOP HOME
LAND SALES FIRST HALF 2022 VS. 2023
SALES 2023
PRICE CATEGORY 2022 SALES 2023 SALES % CHANGE Under $1M - -$1M - $1.99M - -$2M - $2.99M 1 - -100% $3M - $4.99M 1 1$5M - $9.99M 4 1 -75% $10M - $19.99M 1 - -100% OVER $20M 2 1 -50% Sales Transactions 9 3 -67% Median Price $8.75M $9.35M 7% Dollar Volume $135.15M $33.55M -75% LAND 2022 2023 % CHANGE Sales Transactions 2 2Median Price $9.62M $1.68M -83% Dollar Volume 19.25M $3.37M -83% PROPERTY ADDRESS SOLD PRICE 232 Gibson Lane $20,500,000 113 Parsonage Lane $9,350,000 198 Wainscott Harbor $3,700,000
92% 29% MEDIAN PRICE DOLLAR VOLUME
24 HAMPTONS REAL ESTATE MARKET REPORT, FIRST HALF 2022 VS. 2023 HOME SALES FIRST HALF 2022 VS. 2023 HOME SALES FIRST HALF 2022 VS. 2023 LAND SALES FIRST HALF 2022 VS. 2023 TOP HOME SALES 2023
PRICE CATEGORY 2022 SALES 2023 SALES % CHANGE Under $1M - 1 N/A $1M - $1.99M 5 - -100% $2M - $2.99M 6 2 -67% $3M - $4.99M 7 - -100% $5M - $9.99M 2 - -100% $10M - $19.99M - -OVER $20M - -Sales Transactions 20 3 -85% Median Price $2.87M $2.02M -29% Dollar Volume $60.75M $4.72M -92% LAND 2022 2023 % CHANGE Sales Transactions 2 2Median Price $1.16M $6.5M 462% Dollar Volume $2.32M $13M 462% 85% SALES TRANSACTIONS PROPERTY ADDRESS SOLD PRICE 24 Roxbury Lane $2,200,000 5 Knoll Lane $2,025,000 12 Hedges Lane $500,000
east hampton middle
25 HAMPTONS REAL ESTATE MARKET REPORT, FIRST HALF 2022 VS. 2023 HOME SALES FIRST HALF 2022 VS. 2023 HOME SALES FIRST HALF 2022 VS. 2023 TOP 5 HOME SALES 2023 LAND SALES FIRST HALF 2022 VS. 2023 CONDO SALES FIRST HALF 2022 VS. 2023
PROPERTY ADDRESS SOLD PRICE 12 Eileens Path $11,500,000 76 Gould Street $6,050,000 69 Buell Lane Extension $5,100,000 81 Skimhampton Road $5,000,000 23 Spring Close Highway $4,625,000 47% 49% SALES TRANSACTIONS MEDIAN PRICE DOLLAR VOLUME PRICE CATEGORY 2022 SALES 2023 SALES % CHANGE Under $1M 28 8 -71% $1M - $1.99M 38 22 -42% $2M - $2.99M 23 5 -78% $3M - $4.99M 7 14 100% $5M - $9.99M 4 3 -25% $10M - $19.99M 2 1 -50% OVER $20M 1 - -100% Sales Transactions 103 53 -49% Median Price $1.5M $1.68M 12% Dollar Volume $244.17M $129.62M -47% CONDO 2022 2023 % CHANGE Sales Transactions 4 4Median Price $1.06M $1.1M 3% Dollar Volume $4.42M $5.42M 23% LAND 2022 2023 % CHANGE Sales Transactions 11 5 -55% Median Price $860K $605K -30% Dollar Volume $16.31M $4.39M -73% 12%
26 HAMPTONS REAL ESTATE MARKET REPORT, FIRST HALF 2022 VS. 2023 HOME SALES FIRST HALF 2022 VS. 2023 HOME SALES FIRST HALF 2022 VS. 2023 TOP 5 HOME SALES 2023 LAND SALES FIRST HALF 2022 VS. 2023
PROPERTY ADDRESS SOLD PRICE 32 Windmill Lane $77,775,000 51 West End Road $35,000,000 31 Two Mile Hollow Road $29,000,000 19 Hook Pond Lane $26,000,000 100 Further Lane $15,000,000 13% 35% SALES TRANSACTIONS 21% MEDIAN PRICE DOLLAR VOLUME PRICE CATEGORY 2022 SALES 2023 SALES % CHANGE Under $1M - -$1M - $1.99M 3 3$2M - $2.99M 6 6$3M - $4.99M 5 1 -80% $5M - $9.99M 9 3 -67% $10M - $19.99M 2 2OVER $20M 4 4Sales Transactions 29 19 -35% Median Price $5.1M $4.05M -21% Dollar Volume $276.41M $241.74M -13% LAND 2022 2023 % CHANGE Sales Transactions 5 2 -60% Median Price $3.12M $4.99M 60% Dollar Volume $20.8M $9.98M -52%
east hampton village

27 HAMPTONS REAL ESTATE MARKET REPORT, FIRST HALF 2022 VS. 2023 HOME SALES FIRST HALF 2022 VS. 2023 HOME SALES FIRST HALF 2022 VS. 2023 TOP 5 HOME SALES 2023 LAND SALES FIRST HALF 2022 VS. 2023
PROPERTY ADDRESS SOLD PRICE 30 Briarcroft Drive $4,400,000 146 Old Stone Highway $3,250,000 291 Three Mile Harbor HC Road $2,500,000 22 Three Mile Harbor HC Road $2,400,000 36 Bonac Woods Lane $2,142,100 54% 54% SALES TRANSACTIONS 3% MEDIAN PRICE DOLLAR VOLUME PRICE CATEGORY 2022 SALES 2023 SALES % CHANGE Under $1M 22 11 -50% $1M - $1.99M 29 16 -45% $2M - $2.99M 14 3 -79% $3M - $4.99M 4 2 -50% $5M - $9.99M - -$10M - $19.99M - -OVER $20M - -Sales Transactions 69 32 -54% Median Price $1.34M $1.3M -3% Dollar Volume $105.27M $48.15M -54% LAND 2022 2023 % CHANGE Sales Transactions 11 7 -36% Median Price $660K $730K 11% Dollar Volume $9.15M $5.55M -39%
east hampton springs
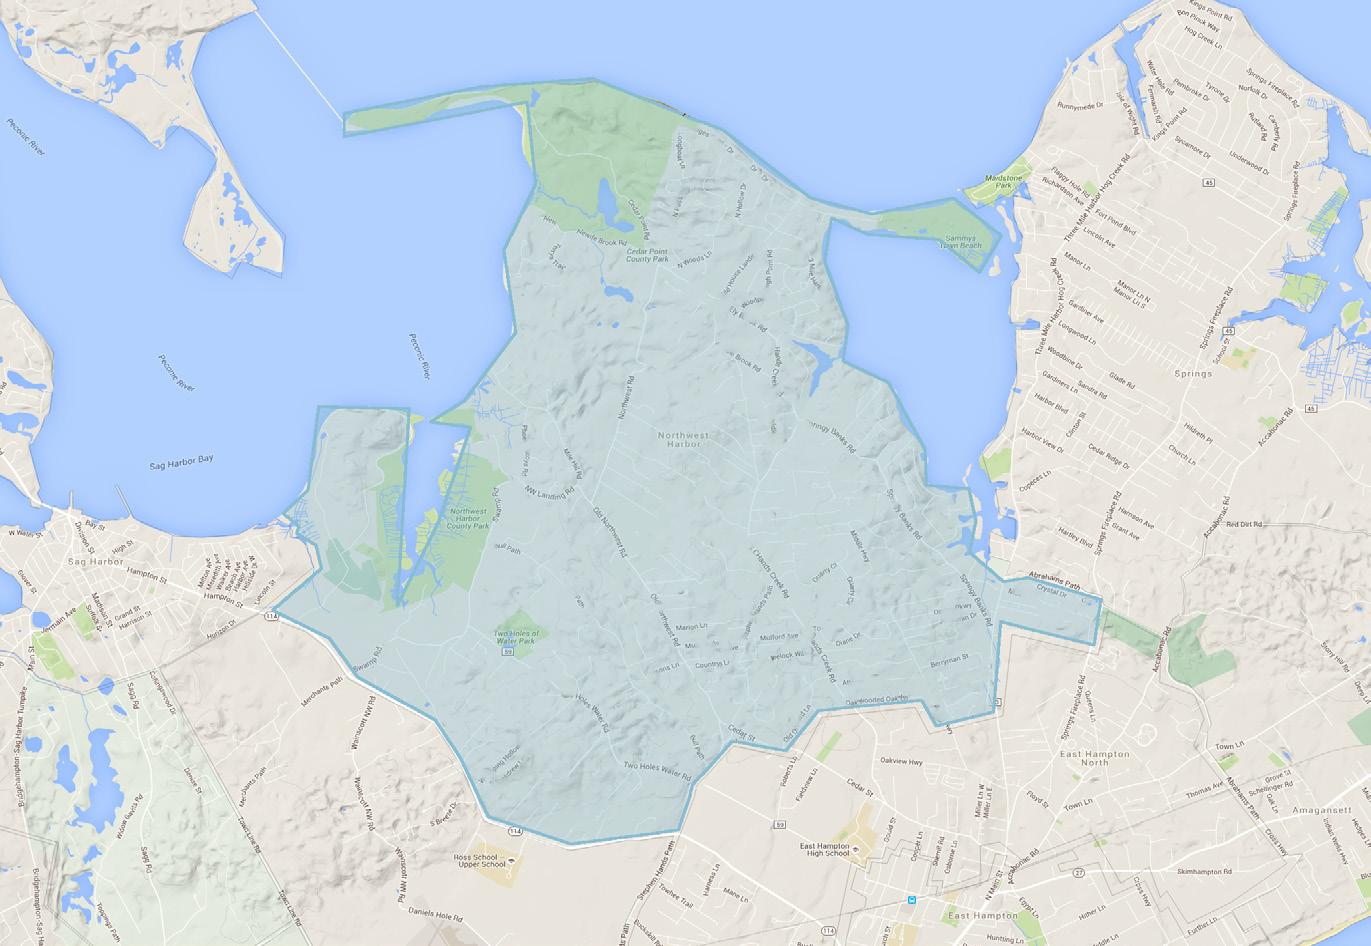
28 HAMPTONS REAL ESTATE MARKET REPORT, FIRST HALF 2022 VS. 2023 HOME SALES FIRST HALF 2022 VS. 2023 TOP 5 HOME SALES 2023 LAND SALES FIRST HALF 2022 VS. 2023 PROPERTY ADDRESS SOLD PRICE 20 Peach Farm Lane $6,075,000 203 Bull Path $4,800,000 24 North Bay Lane $4,000,000 9 Oyster Shores Road $3,937,500 11 Woodpink Drive $3,875,000 east hampton northwest 70% SALES TRANSACTIONS 8% MEDIAN PRICE DOLLAR VOLUME PRICE CATEGORY 2022 SALES 2023 SALES % CHANGE Under $1M 7 - -100% $1M - $1.99M 30 11 -63% $2M - $2.99M 25 9 -64% $3M - $4.99M 21 6 -71% $5M - $9.99M 3 1 -67% $10M - $19.99M 1 - -100% OVER $20M - -Sales Transactions 87 27 -69 Median Price $2.19M $2.02M -8% Dollar Volume $223.19M $67.83M -70% LAND 2022 2023 % CHANGE Sales Transactions 10 4 -60% Median Price $778K $942K 21% Dollar Volume $9.41M $4.21M -55% 69%
76% SALES TRANSACTIONS
88%
32% MEDIAN PRICE DOLLAR VOLUME
29 HAMPTONS REAL ESTATE MARKET REPORT, FIRST HALF 2022 VS. 2023 HOME SALES FIRST HALF 2022 VS. 2023 HOME SALES FIRST HALF 2022 VS. 2023 LAND SALES FIRST HALF 2022 VS. 2023 TOP 5 HOME SALES 2023 amagansett
PRICE CATEGORY 2022 SALES 2023 SALES % CHANGE Under $1M 4 - -100% $1M - $1.99M 3 - -100% $2M - $2.99M 4 2 -50% $3M - $4.99M 9 5 -44% $5M - $9.99M 11 1 -91% $10M - $19.99M 4 1 75% OVER $20M 3 - -100% Sales Transactions 38 9 -76% Median Price $4.74M $3.24M -32% Dollar Volume $296.11M $36.83M -88% LAND 2022 2023 % CHANGE Sales Transactions 4 3 -25% Median Price $2.17M $1.25M -43% Dollar Volume $17.25M $10.01M -42% PROPERTY ADDRESS SOLD PRICE 411 Town Lane $11,149,875 11 Atlantic Avenue $5,130,000 26 Gardiner Drive $3,500,000 2 Katie Lane $3,295,000 76 Gardiner Drive $3,235,000
61% SALES TRANSACTIONS 21% MEDIAN PRICE DOLLAR VOLUME LAND 2022 2023 % CHANGE Sales Transactions 10 3 -70% Median Price $1.01M $400K -61% Dollar Volume $17.3M $1.74M -90% PROPERTY ADDRESS SOLD PRICE 216 Old Montauk Hwy. $14,000,000 36 Homeward Lane $8,348,000 42 Old West Lake Drive $5,150,000 34 Hoppin Avenue $3,890,000 164 West Lake Drive $3,125,000
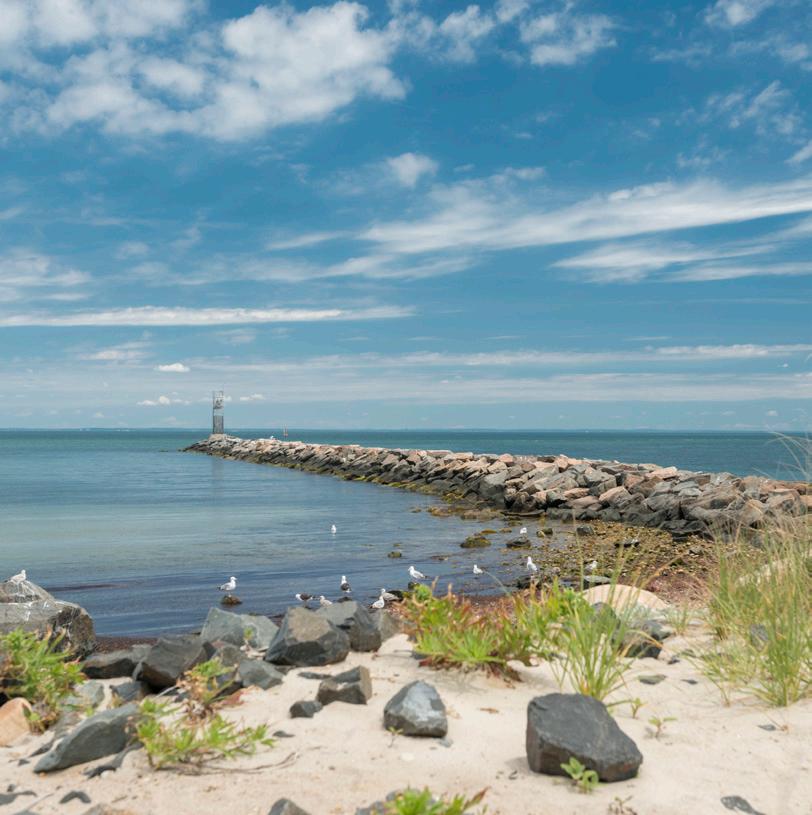
30 HAMPTONS REAL ESTATE MARKET REPORT, FIRST HALF 2022 VS. 2023 HOME SALES FIRST HALF 2022 VS. 2023 HOME SALES FIRST HALF 2022 VS. 2023 LAND SALES FIRST HALF 2022 VS. 2023 CONDO SALES FIRST HALF 2022 VS. 2023 TOP 5 HOME SALES 2023 montauk
61% PRICE CATEGORY 2022 SALES 2023 SALES % CHANGE Under $1M 3 - -100% $1M - $1.99M 19 9 -53% $2M - $2.99M 13 3 -77% $3M - $4.99M 9 2 -78% $5M - $9.99M 7 2 -71% $10M - $19.99M - 1 N/A OVER $20M - -Sales Transactions 51 20 -61% Median Price $2.1M $1.65M -21% Dollar Volume $144.43M $55.77M -61% CONDO 2022 2023 % CHANGE Sales Transactions 16 8 -50% Median Price $750K $618K -18% Dollar Volume $12.07M $10.12M -16%
AlabamaTitleInsurance.com
AlaskaTitleInsurance.com
ArizonaTitleInsurance.com
ArkansasTitleInsurance.com
CaliforniaTitleInsurance.com
ColoradoTitleInsurance.com
ConnecticutTitleInsurance.com
DelawareTitle.com
FloridaTitle.com
GeorgiaTitleInsurance.com
HawaiiTitleInsurance.com
IdahoTitleInsurance.com
IllinoisTitle.com
IndianaTitle.com
IowaTitleInsurance.com
KansasTitle.com
KentuckyTitle.com
KentuckyTitleInsurance.com
LouisianaTitleInsurance.com
MaineTitle.com
MaineTitleInsurance.com
MarylandTitle.com
MassachusettsTitleInsurance.com
MichiganTitleInsurance.com
MinnesotaTitleInsurance.com
MississippiTitle.com
MississippiTitleInsurance.com
MissouriTitle.com
MontanaTitleInsurance.com
NebraskaTitle.com
NebraskaTitleInsurance.com
NevadaTitleInsurance.com
NewHampshireTitleInsurance.com
NewJerseyTitle.com
NewMexicoTitle.com
NewMexicoTitleInsurance.com
NewYorkTitle.com
NewYorkTitleInsurance.com
NorthCarolinaTitle.com
NorthCarolinaTitleInsurance.com
NorthDakotaTitle.com
OhioTitle.com
OklahomaTitleInsurance.com
OregonTitle.com
OregonTitleInsurance.com
PennsylvaniaTitle.com
RhodeIslandTitle.com
RhodeIslandTitleInsurance.com
SouthCarolinaTitle.com
SouthCarolinaTitleInsurance.com
SouthDakotaTitleInsurance.com
TennesseeTitleInsurance.com
TexasTitleInsurance.com
UtahTitleInsurance.com
VermontTitle.com
VirginiaTitle.com
WashingtonTitleInsurance.com
WashingtonDCTitle.com
WashingtonDCTitleInsurance.com
WestVirginiaTitle.com
WestVirginiaTitleInsurance.com
WisconsinTitleInsurance.com
WyomingTitleInsurance.com

“New York Title Abstract Services, Inc. Insuring The Future” is registered in the U.S. Patent and Trademark Office. TitleInsurance.com | NewYorkTitle.com (631) 537- 4400 | 2510 Montauk Highway, Bridgehampton | Info@NewYorkTitle.com | @NewYorkTitle | YOUR LOCAL HAMPTONS TITLE EXPERTS TITLE INSURANCE | NYTA LAND USE REPORTS SM | DOCUMENT REQUESTS
We are in the process of building-out our innovative national title insurance model and soon will be able to provide title services nationwide....Stay Tuned.
In the meantime, as the leading title insurance firm in the Hamptons, we encourage you to contact us for all of your title insurance needs in the Hamptons and in New York State. TitleInsurance.com
HOME SALES FIRST HALF 2022 VS. 2023 HOME SALES FIRST HALF 2022 VS. 2023 TOP 5 HOME SALES 2023 LAND SALES FIRST HALF 2022 VS. 2023 CONDO SALES FIRST HALF 2022 VS. 2023 Copyright 2023. As a licensed real estate broker, Saunders & Associates is pledged to the letter and spirit of U.S. policy for the achievement of equal housing opportunity throughout the nation. Saunders & Associates encourages and supports an affirmative advertising and marketing program in which there are no barriers to obtaining housing because of race, color, religion, sex, handicap, familial status or national origin. All material presented in this publication is intended for informational purposes only. While this information is believed to be correct, it is presented subject to errors, omissions, change and withdrawal without notice. All material presented here is intended for informational purposes only and all outlines are approximate. Please recycle this booklet. “Saunders, A Higher Form of Realty” is registered in the U.S. Patent and Trademark Office. Transaction data provided by LIRealEstateReport.com as of August 11th, 2023.
