RATIO ANALYSIS TECHNIQUE IN 2008-09 - Vijaya Bank

Page 1

RATIO ANALYSIS TECHNIQUE IN 2008-

09

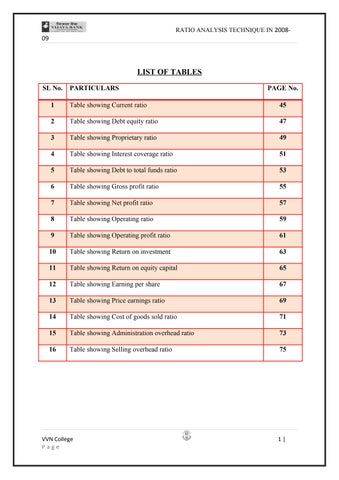
LIST OF TABLES SL No.

PARTICULARS

PAGE No.

1

Table showing Current ratio

45

2

Table showing Debt equity ratio

47

3

Table showing Proprietary ratio

49

4

Table showing Interest coverage ratio

51

5

Table showing Debt to total funds ratio

53

6

Table showing Gross profit ratio

55

7

Table showing Net profit ratio

57

8

Table showing Operating ratio

59

9

Table showing Operating profit ratio

61

10

Table showing Return on investment

63

11

Table showing Return on equity capital

65

12

Table showing Earning per share

67

13

Table showing Price earnings ratio

69

14

Table showing Cost of goods sold ratio

71

15

Table showing Administration overhead ratio

73

16

Table showing Selling overhead ratio

75

VVN College Page

1|


RATIO ANALYSIS TECHNIQUE IN 2008-

09

LIST OF CHARTS SL No.

PARTICULARS

PAGE No.

1

Chart showing Current ratio

46

2

Chart showing Debt equity ratio

48

3

Chart showing Proprietary ratio

50

4

Chart showing Interest coverage ratio

52

5

Chart showing Debt to total funds ratio

54

6

Chart showing Gross profit ratio

56

7

Chart showing Net profit ratio

58

8

Chart showing Operating ratio

60

9

Chart showing Operating profit ratio

62

10

Chart showing Return on investment

64

11

Chart showing Return on equity capital

66

12

Chart showing Earning per share

68

13

Chart showing Price earnings ratio

70

14

Chart showing Cost of goods sold ratio

72

15

Chart showing Administration overhead ratio

74

16

Chart showing Selling overhead ratio

76

VVN College Page

2|


09

RATIO ANALYSIS TECHNIQUE IN 2008-

CHAPTER I

INTRODUCTION

VVN College Page

3|


RATIO ANALYSIS TECHNIQUE IN 2008-

09

1.1 INTRODUCTION Accounting serves the purpose of providing financial information relating a business. Such information is provided to people who have an interest in the organization, such as share holders, managers, creditors, debenture holders, bankers, tax authorities and others. Broadly speaking, on the basis of type of accounting information and the purpose for which such information is used, accounting may be divided into three categories: 1.

Financial Accounting (General Accounting)

2.

Cost Accounting

3.

Management Accounting

MANAGEMENT ACCOUNTING 1.1.1 MEANING: The term ‘management accounting’ is the modern concept of accounts as a total of management. It is a broad term and is concerned with all such accounting information that is useful to management. In simple words, the term management accounting is applied to the provision of accounting information for management activities such as planning, controlling and decision making, etc.

1.1.2 DEFINITIONS: According to the Institute of Charted Accountants of England, “any form of accounting which enables a business to be conducted more efficiently” may be regarded as management accounting. Management accounting information can help managers identify problems, solve problems and evaluate performance. In the words of Robert Anthony, “Management accounting is concerned with accounting information that is useful to management.”

VVN College Page

4|


RATIO ANALYSIS TECHNIQUE IN 2008-

09

The Institute of Cost and Works Accountants of India (ICWAI) has defined management accounting as “a system of collection and presentation of relevant economic information relating to an enterprise for planning, controlling and decision making.” The Charted Institute of Management Accountants (CIMA) of UK has given a very authoritative and comprehensive definition as follows: “Management accounting is an Integral part of management concerned with identifying presenting and interpreting information used for – i.

Formulating strategy

ii.

Planning and controlling activities

iii.

Decision making

iv.

Optimizing the use of resources

v.

Disclosure to shareholders and others externals to the entity

vi.

Disclosure to employs and safeguard assets”

1.1.3 SCOPE OF MANAGEMENT ACCOUNTING Management accounting has a very wide scope. It includes not only financial accounting and cost accounting but also all types of internal financial controls, internal audit, tax accounting, office services, cost control and other methods and control procedures. Thus scope of management accounting, inter alia includes the following: a. Financial accounting b. Cost accounting c. Budgeting and forecasting d. Tax planning VVN College Page

5|


RATIO ANALYSIS TECHNIQUE IN 2008-

09 e. Reporting to management f. Cost control procedures g. Statistical tools h. Internal control and internal audit i. Financial analysis and interpretation j. Office services

1.1.4 FUNCTIONS (OR OBJECTIVES) OF MANAGEMENT ACCOUNTING Main functions of management accounting are as follows: a. Planning b. Coordinating c. Controlling d. Communication e. Financial analysis and interpretation f. Qualitative information g. Tax policies h. Decision making

VVN College Page

6|


RATIO ANALYSIS TECHNIQUE IN 2008-

09

1.1.5 CHARACTERISTICS OR NATURE OF MANAGEMENT ACCOUNTING: It is clearly from the above definitions that management accounting is concerned with accounting data that is using in decision making. The main characteristics of management accounting are as follows: a. Using in decision making b. Financial in cost accounting information c. Internal use d. Purely optional e. Concerned with future f. Flexibility in presentation of information

1.1.6 LIMITATIONS OF MANAGEMENT ACCOUNTING Management accounting is a very useful tool of management. However, it suffers from certain limitations as stated below: a. Based on historical data b. Lack of wide knowledge c. Complicated approach d. Not a suitable of management e. Costly system f. Developing stage g. Lack of objectivity

VVN College Page

7|


RATIO ANALYSIS TECHNIQUE IN 2008-

09 h. Resistance from staff

1.2 RATIO ANALYSIS 1.2.1 INTRODUTION TO RATIO ANALYSIS: Ratio Analysis is the one of the powerful tools of the financial analysis. A ratio can be defined as ‘the indicated quotient of two mathematical expression’ and as ‘the relationship between two or more things’. Ratio is thus the numerical or an arithmetical relationship between two figures. Ratio analysis can be defined as the systematic used of ratio to interpret the financial statements so that the strengths and weakness of a firm as well as its historical performance and the current financial condition can be determined. The relationship between the two variables can be expressed as: a. Pure ratios say current assets to current liabilities are 2:1 b. A rate say current assets are two times of current liabilities c. A percentage say current assets are 200% of current liabilities These alternative methods of expressing items, which are related to each other, are for the purpose of financial analysis, referred to as ratio analysis. The rational of ratio analysis lies in the fact that it makes related information comparable. A single number by itself has no meaning but when expressed in terms of a related figure, it yields significant interface. Ratios become useful only when the comparison consists of past ratio or projected ratio or competitors ratio or industry ratio.

1.2.2 NATURE AND SCOPE OF RATIO ANALYSIS: Ratio Analysis is a powerful tool of financial analysis. Ratio Analysis is one of the tools of financial analysis. The other tools of financial analysis are: VVN College Page

8|


RATIO ANALYSIS TECHNIQUE IN 2008-

09 •

Comparative financial statements

Common measurement statements

Trends percentages analysis

Funds flow statement

Cash flow statement

Net working capital analysis Ratio analysis is a statistical yardstick that provides a measure of relationships between two accounting figures. Ratio analysis of financial statements stands for the process of determining and presenting the relationship of items and group of items in the statement. Ratio analysis can be used both in the trend/dynamic analysis and statistical analysis. There are several ratios that an analyst can comply but the type of ratio he would precisely use depends upon the purpose for which analysis is made.

1.2.3 OBJECTIVES OF RATIO ANALYSIS: The objectives of ratio analysis are as follows: •

The main objective of ratio analysis is to analyze the firm’s relative strength and weakness.

To evaluate the financial condition and performance of the firm.

To get way for useful interpretation out of the financial statements for the organization growth.

To suggest corrective measures when the financial condition and Performance of the firm is unfavorable.

1.2.4 IMPORTANCE OF RATIO ANALYSIS: VVN College Page

9|


RATIO ANALYSIS TECHNIQUE IN 2008-

09

Ratio analysis is the important technique of financial analysis. It is a way by which financial stability and health of a concern can be judged. The following are the main points of importance of ratio analysis.  Useful in financial position analysis: Accounting ratios reveal the financial position of the concern. This helps the banks, insurance companies, financial institutions, shareholders, investors and other interested people for making investment decisions.  Useful in simplifying accounting figures: Accounting ratios simplify, summarize and systematize the accounting figures in order to make them more understandable. They highlighted the inter relationship which exist between various segment of the business as expressed by the accounting systems.  Useful in assessing the operational efficiency: Accounting ratios helps to have an idea of the working of a firm. The efficiency of the concern becomes evident when analysis is an accounting ratio. They diagnose the financial position by using liquidity, Solvency and profitability etc. This helps the management to assess financial requirements and the capabilities of business units.  Useful in forecasting purposes: If accounting ratios are calculated for a number of years, then a trend is established. This trend helps in setting up future plans and forecasting.  Useful in locating the weak spots in the business: Accounting ratios are of great assistance in locating the weak spots in the business even though the overall performance may be efficient.

Weakness in

financial structure due to incorrect policies in the past or present are revealed through accounting ratios. E.g. If a firm finds that increase in distribution expenses is more

VVN College Page

10 |


RATIO ANALYSIS TECHNIQUE IN 2008-

09

than proportionate to the results expected or achieved it can take remedial steps to overcome this adverse situation.  Useful in comparison of performance: Through accounting ratios comparison can be made between one departments of a firm with another of the same firm in order to the performance of various departments in the firm.

1.2.5 ADVANTAGES OF RATIO ANALYSIS: The importance of ratio analysis lies in the fact that it presents facts on Comparative Basis. The following are the some of the advantages of ratio analysis.  Helps in the analysis of liquidity position of the firm. This ability is reflected in the liquidity ratios of the firm. The liquidity ratios are particularly useful in credit analysis by Banks and other suppliers of short-term loans.  Helps the analyzing long-term solvency of the firm.

Ratio analysis reveals the

strengths and weakness of a firm in this respect. The leverage ratios, for instance, will indicate whether a firm has reasonable proportion of various sources of funds or if it is heavily loaded with debt in which case its solvency is exposed to serious strain.  Yet another dimension of the usefulness of the ratio analysis, relevant from the viewpoint of management is that which throws light on the degree of efficiency in the management and utilization of its assets. The various activity ratios measure this kind of operational efficiency.  Ratio analysis provides an integrated view of the overall profitability of the firm, which the management is constantly concerned. It enables to analyze the ability of the firm to meet its short term as well as long-term obligations.

VVN College Page

11 |


RATIO ANALYSIS TECHNIQUE IN 2008-

09

 Helps in planning, forecasting the performance of the firm over a time. When the ratios are compared for previous, it indicates future success or failure.  Facilities for inter-firm comparison. An inter-firm comparison would demonstrate the firm’s position and also its competitors. If the results are at variance either with the industry standard or with those competitors, the firm can seek to identify the probable reasons and in light take remedial measures.  Facilities for trend analysis. The advantage of trend analysis of ratios lies in the fact that the analyst can know the direction of movement is Favorable or unfavorable when compared over the years.

1.2.6 LIMITATIONS OF RATIO ANALYSIS: Ratio analysis is very important revealing the financial position of the business. But in spite, of its limitations, which restricts its use. These limitations should be kept in mind while making use of ratio analysis for interpreting the financial statements. The following are the main limitations of ratio analysis.  False results if based on incorrect accounting data: Accounting ratios can be correct only if the data are correct. Sometimes the information given in the financial statements is effected by window dressing that is showing position better than what actually is.  No idea of probable happenings in future: Ratios are an attempt to make an analysis is of the past financial statements so they are historical documents. Now-a-days keeping in view the complexities of the business, it is important to have an idea of probable happenings in future.  Variations in accounting methods: The two firm’s results are comparable with the help of accounting ratios only if they follow the same accounting methods or bases. Comparison will become difficult if the two concerns follow the different methods of providing depreciation,

VVN College Page

12 |


RATIO ANALYSIS TECHNIQUE IN 2008-

09

differences in the basis of inventory valuation, estimated working of financial statements of such firms by means of ratios is bound to be misleading.

 Price level changes: Changes in price level make comparison for various years difficult. For example the ratio of sales to total assets in 1998 would be much higher than in 1980 due to rising prices, fixed assets being shown at cost and not at Market price.  Only one method of analysis: Ratio analysis is only a beginning and gives just a fraction of information needed for decision-making. Therefore to have a comprehensive analysis of financial statements, ratios should be used along with other methods of analysis.  No Common standards: It is very difficult to lay down a common standard for comparison because circumstances differ from concern to concern and the nature of each industry is different. For example a business with current ratio of more than 2:1 might not be in a position to pay current liabilities in time because of an unfavorable distribution of current assets in relation of liquidity and vice-versa in other concern.  Different meanings assigned to the same term: Different firms, in order to calculate ratio may assign different meanings. For example, profit for the purpose of calculating a ratio may be taken as profit before charging interest and tax or profit before tax interest or profit after tax and interest.

VVN College Page

13 |


RATIO ANALYSIS TECHNIQUE IN 2008-

09

1.2.7CLASSIFICATION OF RATIOS: Several ratios, calculated from the accounting data, can be grouped into various classes according to the function. The parties in the ratio analysis are short term and long-term creditors, owners and management. Short-term creditors’ main interest is in the liquidity or short-term solvency of the firm. Long term creditors on the other hand, are more interested in the long-term solvency and the profitability of the firm. Similarly owners concentrate on the firm’s profitability and financial condition. Management is interested in evaluating every aspect of the firm’s performance. They have to protect the interest of all parties and see that the firms grow profitability. In view of the requirements of the various users of ratios, we may classify them into the following four important categories. They are:  Liquidity ratios  Capital structure ratios  Turnover ratios or Activity ratios  Profitability ratios

1)Liquidity ratio Current ratio Quick ratio

2) Capital structure ratio Debt equity ratio Proprietary ratio Solvency ratio

3) Turnover ratio Stock TOR Debtors TOR Creditors TOR Current Asset TOR

4) Profitability ratio GP ratio NP ratio Operating ratio Return on shareholder fund ratio

VVN College Page

14 |


RATIO ANALYSIS TECHNIQUE IN 2008-

09

LIQUIDITY RATIOS Liquidity ratios help in measuring the ability of the firm to meet its current obligation. Infect, the analysis of the liquidity needs the preparations of each budgets and cash flow statements, but liquidity ratios by establishing relationship between cash and other current assets to current obligations, gives us a quick measure of liquidity. It is extremely important for a firm to be able to meet its obligations as it becomes due. A firm should ensure that it does not suffer from lack of liquidity and also that it is not too highly liquid. The failure of a company to meet its obligations due to lack of sufficient liquidity will result in the closure of the firm. A very high degree of liquidity is also bad, idle assets earn nothing. The firm’s funds will be unnecessarily locked up in the current assets. Therefore it is necessary to strike a proper balance between liquidity and non-liquidity. The ratios that indicate the extent of liquidity are as follows: • Current ratio • Quick ratio or Acid test ratio • Absolute liquid ratio

 CURRENT RATIO It may be defined as the relationship between current assets and current liabilities. The measure of the general liquidity of the firm for the short period of the time Current Ratios = Current Assets / Current Liabilities VVN College Page

15 |


RATIO ANALYSIS TECHNIQUE IN 2008-

09

Current assets include cash and other assets, which can be converted into cash within a year, such as marketable securities, debtors and inventory. Prepaid expenses should be included in the current assets as they represent the payments that need not be paid by the firm in the near future. All obligations maturing within a year are included in current liabilities. Thus current liabilities include creditors, bills payable, accrued expenses, bank overdraft, income tax liability and long term debt maturing in the current year. The current ratio is a measure of the firm’s short-term solvency. It indicates the availability of current assets in rupees for every one rupee of current liability As a conventional rule, a current ratio of 2:1 or more is considered satisfactory.

 QUICK RATIO/ACID TEST RATIO The quick or acid test ratio is more defined measure of the firm’s liquidity. This ratio establishes a relationship between quick or liquid assets and current liabilities. An asset is liquid if it can be converted into cash immediately or within a reasonable time without a loss of value. Quick ratio = Liquid assets / Current Liabilities Quick assets include cash and book debts (Debtors and Bills receivable) only. Inventories are excluded because it takes time to sell finished goods and convert raw materials and work in progress into finished goods. There is also uncertainty in selling of inventories. Since the expenses cannot be converted into cash, the prepaid expenses are excluded. By convention a quick ratio of 1:1 is considered. It is considered that if quick assets are equal to current liabilities then the concern can meet its obligation

 ABSOLUTE EQUITY RATIO: This is known as super quick ratio or cash ratio. In calculating this ratio, both inventories and receivables are deducted from the current assets to arrive at absolute liquid assets such as cash and easily VVN College Page

16 |


RATIO ANALYSIS TECHNIQUE IN 2008-

09

marketable investments in securities. Higher the ratio, the higher is the cash liquidity. A low ratio is not a serious matter because the company always borrows from the bank for short –term requirements. Absolute liquidity ratio = cash in hand and at bank + short term marketable securities / current liabilities

CAPITAL STRUCTURE RATIOS OR GEARING RATIOS  DEBT EQUITY RATIO Debt equity ratio shows the relationship between the total debts and owned capital. It is the ratio of the amount invested by the outsiders to the amount invested by the shareholders. It is also known external internal equity ratio. This ratio reflects the relative claims of the shareholder and creditors against the assets of a company alternatively. It may be expressed as follows. Debt equity ratio =

External equity / Internal equity OR Debt equity ratio = Outsiders fund / Shareholders fund The term external equity refers to total outside liabilities or borrowed funds. Outside liabilities include all debts whether long term or short term. Internal equity or shareholders funds include equity share capital, preference share capital, reserves and surpluses. Internal equity is to net worth. A ratio of 1:1 is considered to be a satisfactory ratio although cannot be any standard norm for all business.

 PROPRIETARY RATIO This is a variant of debt equity ratio. This ratio establishes the relationship between shareholders funds and total assets. It indicates the proportion of total assets financed by shareholders. It is usually computed as follows: VVN College Page

17 |


RATIO ANALYSIS TECHNIQUE IN 2008-

09

Proprietary ratio = Shareholders / Total assets or Total resources X 100 A high proprietary ratio indicates a relatively favorable position to the creditors at the time of liquidation. On the other hand, a low ratio indicates a higher risk to creditors.

 INTEREST COVERAGE RATIO This ratio indicates whether the business earns sufficient profit to pay periodically the interest charges. Interest coverage ratio = earnings before tax and interest (EBIT) / Fixed interest charges

 DEBT TO TOTAL FUNDS RATIO

This ratio shows the relationship between debts and the total funds employed in the business. The term debt includes long – term loans and current liabilities like sundry creditors, bills payable, bank overdraft, outstanding expenses etc. Total funds employed include shareholder funds, long term loans and current liabilities. Debts to total funds ratio = Debt / Total funds

 CAPITAL GEARING RATIO This is the ratio between the fixed interest bearing securities and equity share capital. Fixed income securities include debentures and preference share capital. Thus the ratio is: VVN College Page

18 |


RATIO ANALYSIS TECHNIQUE IN 2008-

09

Capital gearing ratio = Fixed income securities / Equity share holders fund A company is highly geared if the ratio is more than one. If it is less than one, it is low geared. If the ratio is exactly one, it is evenly geared. A highly geared company has the advantage of trading on equity.

TURNOVER RATIOS  INVENTORY TURNOVER RATIO This ratio is calculated by dividing the cost of goods sold by average inventory.

Inventory turnover ratio = Cost of goods sold / Average stock

 DEBTORS TURNOVER RATIO VVN College Page

19 |


RATIO ANALYSIS TECHNIQUE IN 2008-

09

Debtor’s turnover ratio is the ratio, which indicates the relationship between debtors and sales. It is the ratio, which indicates the number of times the debtors are collected in a year. This ratio is generally expressed as a rate that is as so many times. It is expressed as follows: Debtors turnover ratio = Net annual credit sales / Average receivables or Average debtors Here, Net annual credit sales = total sales – cash sales – sales returns. Average receivables = closing debtors + closing bills receivables

 CREDITORS TURNOVER RATIO Creditors’ turnover ratio is the ratio between creditors and purchases. It indicates the number of times the creditors are paid in a year. This ratio is generally expressed as a rate that is as so many times. It is expressed as follows: Creditors turnover ratio = Net annual Credit purchases / Average creditors & average bills payable

 CASH TURNOVER RATIO Cash turnover ratio is the ratio between cash and sales. Cash for this purpose means cash in hand, cash at bank and readily realizable investments or securities. Sales means, total annual sales minus sales returns. This ratio is expressed as a proportion that is as. Cash turnover ratio = Net annual sales / Cash

 WORKING CAPITAL TURNOVER RATIO

VVN College Page

20 |


RATIO ANALYSIS TECHNIQUE IN 2008-

09

Working capital turnover ratio is the ratio between working capital and turnover. Working capital is the excess of current assets over current liabilities. Turnover means net sales. This ratio is expressed as proportion that is as. Working capital turnover ratio = Net sales / Working capital A higher working capital turnover ratio indicates the efficiency and a lower working capital turnover ratio indicates the inefficiency of the management in the utilization of working capital.

PROFITABILITY RATIOS  RETURN ON INVESTMENT Return on capital employed ratio or return on investment ratio is the ratio between return on capital employed. Return on capital employed means operating profit or net profit before deducting interest on long term loans and deposits, debentures and taxes. Capital employed refers to the total long-term funds employed or used in the business. Return on capital employed is calculated as follows: VVN College Page

21 |


RATIO ANALYSIS TECHNIQUE IN 2008-

09

Return on capital employed = Operating profit / Capital employed X 100 Here, Operating profit = Profit before interest and tax. Capital employed =Equity share capital + Preference share capital + un disturbed profit + Reserves and surplus + Long term liabilities – Fictitious assets – Non business assets. This ratio is the measure of productivity of the capital employed in the business. In other words, it indicates the overall profitability of the business.

 RETURN ON TOTAL ASSETS RATIO Return on totals assets or total resources ratio is the ratio of the net profit to total assets or total resources. Return here means the net profit after tax that is final net profit.

Total assets or total resources mean all realizable assets, including

intangible assets if they are realizable. This ratio is calculated as follows: Return on total assets ratio = Net profit / Total assets X 100

 EARNING PER SHARE ( E.P.S) E.P.S is a ratio between net profit available for equity shareholders i.e., net profit after taxes and preference dividends, and the number of equity shares. In other words, it means Earning per equity share. The earning per shares expressed as follows: Earnings per share = Net profit available for equity shareholders / Number of equity shares VVN College Page

22 |


RATIO ANALYSIS TECHNIQUE IN 2008-

09

 DIVIDEND PAYOUT RATIO Dividend payout ratio is the ratio between dividend per equity share and earnings per equity share. This ratio indicates to what portion of earnings per share has been used for paying dividend and what portion has been retained for ploughing back. It also throws light on the chances of appreciation in the price of the shares. The payout ratio is expressed as follows: Dividend payout ratio =

Dividend per equity share / Earnings per equity share X

100 A low payout ratio indicates that only a small portion of earnings of the company has been used for dividend and the major portion if the earnings is retained as ploughing back. On the other hand, a very high payout ratio indicates that the entire earning of the company has been for dividend, and nothing is retained for ploughing back.

 PRICE EARNING RATIO Price Earnings Ratio is the ratio, which express the relationship between market price per share and earnings per share. The price earnings ratio is usually expressed as follows: Price earnings ratio = Market price per equity share / Earnings per equity share This ratio indicates the number of times the earnings per share is covered by its market price. This ratio is very useful to an investor for predicting the market price of the share at some future data. It is also useful to the financial manager in connection with the fresh issue of shares.

 INTEREST EARNED TO TOTAL INCOME This ratio assesses the share of interest income of the bank, as interest is a major source of income to a bank. This ratio can be applied to both aspects of interest earned on investments and interest earned on loans and advances.

VVN College Page

23 |


RATIO ANALYSIS TECHNIQUE IN 2008-

09

Interest earned to total income = Interest earned / Total income X 100

 INTEREST PAID TO TOTAL INCOME: Interest paid on borrowings and deposits is the main expenditure for the bank. The ratio of interest paid to total income indicates the extent of total income that is drained out for payment of interest. Interest paid to total income = Interest Paid / Total income

 TOTAL EXPENDITURE TO TOTAL INCOME Working out this ratio indicates the percentage of expenditure incurred by the bank for earning its total income. This also reveals the profitability of bank. Total expenditure to total income = Total expenditure / Total Income X 100 Total Expenditure = Expenditure – N/ P.

 NET PROFIT TO TOTAL DEPOSITS The bank needs to mobilize deposits and other funds more of no cost and low cost deposits. Very efficient employment of funds in loans and advances should be there instead of maintaining excess liquidity over the statutory requirement. Net Profit to Total Deposits =

Net Profit / Total Deposits X 100

 NET PROFIT TO INTEREST EARNED The ratio indicates the relationship between interest earned and interest paid. More of interest earned than interest paid is a good ratio indicator. Net Profit to Spread = Net Profit / Spread X 100

VVN College Page

24 |


RATIO ANALYSIS TECHNIQUE IN 2008-

09

 RATIO ESTABLISHMENT EXPENDITURE TO TOTAL EXPENDITURE In order to conduct the banking business, a share of interest income will be directed towards establishment expenses like staff and Bank establishment. Establishment expenditure Total expenditure = Establishment expenses / Total Expenditure X 100

 RATIO OF COST MANAGEMENT This would be worked out with reference to the total cost of establishment expenses to working capital. It reveals the cost of operating & cost of managing the bank. The bank should inculcate cost consciousness among its staff. Ratio of Cost Management = Establishment expenses / Working capital X 100

 INTEREST PAID ON DEPOSITS Interest paid on borrowings and deposits is the main expenditure for the Bank. The ratio is calculated by dividing interest paid by total deposit. Interest paid on deposit = Interest paid / Total deposits X 100

 OTHER EXPENDITURE TO TOTAL INCOME: This expenditure is calculated to know other expenses of Bank that is the expenses other than interest paid. Other expenditure to total income = other expenditure / Total income X 100 Other Expenditure = Total expenditure – Interest paid

VVN College Page

25 |


RATIO ANALYSIS TECHNIQUE IN 2008-

09

Total expenditure = (Expenditure – N/P)

VVN College Page

26 |


RATIO ANALYSIS TECHNIQUE IN 2008-

09

CHAPTER II

RESEARCH DESIGN

RESEARCH METHODOLGY Title of the project “Financial analysis of VIJAYA Bank Using Ratio Analysis Technique”

2.1 INTRODUCTION TO THE RESEARCH PROBLEM:

VVN College Page

27 |


RATIO ANALYSIS TECHNIQUE IN 2008-

09

Research design simply means a search of facts answers to question or solution to problems. It is a prospective investigation. Research is a systematic and logical study of an issue or problem through scientific method. It is a systematic and objective analysis and according to controlled observations, that may lead to development of general principles, resulting in predictions and possibility ultimate control of events. A Research design is the arrangement of conditions for the collection and analysis of data in a manner that aims to combine relevance to the research purpose with economy in the procedure. There are various research designs, but descriptive and analytical research designs are most suitable for this study. Sources of data A) Secondary data The sources of data for the study are particularly secondary in nature. The secondary accounting data and other related information have been collected from the management of VIJAYA BANK and it includes Annual Reports and financial statements of the company. Sampling plan Not applicable because only VIJAYA BANK is taken for study and concentrate on financial performance of the company.

2.2 STATEMENT OF PROBLEM: Analysis of financial statement i.e. income statement and the balance sheet is very difficult to analyze the complete picture of financial performance. Therefore

VVN College Page

28 |


RATIO ANALYSIS TECHNIQUE IN 2008-

09

there is a need of applying the modern tools of management accounting to access the exact financial performance and position of the business enterprise. The ratio analysis technique is a crucial technique to assess the financial status of the organization. The project has been undertaken with the aim of analyzing the financial status of VIJAYA BANK for 4 years. To evaluate a firm’s financial conditions and performance, there is a need to perform check up a various aspects of a firm’s financial health. A tool frequently used during these checks up is a financial ratio or index, which relates two pieces of financial data by dividing one quantity by the other. A financial analyst user uses these ratios much like a skilled physician uses lab tests results.

2.3 PURPOSE OF STUDY: The main objective of the study is to conduct a trend analysis of “VIJAYA BANK”. Trend ratios involve a comparison of ratios of a firm over time i.e. present ratios are compared with past ratios of the firm. For the purpose of comparison of the profitability of VIJAYA BANK, a time period of 5 years has been taken (2004-2008) quantitatively. The study examines the direction of change in the performance, improvement, deterioration or constancy over the years qualitatively. It would also analyze the status of the firm and its prospects for the future.

2.4 SCOPE OF STUDY: VVN College Page

29 |


RATIO ANALYSIS TECHNIQUE IN 2008-

09

Ratio analysis is perhaps the first financial tool development to analyze and interpret the financial statement and is still used widely for the purpose. Financial performance analyze is a well researched area and innumerable studies have proved the utility and usefulness of this analytical technique. This research seeks to investigate and constructively contribute to help: •

The company in finding out the gray areas for improvement in performance.

The company to understand its own position over time.

The company to understand their contribution to the performance of the company.

The present and potential investors, outside parties such as the creditors, debtors, government and many more to get an idea of the overall performance of the firm.

2.5 OBJECTIVES OF THE STUDY: •

To ascertain the financial ratios which are likely to reflect the liquidity, profitability, solvency as well as the profit of VIJAYA BANK.

To calculate the profit of VIJAYA BANK and to analyze the profits over the years.

To reflect the financial position of the Organization.

To plan and forecast of the events.

VVN College Page

30 |


RATIO ANALYSIS TECHNIQUE IN 2008-

09

2.6 OPERATIONAL DEFINITION AND CONCEPTS: 2.6.1 DEFINITION OF CONCEPTS: •

Financial analysis: The use of financial data to evaluate the financial position of a firm.

Balance Sheet: A summary of firms financial position on a given data that shows total assets= Total liabilities + Owners equity.

Income Statement: A summary of a firm’s revenues and expenses over a specific period ending with net income or loss for the period.

Financial ratio: An index that relates two accounting numbers and it obtained by dividing one number by other.

Liquidity: Ability to meet short-term obligations when they become due.

Profit: Measure of efficiency and control.

Profitability: The ability to earn an adequate return on sales, total assets and invested capital.

Share Holders equity: Total assets – Total liabilities.

Current ratio: The ratio of current assets to current liabilities.

Quick ratio: The ratio of quick assets to current liabilities

Coverage ratio: Ratios that relate financial charges of a firm to its ability to cover.

Debt equity ratio: The ratio of debt to equity. It is a measure of long-term financial position of the firm.

Interest coverage ratio: Earnings before interest and tax divided by invested capital interest changes. It indicates a firm’s ability to cover interest changes.

VVN College Page

31 |


RATIO ANALYSIS TECHNIQUE IN 2008-

09 •

Proprietary ratio: This ratio establishes the relationship between the shareholders funds and total assets.

It indicates the proportion of total assets financed by

shareholders. •

Unsecured Loans: A form of debt for money borrowed that is not backed by pledge of specific assets.

Contra entry: A contra entry is one which is offset by an opposite entry, either a debit or credit.

CHAPTER III COMPANY PROFILE

VVN College Page

32 |


RATIO ANALYSIS TECHNIQUE IN 2008-

09

INDUSTRIAL BACKGROUND OF THE PROJECT 3. INDUSTRIAL BACKGROUND: In Today banks have become a part and parcel of our life. Now banks offer access even a common and their activities extend to areas which are untouched. Apart from their traditional business oriented functions they have now come out to fulfill national responsibilities. They accelerate the economic growth of a country and steer the wheels of the economy towards its goal of “self reliance in all fields”.

3.1 ORIGIN OF BANKING: The word Bank has been originally derived from the Italian word ‘Banco’ meaning a bench. In olden days money lenders used to exhibit the coins of different countries on a separate bench and the business of exchanging the coins were carried on through those money lenders, especially in Greece, Italy and England. Whenever these moneylenders were not in a position to convert the currency of one country into the currency of another, people virtually broke up their benches. Hence, the word VVN College Page

33 |


RATIO ANALYSIS TECHNIQUE IN 2008-

09

‘Bankrupt’. The word Bank has also originated from German word ‘Bank’, meaning thereby a joint-stock fund, collected from public for the purpose of financing the needy people.

3.2 EVALUATION OF BANKING IN INDIA: Banking is known in India since ancient times. It originated in our country as early as 600 B.C. References are found in the early Vedic literature of deposits, pledges, loans and rates of interest.

However, banking in those days consisted

mainly of money lending activities. Commercial banking of modern lines was started in India only during the nineteenth century. Earlier in British India, mainly the employees at the East India Company established banks and they were called the Agency Houses.

It is these ‘Agency houses’ which paved the way for the

establishment of Joint Stock Bank to be established in India. The Bank of Hindustan was the first Joint Stock Bank to be established in India under European Management. But soon it failed.

Later three Presidency Banks were started with financial position of the Government. These Banks were the Bank of Bengal, The Bank of Bombay and the Bank of Madras. The Commercial Bank was perhaps the first purely Indian Joint Stock Bank to be established in 1889. Later the Punjab National Bank in 1894 and the people Bank in 1901 were established. The Swadeshi Movement in 1905 gave a real stimulus to the development of Indian Bank. The Bank of India was started in 1906, the Indian Bank in 1907, the Bank of Baroda in 1908 and the Central Bank of India in 1911. However, the banking arises of 1913 hit hand many of the banks. In 1922 the banking industry witnessed many bank failures. It is only in recent years, such bank failures have been prevented and stability restored. In 1935, the Reserve Bank of India, which is acting as the Central Bank of our country, was established.

3.3 BANKING SYSTEM IN INDIA: The Banking system plays an important role in the economic development of the country. Indian Banking system is characterized by the present of wide variety of VVN College Page

34 |


RATIO ANALYSIS TECHNIQUE IN 2008-

09

institutions. At the top of the banking systems there is the Reserve Bank of India which is the Central Bank of our country. There are 28 Public Sector Banks in India. The Banking scene is dominated by Public Sector Banking. Nearly the Public Sector Banking controls 25% of banking resources of the country.

Two more apex

institutions in the field of agriculture and exports respectively have also been established. They are:THE NABARD (National Bank for Agriculture and Rural Development) and EXIM Bank (Export Import Bank of India). In the sphere of Industrial Finance, we have specialized financial institutions such as IFCI, IBRD, ICICI, SFC and SDC. Agriculture finance is provided by Co-operative Banks and Regional Rural Banks.

3.4 CLASSIFICATION OF BANKS: The banking institutions form an indispensable part in a modern development society. They perform varied functions to meet various sections of the Society. On the basis of the functions performed the banks can be classified into the following types. Commercial Banks, Co-operative Banks, Land Development Banks, Central Banks, Savings Banks, Investment Banks or Industrial Banks, Exchange Banks.

3.5 PROFILE OF THE COMPANY 3.5.1GENERAL HISTORY OF VIJAYA BANK: Vijaya bank(VB) came into existence in 15th April 1980,as a consequence of the Government of India taking over the undertaking of Vijaya Bank Ltd. The bank is engaged in transacts all types of banking business including foreign exchange. The bank has strong presence in the fast growing southern states. Its business activities are diversified and encompass merchant banking, credit cards, ATMs, Housing finance, fast collection services etc. The Bank has sponsored its first Regional Rural Bank in the year 1985 under the name and style Visweswaraya Grameena Bank in March. This Regional Rural Bank cater the needs of the target group belonging to Mandya district of Karnataka VVN College Page

35 |


RATIO ANALYSIS TECHNIQUE IN 2008-

09

state. VB introduced the Novell scheme under the name of ’Vijaya Vichar Vihar’ in the year 1989. During the year1992, the bank had introduced automatic renewal facility up to four times in respect of short-term deposits accepted for periods from forty-six days to one year for the convenience of the customers.

VB had entered into the Memorandum of Understanding (MoU) with the Reserve Bank of India in the year of 1994 to fulfill definite performance commitments. Also in the same year of 1994, the bank introduced the new scheme viz. Vijaya Bank Bond Scheme and Vijaya Service Card for enlarging its services to its business clientele. The Bank opened its third exclusive NRI branch at Mapuca(Goa) and established social NRI vells at the branches in Tiruvalla, Kottayam, Trivandraum and Kozhencherry(all in Kerala State). During the year 1995, Vb has opened 33 new branches and also the bank opened five Hi-tech Finance branches at Bangalore, Coimbatore, Delhi, Hyderabad and Lucknow. In the identical year of 1995,the has entered into an agreement with M/sOrential Exchange Co., WLL Manama, Bahrain providing for the Bank’s participation in the said exchange company’s day-to-day management. Vijaya Bank launched a fully operational Custodual Services Division at Mumbai. In the year 1996, VB had opened its first subsidiary, Vibank Housing Finance Limited to add impetus to housing finance. Vijaya bank introduced three new loan schemes, namely, ‘Vijaya Nivruthi’, Vijaya Krishi Vikas’ and ‘Vijaya Mangala’ to cater to the credit needs of pensioners, farmers and workingwomen respectively. The Bank has also entered into tie-up arrangements with ICICI, banking service called ‘Any Branch Banking’ in the same year 1996. During the year 1997, Vijaya Bank had launched a special agriculture credit plan targeted specifically at agriculture and other, rural advances. The Bank also launched the ‘special loan recovery motivation scheme’, which helped reduce the level of NPAs from 11.6percent to 9.6 percent. The bank had entered into domestic correspondent banking arrangements with various private sector banks and freign banks during the year 1998. After a year, in 1999. Vijaya bank had entered into rs200cr take out financing arrangement with the housing and urban development VVN College Page

36 |


RATIO ANALYSIS TECHNIQUE IN 2008-

09

corporation (hudco) for funding in fracture projects. In the year2000 VB had introduced new scheme named V-star savings bank account scheme VB taped the capital market with initial public offering in the year2000 the bank has signed a pact with lic in2003 to offer life insurance cover to all its existing as well as its new deposit-holders. VB had unveiled a new electronic fund remitence facility called Vremit, under which the bank consumers can electronically remit funds to the account holders in any bank . The MoU was signed with m|s national insurance company limited in year 2033 for marketing banc assurance products bank as decided to amalgament its own subsidiary VIBANK housing finance limited (VHFL ) with vijaya bank .Vijaya bank has opened a kiosk that is exclusively for retail lending at its Ashokanagar branch in Mangalore and signed the MoU with Punjab National Bank and Principal Financial Group of USA for a joint venture participation in Asset management Company. In the year 2004,the bank made tie-up with NIC to offer free insurance policy. Punjab National Bank(PNB) and VB had entered into a four-way partnership with with Principal Financial of the US and Berger Paints to set up an insurance braking company.Vibank Finance Ltd became a wholly owned subsidiary of the bank in the identical year of 2004.

The Bank signed a pact with Nabard to co-finance agriculture, agro processing, hi-tech agriculture and rural development projects. Vijaya Bank launched the bank’s second city specific credit card-the’ Hyderabad Card’. During the year 2005, the bank made tie-up wiyh TAFE. In the year 2006-07, the bank implemented the Crore Banking Solution(CBS) in additional 152 branches. VB opened 43 new branches, upgraded 10 extension counters into full-fledged branches, converted 2 regional foreign exchanges into full-fledged overseas branches and also converted one capital market services branch into a general banking branch in the year 2006-07. The bank had helped 11061 self help groups in the same year by the way of loan disbursement. In June of the year 2007, VB had inked a memorandum of understanding (MoU) with credit rating agency ICRA, under which ICRA will assign ratings to small scale industries (SSIs) and small and medium enterprises (SMEs) that VVN College Page

37 |


RATIO ANALYSIS TECHNIQUE IN 2008-

09

are borrowers of the bank. As of April 2008, signed a memorandum of understanding with Fitch ratings India to provide bank loan ratings to its corporate clients at a normal fee. Vijaya Bank plans to focus on farm and retail lending to push up business.

BREIF HISTORY: Vijaya Bank was established on 23rd October 1931 by late Shri A.B.Shetty and other enterprising farmers in Mangalore, Karnataka. The objective behind establishment of the Bank was essentially to promote banking habit, thrift and entrepreneurship among the farming community of Dakshina Kannada district in Karnataka State. The bank became a scheduled bank in 1958. During 1963-68, nine smaller banks merged with Vijaya Bank and the Bank steadily grew into a large All India bank. Vijaya Bank was nationalized on April 15, 1980 and today the Bank has a network of 913 branches that span all 28 states and 3 union territories in the country. Vijay Bank has been constantly focusing on technological up gradation. As on October 2005, all the 913 branches have been computerized, covering 97% of the bank's total business. The Bank has diversified into new areas such as credit card, merchant banking, hire purchase and leasing, and electronic remittance services. Vijaya Bank is one of the few banks in the country to take up principal membership of VISA International and MasterCard I.

3.5.2 NATURE OF OPERATIONS: Each branch provides effective and efficient services and significantly contributes to the growth of the individual, and the nation. Vijaya Bank is one among the few banks in the country to take up principal membership of VISA International and MasterCard International.

VVN College Page

38 |


RATIO ANALYSIS TECHNIQUE IN 2008-

09

3.5.3 MANAGEMENT: Today, living up to the ideals of the visionaries of the bank, the management includes dedicated professionals, who bring with them a considerable amount of expertise and experience in the banking industry. Organization structure The Bank has a three tier Organisation structure. Head Office, Regional Office and Branches. The Head office hosts various functional departments that are instrumental in policy formulations and monitoring of performances of the regions and branches. The bank's 20 Regional Offices exercise immediate supervision and control over the branches under their jurisdiction. Directors

(Position - 03.03.2009)

Currently, the Bank's board of directors consists of : 1. Shri. Albert Tauro, Chairman & Managing Director 2. Shri. S.C. Kalia, Executive Director 3. Shri. G.B.Singh, Govt. Nominee Director. 4. Shri. K. Venkatappa, RBI Nominee Director. 5. Shri. P. Shantharam Shetty, Workmen Director. 6. Shri. Ranjan Shetty, Officer-employee Director 7. Shri. Brij Mohan Sharma, Non Official Director (Chartered Accountant Category) 8. Shri. Ashok Kumar Shetty, Shareholder Director. 9. Shri. Ashok Kumar, Shareholder Director. 10. Shri. Nishank Kumar Jain, Non Official Director 11. Shri. Sridhar Cherukuri, Non Official Director VVN College Page

39 |


RATIO ANALYSIS TECHNIQUE IN 2008-

09 12. Shri. S. Ananthan, Shareholder Director 13. Shri. B. Ibrahim, Non Official Director

General Managers General Managers at the Head office (Position as on 11.10.2008) 1. Shri. S. Jayaram Shetty 2. Shri. K. Shamasundara Shetty 3. Shri. K. Jayakar Shetty 4. Shri. Naveenkumar Hegde 5. Shri. J. Pandiyan 6. Shri. Shantharam Kamath 7. Shri. K. Jagajjeevan Hegde 8. Shri. Vasanth K Hegde. 9. Shri. Prakashchandra Shetty General Manager at Regional Office 1. Shri. Mohandas Shetty V 2. Smt. Chandra K

: Regional Office - Bangalore - South. : Regional Office, Chennai.

3. Shri. Vasanth Kumar Shetty G 4. Shri. Chinnobaiah H B

: Regional Office, Delhi. : Regional Office, Lucknow.

5. Shri. Prakashchandra Hegde A

: Regional Office, Mumbai.

3.5.4 VIJAYA BANK SNAPSHOT: COMPANY PROFILE

: VIJAYA BANK

TICKER

: 532401

EXCHANGES

: OTHBOM

2008 SALES

: 45,094,000,000

MAJOR INDUSTRY

: FINANCIAL

VVN College Page

40 |


RATIO ANALYSIS TECHNIQUE IN 2008-

09 SUB

: COMMERCIAL BANKS

COUNTRY

: INDIA

EMPLOYEES

: 11439

Vijaya Bank steadily grew into a large All India bank, with nine smaller banks merging with it during the 1963-68. The credit for this merger as well as growth goes to late Shri M.Sunder Ram Shetty, who was then the Chief Executive of the bank. The bank was nationalized on 15th April 1980. The bank has built a network of 1061 branches,46 Extension Counters and 337 ATMs as at 04.10.2008, that span all 28 states and 4 union territories in the country.

PRODUCT PROFILE: Internet Banking FORM NAME V-Net Banking application form V-Net Banking Requisition for Resetting Password form V-Net Funds Transfer Beneficiary Registration / Cancellation form V-Net application form for Corporate Users Individuals V-Net application form for Corporate V-Net Format of letter of Mandate for Corporate V-Net specimen for 'Board Resolution' for Corporate V-Net SMS alerts application form

Deposits / NRI Deposits: FORM NAME Deposit application form (no. 2-426) Customer Profile form (no. 2-504) Annexure Deposit application form for Non Resident Indians (NRE / FCNR / NRO) VVN College Page

41 |


RATIO ANALYSIS TECHNIQUE IN 2008-

09

Customer Profile form (no. 2-504) Annexure Application Form for opening ‘V– GenU TH’ Savings Bank Account & Add-on Credit Card

Retail Lending Schemes: FORM NAME Loan application acknowledgement form Home loan application Application under V-Equip and V – Cash Application for education loan Application for Vijaya Wheels Statement of Assets & Liabilities of Individuals - no. 26 (a) (for credit limits below Rs.10 lakhs) Statement of Assets & Liabilities of Individuals - no. 26 (b) (for credit limits of Rs. 10 lakhs & above) Credit Cards / Debit Cards Application form: FORM NAME Application for Vijaya Classic Visa/MasterCard Application for Vijaya gold Visa/MasterCard Application for ADD-ON Credit Card Application for Corporate Membership – VISA / MasterCard Credit Card Application for Vijaya International Visa Gold Cards Application for Visa Global Credit Card - for Individuals Application Visa Global Credit Card - for Corporate Application for Revolving Credit Facility for Credit Card Liability Application for Credit Card Photo card [for issue of Photo Card] VVN College Page

42 |


RATIO ANALYSIS TECHNIQUE IN 2008-

09

Application for Vijaya Global DEBIT cum ATM card [Application- DC 1] Application for Vijaya Global DEBIT cum ATM card [Annexure to DC 1]

Nomination on Deposits / Articles left in Safe Custody / SDV Lockers: FORM NAME Form for Nomination on Deposits / Articles left in Safe Custody / Safe Deposit Vaults / Lockers - 2-358 (a) Cancellation of Nomination on Deposits / Articles left in Safe Custody / Safe Deposit Vaults / Lockers - 2-358 (b) Variation of Nomination on Deposits / Articles left in Safe Custody / Safe Deposit Vaults / Lockers - 2-358 (c) Form for Nomination on Safe Deposit Vaults / Lockers by Joint Hirers - 2-258 Jt A Variation of Nomination on Safe Deposit Vaults / Locker by Joint Hirers - 2-358 Jt B Banking Ombudsman: FORM NAME Application Form for Complaint (To be lodged with the Banking Ombudsman) Application Form for arbitration to be submitted to the Banking Ombudsman Remittances: FORM NAME NRI Remittances GBP USD EURO Other Remittances

VVN College Page

43 |


RATIO ANALYSIS TECHNIQUE IN 2008-

09

National Electronic Fund Transfer application form [NEFT- 2A] Real Time Gross Settlement application form [RTGS ] Others: Loan application acknowledgement form Form No 61 Form No 60 Application for drawl of pension through a Public Sector Bank.

VVN College Page

44 |


09

VVN College Page

RATIO ANALYSIS TECHNIQUE IN 2008-

45 |


09

VVN College Page

RATIO ANALYSIS TECHNIQUE IN 2008-

46 |


09

RATIO ANALYSIS TECHNIQUE IN 2008-

CHAPTER IV

DATA ANALYSIS & INTERPRETATION

VVN College Page

47 |


RATIO ANALYSIS TECHNIQUE IN 2008-

09

DATA ANALYSIS AND INTERPRETATION 5.1 ANALYSIS OF DATA: The information collected from the balance sheet and the profit and loss account helps the management to plan the operation regarding financial debt of the firm. This data analysis helps the management to take suitable corrective measure and to enable the management to strengthen the financial position.

5.2 INTERPRETATION OF RATIO: Broadly Speaking of ratios may be interpreted in four different ways as follows: An individual ratio may have significance of own. E.g.: A Ratio of 25% of net profit on capital employed shows a satisfactory return  Ratios may be interpreted by making comparison over time; such comparisons will indicate the trend of rise, decline or stability of the profitability.  A ratio of anyone firm may be compared with ratios of other firm in the same industry. It is also known as interring firm comparison.  Ratios may be interpreted by considering a group of several related ratio.

VVN College Page

48 |


RATIO ANALYSIS TECHNIQUE IN 2008-

09

CALCULATION OF LIQUID RATIOS: CURRENT RATIO: CURRENT RATIO = CURRENT ASSETS / CURRENT LIABILITIES

TABLE NO. : 1 Particulars Rs in crores

Current assets Current liabilities

Current ratio

2005

2006

2007

2008

1614.57

2835.14

5070.12

6103.36

1487.50

1639.83

2658.18

3854.47

1.08%

1.72%

1.90%

1.58%

ANALYSIS: This ratio is a measure of the banks short term solvency. And the above calculation shows the current ratio is worth 1.08% in 2005, it increased in 2006 to 1.72% and in the year 2007 it is increased to 1.90% and in 2008 it is decreased to 1.58%.

VVN College Page

49 |


RATIO ANALYSIS TECHNIQUE IN 2008-

09

GRAPH NO. : 1 GRAPH SHOWING CURRENT RATIO:

INTERPRETATION: From the table it can be studied that there is a no fluctuation in the current ratio in 2005, 2006, and 2007 it raised till 2007 and then in 2008 it has decreased due to the increase in the % of current liabilities compared to the current assets. In 2005, 2006, 2007 it increased due to the raise in the % of current assets compared to the current liabilities. VVN College Page

50 |


RATIO ANALYSIS TECHNIQUE IN 2008-

09

CALCULATION OF CAPITAL STRUCTURE RATIOS DEBT EQUITY RATIO: DEBT EQUITY RATIO = LONG TERM DEBTS / SHAREHOLDERS FUNDS

TABLE NO. : 2 Particulars Rs in crores

2005

2006

2007

2008

640.83

515.82

198.14

1918.87

Equity shareholders

433.52

433.52

433.52

433.52

Debt equity ratio

1.08%

1.72%

1.90%

1.58%

Long term loans

ANALYSIS: The debt equity ratio in the year 2005 is 1.08% and it is increased to 1.72% in 2006 and again raise to 1.92% in the year 2007 and decreased to 1.58% in the year 2008. VVN College Page

51 |


RATIO ANALYSIS TECHNIQUE IN 2008-

09

GRAPH NO. : 2 GRAPH SHOWING DEBT EQUITY RATIO:

INTERPRETATION: The debt equity ratio reflects the relative claims of the shareholders and creditors against the assets of the company. From the table it can be observed that the

VVN College Page

52 |


RATIO ANALYSIS TECHNIQUE IN 2008-

09

ratio and the borrowed fund are increasing but the share capital remains the same from the year 2008 it as decreased to 1.58%.

PROPRIETARY RATIO: PROPRIETARY RATIO = SHAREHOLDERS FUND / TOTAL ASSETS

TABLE NO. : 3 Particulars Rs in crores Shareholder s fund

Total assets

Proprietary ratio

2005

2006

2007

2008

433.52

433.52

433.52

433.52

29340.4 5

31537.0 5

42357.5 7

56185.1 2

1.47%

1.37%

1.02%

0.77%

ANALYSIS:

VVN College Page

53 |


RATIO ANALYSIS TECHNIQUE IN 2008-

09

In the year 2005 the ratio was 1.47% and it has decreased to 1.37% in the year 2006 and has further decreased to 1.02% in the year 2007 and has further decreased to 0.77% in the year 2008.

GRAPH NO. : 3 GRAPH SHOWING PROPRIETORY RATIO:

VVN College Page

54 |


RATIO ANALYSIS TECHNIQUE IN 2008-

09

INTERPRETATION: The proprietary ratio reflects the financial strength. As the indications are decreasing from 2005-08 the creditors are at higher risk at the time of liquidation.

INTEREST COVERAGE RATIO:

VVN College Page

55 |


RATIO ANALYSIS TECHNIQUE IN 2008-

09

INTEREST COVERAGE RATIO = EARNINGS BEFORE TAX AND INTEREST (EBIT) / FIXED INTEREST CHARGES

TABLE NO. : 4 Particulars Rs in crores

2005

2006

2007

2008

EBIT

372.82

179.46

347.75

277.59

Fixed interest charges

1109.77

1339.02

1751.16

3058.42

Interest coverage ratio

0.33%

0.13%

0.19%

0.09%

ANALYSIS: In the year 2005 it was 0.33% then in the year 2006 it was decreased to 0.13% and in the year 2007 it was slight increased to 0.19% but in the year 2008 it was drastically reduced to 0.09%.

VVN College Page

56 |


RATIO ANALYSIS TECHNIQUE IN 2008-

09

GRAPH NO. : 4 GRAPH SHOWING INTEREST COVERAGE RATIO:

INTERPRETATION: The interest coverage ratio is declined because EBIT and fixed assets are decreased in the 2005-06 and it was increased in the year 2006-07 and further it was declined in 2007-2008.

VVN College Page

57 |


RATIO ANALYSIS TECHNIQUE IN 2008-

09

DEBT TO TOTAL FUNDS RATIO: DEBT TO TOTAL FUNDS RATIO = DEBTS / TOTAL FUNDS

TABLE NO. : 5 Particular s Rs in crores

2005

2006

2007

2008

Debts

26692.3 3

28658.6 3

38236.1 6

50304.4

Total funds

29335.4 9

31534.1 0

42357.5 0

56184.3 0

0.90%

0.90%

0.90%

0.89%

Debt to total funds ratio

ANALYSIS: In the year 2005, it was 0.90% and in the year 2006 the ratio is same 0.90% and in the year 2007 the ratio is again same 0.90%. But in the year 2008 a small amount of ratio is declined to 0.89%.

VVN College Page

58 |


RATIO ANALYSIS TECHNIQUE IN 2008-

09

GRAPH NO. : 5 GRAPH SHOWING DEBT TO TOTAL FUNDS RATIO:

INTERPRETATION: The debt equity ratio shows the relationship between the debts and total funds employed in the business or organization. In this the ratio was constant from the year 2005 – 07. After 2007 it was declined to a small amount of percentage in 2008.

VVN College Page

59 |


RATIO ANALYSIS TECHNIQUE IN 2008-

09

CALCULATIONS OF PROFITABILITY RATIOS GROSS PROFIT RATIO: GROSS PROFIT RATIO = GROSS PROFIT / NET SALES X 100

TABLE NO. : 6 Particulars Rs in crores

2005

2006

2007

2008

Gross profit

1482.59

1518.48

2098.91

3336.01

Net sales

2094.31

2311.80

2823.11

3983.42

Gross profit ratio

70.79%

65.68%

74.34%

83.74%

ANALYSIS: In the year 2005, the ratio of gross profit is 70.79% and it was declined to 65.68% in 2006 and it was increased to 74.34% in 2007 and further it was increased to 83.74% in 2008.

VVN College Page

60 |


RATIO ANALYSIS TECHNIQUE IN 2008-

09

GRAPH NO. : 6 GRAPH SHOWING GROSS PROFIT RATIO:

INTERPRETATION: This ratio expresses the relationship between gross profit and sales. In this ratio it is having some fluctuations. In 2005 it was in 70.79% and declined then it has brought up to the 83.74% in the year 2008.

VVN College Page

61 |


RATIO ANALYSIS TECHNIQUE IN 2008-

09

NET PROFIT RATIO: NET PROFIT RATIO = NET PROFIT / NET SALES X 100

TABLE NO. : 7 Particulars Rs in crores

2005

2006

2007

2008

Net profit

380.57

126.88

331.34

361.28

Net sales

2094.31

2311.80

2823.11

3983.42

Net profit ratio

18.17%

5.48%

11.73%

9.06%

ANALYSIS: In the year 2005, the ratio of net profit was 18.17% and it was declined to 5.48% in 2006 and it was increased to 11.73% in 2007 and it was declined to 9.06% in 2008.

VVN College Page

62 |


RATIO ANALYSIS TECHNIQUE IN 2008-

09

GRAPH NO. : 7 GRAPH SHOWING NET PROFIT RATIO:

INTERPRETATION: This is the ratio of net profit to net sales. From 2005–08 it was fully fluctuated. In the year 2005 it was 18.17% and in the year 2008 it was 9.06% means it reduces a lot. It shows the Net profit position of the bank.

VVN College Page

63 |


RATIO ANALYSIS TECHNIQUE IN 2008-

09

OPERATING RATIO: OPERATING RATIO = COST OF GOODS SOLD + OPERATING EXPENCES / NET SALES X 100 Cost of goods sold

= Sales – Gross profit

Operating expenses = Selling expenses + Administration expenses

TABLE NO. : 8 Particulars Rs in crores Cost of goods sold + Operating expenses

2005

2006

2007

2008

1336.13

1543.62

1495.6

1449.25

Net sales

2094.31

2311.80

2823.11

3983.42

Operating ratio

63.79%

66.77%

52.97%

36.38%

ANALYSIS:

VVN College Page

64 |


RATIO ANALYSIS TECHNIQUE IN 2008-

09

In the year 2005, the ratio of operating ratio was 63.79% and it was increased to 66.77% in the year 2006 and it was further declined to 59.97% in 2007 and it was declined to 36.38% in 2008.

GRAPH NO. : 8 GRAPH SHOWING OPERATING RATIO:

INTERPRETATION:

VVN College Page

65 |


RATIO ANALYSIS TECHNIQUE IN 2008-

09

This ratio explains the changes in profit margin; it indicates the average variations in expenses. Operating ratio in 2005 was 63.79% which is low compared with the year 2007. The operating ratio is reduces in the year 2008 and 2009. Because unfavorable margin that fluctuates the all Administration expenses and selling and distribution expenses.

OPERATING PROFIT RATIO: OPERATING PROFIT RATIO = OPERATING NET PROFIT / NET SALES X 100

TABLE NO. : 9 Particulars Rs in crores

2005

2006

2007

2008

Operating net profit

640.13

569.79

621.31

545.56

Net sales

2094.31

2311.80

2823.11

3983.42

Operating profit ratio

30.56%

24.64%

22.00%

13.69%

ANALYSIS: VVN College Page

66 |


RATIO ANALYSIS TECHNIQUE IN 2008-

09

In the year 2005, the ratio of operating profit ratio was 30.56% and it was declined to 24.64% in the year 2006 and it was declined to 22.00% and further it was declined to 13.69% in 2008.

GRAPH NO. : 9 GRAPH SHOWING OPERATING PROFIT RATIO:

VVN College Page

67 |


RATIO ANALYSIS TECHNIQUE IN 2008-

09

INTERPRETATION: This ratio explains the changes in profit margin as same as operating ratio, it was 30.56% in 2005 and later on weaker in to 13.69%. It was not a good sign for bank strength.

RETURN ON INVESTMENT (ROI): RETURN ON INVESTMENT = NET PROFIT BEFORE INTEREST AND TAXES / TOTAL CAPITAL EMPLOYED X 100

TABLE NO. : 10 Particulars Rs in crores Net profit before interest And taxes Total capital employed

VVN College Page

2005

2006

2007

2008

380.57

126.88

288.94

355.91

31537.05

42357.57

56185.12

29340.45

68 |


RATIO ANALYSIS TECHNIQUE IN 2008-

09

Return on investments

1.29%

0.40%

0.68%

0.63%

ANALYSIS: In the year 2005, the ratio of Return on Investment (ROI) was 1.29% and it was declined to 0.40% in the year 2006 and it was increased to 0.68% in 2007 and it was further declined to 0.63% in 2008.

GRAPH NO. : 10 GRAPH SHOWING RETURN ON INVESTMENT:

VVN College Page

69 |


RATIO ANALYSIS TECHNIQUE IN 2008-

09

INTERPRETATION: ROI measures the overall profitability. It measures satisfactorily the overall performance of a business from a point of view of profitability. It indicates how well the management has utilized the funds supplied by the owners and creditors. The ROI ratio in first year is very low which indicates the inefficiency of management but in 2006-08 the ratio gradually declined to 0.40%, 0.68% & 0.63% respectively. This indicates the performance efficiency of the firm.

RETURN ON EQUITY CAPITAL:

VVN College Page

70 |


RATIO ANALYSIS TECHNIQUE IN 2008-

09

RETURN ON EQUITY CAPITAL = NET PROFIT AFTER TAX AND PERFERENCE DIVIDEND / EQUITY SHAREHOLDERS FUNDS X 100 TABLE NO. : 11 Particulars Rs in crores Net profit after tax and preference dividend

2005

2006

2007

2008

380.57

126.88

331.34

361.28

Equity shareholders fund

433.52

433.52

433.52

433.52

Return on equity capital

87.78%

29.26%

76.43%

83.33%

ANALYSIS: In the year 2005, the ratio of Return on Equity capital was 87.78% and it was declined to 29.26% in the year 2006 and it was increased to 76.43% in 2007 and it was further increased to 83.33% in 2008.

VVN College Page

71 |


RATIO ANALYSIS TECHNIQUE IN 2008-

09

GRAPH NO. : 11 GRAPH SHOWING RETURN ON EQUITY CAPITAL:

INTERPRETATION: This ratio establishes the relationship between the net profit available to equity shareholders and the amount of capital invested by them. It was high signal in 2005 then it falls low in 2006 later it gradually moves up to some extent in 2007 and also in 2008, 87.78%, 29.26%,76.43% and 83.33% respectively.

VVN College Page

72 |


RATIO ANALYSIS TECHNIQUE IN 2008-

09

EARNING PER SHARE: EARNING PER SHARE = NET PROFIT AFTER TAX – PREFERENCE DIVIDEND / NO. OF EQUITY SHARE.

TABLE NO. : 12 Particulars Rs in crores Net profit after tax – preference dividend No. of equity share Earnings per share

2005

2006

2007

2008

380.57

126.88

331.34

361.28

433.52

433.52

433.52

433.52

8.78%

2.98%

7.64%

8.33%

ANALYSIS: In the year 2005, the ratio of Earning per share was 8.78% and it was declined to 2.98% in the year 2006 and it was increased to 7.64% in the year 2007 and it was further increased to 0.63% in 2008.

VVN College Page

73 |


RATIO ANALYSIS TECHNIQUE IN 2008-

09

GRAPH NO. : 12 GRAPH SHOWING EARNING PER RATIO:

INTERPRETATION: This ratio measures the earning per equity share i.e., it measures the profitability of the firm on a per share basis.In this ratio the earnings per share is high and later it falls very downwards and then it comes upwards in running 2 year. It shows the standard of the bank capacity and share value.

VVN College Page

74 |


RATIO ANALYSIS TECHNIQUE IN 2008-

09

PRICE EARNING RATIO: PRICE EARNING RATIO = MARKET PRICE PER EQUITY SHARE / EARNING PER SHARE

TABLE NO. : 13 Particulars Rs in crores Market price per equity share Earnings per share Price earnings ratio

2005

2006

2007

2008

64.30

52.55

42.50

49.65

8.78

2.93

7.64

8.33

7.32%

17.93%

5.56%

5.96%

ANALYSIS: In the year 2005, the ratio of Price earnings ratio was 7.32% and it was increased to 17.93% in the year 2006 and it was declined to 5.56% in the year 2007 and it was further increased to 5.96% in 2008.

VVN College Page

75 |


RATIO ANALYSIS TECHNIQUE IN 2008-

09

GRAPH NO. : 13 GRAPH SHOWING PRICE EARNING RATIO:

INTERPRETATION: This ratio is the market price of shares expressed as multiple of earning per share (EPS). It also shows the face value of the share. In the ratio the price earning ratio was at upwards in 2006 comparing with the remaining two years, gradually it decreases or declined high in 2008. It shows the company value and shares values.

VVN College Page

76 |


RATIO ANALYSIS TECHNIQUE IN 2008-

09

COST OF GOODS SOLD RATIO: COST OF GOODS SOLD RATIO = COST OF GOODS SOLD / NET SALES X 100

TABLE NO. : 14 Particulars Rs in crores

2005

2006

2007

2008

Cost of goods sold

611.72

793.32

794.2

647.41

Net sales

2094.31

2311.80

2823.11

3983.42

Cost of goods sold ratio

29.20%

34.31%

25.65%

16.25%

ANALYSIS: In the year 2005, the ratio of Cost of goods sold was 29.20% and it was increased to 34.31% in the year 2006 and it was declined to 25.65% in 2007 and it was further declined to 16.25% in 2008.

VVN College Page

77 |


RATIO ANALYSIS TECHNIQUE IN 2008-

09

GRAPH NO. : 14 GRAPH SHOWING COST OF GOODS SOLD RATIO:

INTERPRETATION: The ratio explains the cost of goods sold in the organization, in banking sector it has some importance. Normally this type ratio is works in other sectors. In this ratio it was had so many fluctuations in 2005 it was 29.20% and falls in to 16.25% at 2008.

VVN College Page

78 |


RATIO ANALYSIS TECHNIQUE IN 2008-

09

ADMINISTRATION OVERHEAD RATIO: ADMINISTRATION OVERHEAD RATIO = ADMINISTRATION OVERHEAD / NET SALES X 100

TABLE NO. : 15 Particulars Rs in crores

2005

2006

2007

2008

Administratio n overhead

96.04

108.04

120.60

145.38

2094.3 1

2311.8 0

2823.1 1

3983.42

4.58%

4.67%

4.27%

3.64%

Net sales Administratio n overhead ratio

ANALYSIS: In the year 2005, the ratio of Administration overhead was 4.58% and it was increased to 4.67% in the year 2006 and it was declined to 4.27% in 2007 and it was further declined to 3.64% in 2008.

VVN College Page

79 |


RATIO ANALYSIS TECHNIQUE IN 2008-

09

GRAPH NO. : 15 GRAPH SHOWING ADMINISTRATION OVERHEAD RATIO:

INTERPRETATION: This ratio explains the administration over head expenses by this we can calculate the cost of production, in this ratio it was at 4.58% in 2005 and it moves VVN College Page

80 |


RATIO ANALYSIS TECHNIQUE IN 2008-

09

upwards and falls down towards 3.64% in 2008. It shows the administration overhead ratio in bank.

SELLING OVERHEAD RATIO: SELLING OVERHEAD RATIO = SELLING OVERHEAD / NET SALES X 100 TABLE NO. : 16 Particulars Rs in crores

2005

2006

2007

2008

Selling overhead

169.02

117.86

113.56

93.62

Net sales

2094.31

2311.80

2823.11

3983.42

Selling overhead ratio

8.07%

5.09%

4.02%

2.35%

ANALYSIS:

VVN College Page

81 |


RATIO ANALYSIS TECHNIQUE IN 2008-

09

In the year 2005, the ratio of selling overhead expenses was 8.07% and it was declined to 5.09% in the year 2006 and it was declined to 4.02% in 2007 and it was further declined to 2.35% in 2008.

GRAPH NO. : 16 GRAPH SHOWING SELLING OVERHEAD RATIO:

VVN College Page

82 |


RATIO ANALYSIS TECHNIQUE IN 2008-

09

INTERPRETATION: This ratio explains the selling overhead ratio which shows the clean picture and position of the bank. As per this four years from 2005 – 08, the ratio of selling overhead was in 8.07% it falls very high in ratio compare with 2005. It was not a good sign of the bank position.

VVN College Page

83 |


09

RATIO ANALYSIS TECHNIQUE IN 2008-

CHAPTER V SUMMARY OF FINDINGS & SUGGESTIONS

VVN College Page

84 |


RATIO ANALYSIS TECHNIQUE IN 2008-

09

5.1 SUMMARY OF FINDINGS: •

This ratio is a measure of the banks short term solvency. And the above calculation shows the current ratio is worth 1.08% in 2005, it increased in 2006 to 1.72% and in the year 2007 it is increased to 1.90% and in 2008 it is decreased to 1.58%.

The debt equity ratio in the year 2005 is 1.08% and it is increased to 1.72% in 2006 and again raise to 1.92% in the year 2007 and decreased to 1.58% in the year 2008.

In the year 2005 the ratio was 1.47% and it has decreased to 1.37% in the year 2006 and has further decreased to 1.02% in the year 2007 and has further decreased to 0.77% in the year 2008.

In the year 2005 it was 0.33% then in the year 2006 it was decreased to 0.13% and in the year 2007 it was slight increased to 0.19% but in the year 2008 it was drastically reduced to 0.09%.

In the year 2005, it was 0.90% and in the year 2006 the ratio is same 0.90% and in the year 2007 the ratio is again same 0.90%. But in the year 2008 a small amount of ratio is declined to 0.89%.

In the year 2005, the ratio of gross profit is 70.79% and it was declined to 65.68% in 2006 and it was increased to 74.34% in 2007 and further it was increased to 83.74% in 2008.

In the year 2005, the ratio of net profit was 18.17% and it was declined to 5.48% in 2006 and it was increased to 11.73% in 2007 and it was declined to 9.06% in 2008.

In the year 2005, the ratio of operating ratio was 63.79% and it was increased to 66.77% in the year 2006 and it was further declined to 59.97% in 2007 and it was declined to 36.38% in 2008.

In the year 2005, the ratio of operating profit ratio was 30.56% and it was declined to 24.64% in the year 2006 and it was declined to 22.00% and further it was declined to 13.69% in 2008.

VVN College Page

85 |


RATIO ANALYSIS TECHNIQUE IN 2008-

09 •

In the year 2005, the ratio of Return on Investment (ROI) was 1.29% and it was declined to 0.40% in the year 2006 and it was increased to 0.68% in 2007 and it was further declined to 0.63% in 2008.

In the year 2005, the ratio of Return on Equity capital was 87.78% and it was declined to 29.26% in the year 2006 and it was increased to 76.43% in 2007 and it was further increased to 83.33% in 2008.

In the year 2005, the ratio of Earning per share was 8.78% and it was declined to 2.98% in the year 2006 and it was increased to 7.64% in the year 2007 and it was further increased to 0.63% in 2008.

In the year 2005, the ratio of Price earnings ratio was 7.32% and it was increased to 17.93% in the year 2006 and it was declined to 5.56% in the year 2007 and it was further increased to 5.96% in 2008.

In the year 2005, the ratio of Cost of goods sold was 29.20% and it was increased to 34.31% in the year 2006 and it was declined to 25.65% in 2007 and it was further declined to 16.25% in 2008.

In the year 2005, the ratio of Administration overhead was 4.58% and it was increased to 4.67% in the year 2006 and it was declined to 4.27% in 2007 and it was further declined to 3.64% in 2008.

In the year 2005, the ratio of selling overhead expenses was 8.07% and it was declined to 5.09% in the year 2006 and it was declined to 4.02% in 2007 and it was further declined to 2.35% in 2008.

VVN College Page

86 |


RATIO ANALYSIS TECHNIQUE IN 2008-

09

5.2 SUGGESTIONS: •

The bank need to maintain consistency in current ratio and suggested to maintain enough current assets to meet its short term obligation and see that ideal current ratio is to be maintained.

It is here by suggested to maintain a constant liquidity position by their bank to meet their long term obligation in time.

It is here by suggested to keep up to earning per share as stable as possible at any point of time it should not go to the deep decrease in its value.

Bank’s Net profit has been decreased. So certain measures should be taken for the proper employment of funds

Deposits schemes must be made more attractive in order to attract newer and fresh deposits.

The borrowings made from the outside source should be reduced further.

If the bank has to attract more customers and deal with more transactions, the bank can provide advances and loans to the general public for the following purpose1.

Housing loans or land purchase

2.

Loans to small scale industries and cottage industries.

3.

Loans to self-employed person or young entrepreneurs

4.

Short term, medium term and long term loans to the farmers for installing pump sets or digging of bore wells.

5.

Increase short term deposits and long term deposits by providing higher rate of interest.

6.

The paid up capital may also be enhanced

7.

Providing loans to farmer at lower rate of interest.

VVN College Page

87 |


09

RATIO ANALYSIS TECHNIQUE IN 2008-

CHAPTER VI

BIBILOGRAPHY

VVN College Page

88 |


RATIO ANALYSIS TECHNIQUE IN 2008-

09

BIBILOGRAPHY 6.1 BOOKS  Management accounting - M.N.Arora  Financial management – Reddy Appannaih, Sathya Prasad  Management accounting – B.S.Raman  Financial management – I.M.Panday

6.2 WEBSITE VISITED  www.moneycontrol.com  www.vijayabank.com  www.yahoofinance.com  www.rbi.org.in  www.bussinessstandard.com

6.3 REPORTS  Balance sheets, P/L account and Key financial ratios from stock exchange.  Annual reports of VIJAYA BANK.

VVN College Page

89 |


09

RATIO ANALYSIS TECHNIQUE IN 2008-

ANNEXURE

VVN College Page

90 |


RATIO ANALYSIS TECHNIQUE IN 2008-

09

Balance Sheet

------------------- in Rs. Cr. ------------------Mar '04

Mar '05

Mar '06

Mar '07

Mar '08

12 mths

12 mths

12 mths

12 mths

12 mths

Total Share Capital

433.52

433.52

433.52

433.52

433.52

Equity Share Capital

433.52

433.52

433.52

433.52

433.52

Share Application Money

0.00

0.00

0.00

0.00

0.00

Preference Share Capital

0.00

0.00

0.00

0.00

0.00

844.62

1,102.64

1,186.62

1,417.81

1,672.89

57.40

53.02

49.02

45.35

352.64

Net Worth

1,335.54

1,589.18

1,669.16

1,896.68

2,459.05

Deposits

21,015.0 5

25,617.98

27,709.29

37,604.50

47,952.01

336.65

640.83

515.82

198.14

1,918.87

Total Debt

21,351.7 0

26,258.81

28,225.11

37,802.64

49,870.88

Other Liabilities & Provisions

1,383.78

1,487.50

1,639.83

2,658.18

3,854.37

Total Liabilities

24,071.0 2

29,335.49

31,534.10

42,357.50

56,184.30

Mar '04

Mar '05

Mar '06

Mar '07

Mar '08

12 mths

12 mths

12 mths

12 mths

12 mths

Cash & Balances with RBI

875.57

1,282.11

2,248.64

3,399.71

5,661.55

Balance with Banks, Money at Call

242.99

332.46

586.50

1,670.41

435.81

11,045.3

14,335.78

16,664.01

24,223.55

31,689.22

Capital and Liabilities:

Reserves Revaluation Reserves

Borrowings

Assets

Advances

VVN College Page

91 |


RATIO ANALYSIS TECHNIQUE IN 2008-

09 1 Investments

10,836.9 9

12,068.74

11,179.70

12,018.41

16,617.32

Gross Block

442.03

506.48

554.51

541.24

907.88

Accumulated Depreciation

250.76

288.84

352.02

355.06

400.06

Net Block

191.27

217.64

202.49

186.18

507.82

0.00

0.00

0.00

0.00

0.00

Other Assets

878.88

1,098.76

652.75

859.23

1,272.59

Total Assets

24,071.0 1

29,335.49

31,534.09

42,357.49

56,184.31

Contingent Liabilities

5,475.89

8,117.84

8,378.34

8,344.96

11,341.68

Bills for collection

1,813.65

1,700.65

1,479.54

1,488.92

2,120.04

29.48

35.43

37.37

42.70

48.59

Capital Work In Progress

Book Value (Rs)

Profit & Loss account

------------------- in Rs. Cr. ------------------Mar '04

Mar '05

Mar '06

Mar '07

Mar '08

12 mths

12 mths

12 mths

12 mths

12 mths

1,940.0 9

2,094.31

2,311.80

2,823.11

3,983.41

Other Income

525.69

353.67

368.99

336.70

532.03

Total Income

2,465.7 8

2,447.98

2,680.79

3,159.81

4,515.44

Interest expended

1,102.3 2

1,109.78

1,339.02

1,751.16

3,058.42

Employee Cost

331.59

318.82

378.84

392.14

404.92

Selling and Admin Expenses

323.26

265.06

225.90

234.16

239.00

25.12

40.05

39.95

40.13

30.80

287.38

333.71

570.21

453.28

426.40

0.00

0.00

0.00

0.00

0.00

748.92

724.41

750.30

771.40

801.84

Provisions & Contingencies

218.43

233.23

464.60

348.31

299.28

Total Expenses

2,069.6 7

2,067.42

2,553.92

2,870.87

4,159.54

Mar '04

Mar '05

Mar '06

Mar '07

Mar '08

Income Interest Earned

Expenditure

Depreciation Miscellaneous Expenses Preoperative Exp Capitalised Operating Expenses

VVN College Page

92 |


RATIO ANALYSIS TECHNIQUE IN 2008-

09 12 mths

12 mths

12 mths

12 mths

12 mths

Net Profit for the Year

396.11

380.57

126.88

288.94

355.91

Extraordionary Items

15.20

0.00

0.00

42.40

5.37

Profit brought forward

150.36

104.58

240.77

493.04

606.13

Total

561.67

485.15

367.65

824.38

967.41

0.00

0.00

0.00

0.00

0.00

122.27

122.54

49.43

100.15

101.44

0.00

0.00

0.00

0.00

0.00

9.14

8.78

2.93

6.67

8.21

Equity Dividend (%)

25.00

25.00

10.00

20.00

20.00

Book Value (Rs)

29.48

35.43

37.37

42.70

48.59

334.82

129.84

-174.82

102.84

115.32

0.00

0.00

0.00

10.51

-0.05

Proposed Dividend/Transfer to Govt

122.27

122.54

49.43

100.15

101.44

Balance c/f to Balance Sheet

104.58

232.77

493.04

610.89

750.69

Total

561.67

485.15

367.65

824.39

967.40

Preference Dividend Equity Dividend Corporate Dividend Tax Per share data (annualised) Earning Per Share (Rs)

Appropriations Transfer to Statutory Reserves Transfer to Other Reserves

Yearly Results

------------------- in Rs. Cr. ------------------Mar '04

Mar '05

Mar '06

Mar '07

Mar '08

1,940.09

2,094.31

2,311.80

2,823.11

3,983.42

Other Income

525.69

353.67

368.99

274.79

437.15

Total Income

2,465.78

2,447.98

2,680.79

3,097.90

4,420.57

Total Expenses

810.71

965.39

1,162.31

998.99

1,084.56

Operating Profit

1,129.38

1,128.92

1,149.49

1,824.12

2,898.86

Profit On Sale Of Assets

--

--

--

--

--

Profit On Sale Of Investments

--

--

--

--

--

Gain/Loss On Foreign Exchange

--

--

--

--

--

VRS Adjustment

--

--

--

--

--

Other Extraordinary Income/Expenses

--

--

--

--

--

Total Extraordinary Income/Expenses

--

--

--

--

--

Tax On Extraordinary Items

--

--

--

--

--

Sales Turnover

VVN College Page

93 |


RATIO ANALYSIS TECHNIQUE IN 2008-

09 Net Extra Ordinary Income/Expenses

--

--

--

--

--

Gross Profit

1,655.07

1,482.59

1,518.48

2,098.91

3,336.01

Interest

1,102.32

1,109.77

1,339.02

1,751.16

3,058.42

552.75

372.82

179.46

347.75

277.59

Depreciation

--

--

--

--

--

Depreciation On Revaluation Of Assets

--

--

--

--

--

PBT

552.75

372.82

179.46

347.75

277.59

Tax

141.44

-7.75

52.58

16.41

-83.69

Net Profit

411.31

380.57

126.88

331.34

361.28

Prior Years Income/Expenses

--

--

--

--

--

Depreciation for Previous Years Written Back/ Provided

--

--

--

--

--

Dividend

--

--

--

--

--

Dividend Tax

--

--

--

--

--

Dividend (%)

--

--

--

--

--

9.49

8.78

2.93

7.64

8.33

--

--

--

--

--

Equity

433.52

433.52

433.52

433.52

433.52

Reserves

844.62

1,102.64

1,236.05

1,186.62

1,672.89

10.00

10.00

10.00

10.00

10.00

PBDT

Earnings Per Share Book Value

Face Value

VVN College Page

94 |


Issuu converts static files into: digital portfolios, online yearbooks, online catalogs, digital photo albums and more. Sign up and create your flipbook.