

director’s
WELCOME

We at CESTA take special pride in our Undergraduate Research Internship program, through which humanities faculty and senior researchers work on collaborative project teams with students from all across campus. We are grateful that, despite the pandemic, these transgenerational collaborations have continued to thrive—as reflected in this year’s CESTA Anthology, which describes our research projects from the point of view of our 2021 undergraduate students.
Our undergraduate researchers faced unique challenges during this time of uncertainty. What was to be a Virtual Summer of remote collaboration became a Virtual Year, and yet our students adapted and produced extraordinary work. In-person meetings this Autumn have been immensely touching, bringing together project members who had previously only worked together virtually. Although we were fortunate to be able to advance exciting research agendas on-screen, we missed the materiality of our human connections. The design of this year’s Anthology, centered on doodles, speaks to this craving for the in-person and the handmade—for engagement that takes place off-screen.
It’s hard to convey just how much effort, energy and creativity has gone into CESTA’s work this year. We are grateful for our resilient community of students and faculty, and also to the tremendous staff that sustained us in 2021: Amanda Wilson-Bergado, Daniel Bush and Erik Steiner, who were joined for the Internship program by graduate mentors. A team of graduates and postdocs worked tirelessly on this Anthology through the Autumn. More than ever we wish to thank the Dean of Research, the Vice Provost for Undergraduate Education, the H&S Dean’s Office, the Stanford Humanities Center, and our generous donors, all of whose support is critical to everything that we do. Please enjoy the pages that follow, which tell the story of what we do here at CESTA in our brilliant students’ words.
The 2020-21 academic year was truly unprecedented. We started online courses in March 2020 and continued our scholarship, teaching, and research virtually from locations across the globe. From Stanford, Virginia, Arizona, New Jersey, and Turkey, the graduate mentor team collaborated across time zones and digital platforms to help bright CESTA interns transform ideas into reality.
note from the MENTOR TEAM

Merve: When I joined the CESTA team as a graduate mentor in Spring Quarter 2021, I was not sure what to expect. I knew only a handful of the interns and had only a rough idea about the research projects. During spring and summer, however, I got to meet some amazing students with bright ideas, the energy to turn them into reality, and the compassion to work with and alongside colleagues despite the added challenges of the long pandemic. Meeting with interns regularly, hearing about their progress and working through their questions was not only a job that I thoroughly enjoyed but also one of the highlights of my week. I welcomed the student interactions amidst the habitual loneliness of my research and cherished seeing projects grow in new directions.


Annie: I had the honor of working as CESTA’s graduate technical mentor over the summer quarter. The summer was unique for so many reasons—our students were scattered across the globe and research materials were limited. In spite of these challenges, our interns demonstrated quality research skills and were eager to learn more than what was required for their projects. Several requested programming tutorials, introductions to data science, and advice about database security. Working with interns, faculty leads and researchers, and watching their projects develop, was the highlight of my summer.
This past academic year was arduous for all of us, and the fact that we did so much together at CESTA is a testament to the strength of our community. This Anthology is a record of the past year and a symbol of our resilience.
GRADUATE STUDENT MENTORS
Giovanna Ceserani Merve Tekgürler and Annie Lamar CESTA FACULTY DIRECTORcesta.stanford.edu | ii
i | Center for Spatial and Textual Analysis (CESTA) at Stanford University
acknowledgements AND CREDITS
The 2021 CESTA Anthology is a team effort and we’d like to thank everyone involved for their invaluable contributions. A few of the key players are listed below.
CESTA will celebrate its tenth anniversary in 2022! Earlier this year, we set out to capture and visualize the history of our community in data from the past decade, in a collaboration between our own Humanities+Design Lab and two student designers from Sydney University, Carmen Zeng and Adrian Chin Quan. The graphic below represents all of the 463 student interns who have worked on CESTA projects since our founding in 2012. All of the interns featured in this anthology are also represented here. Each circle represents one student, and each color segment within that circle represents an internship. This graphic shows how many of our students have come back to work with us in subsequent quarters!
Mae Velloso-Lyons
is CESTA’s program manager and the editor of the Global Medieval Sourcebook, a CESTAsupported project which you can learn more about on pages 23-25! She is a former Stanford Data Science Scholar and a current PhD candidate in Comparative Literature, where her research focuses on representations of the body in medieval fiction.


Alix Keener
is CESTA’s Digital Scholarship Coordinator, which means that she supports CESTA projects in areas such as technology use, sustainability, archiving, and accessibility. With a joint appointment at Stanford University Libraries’ Center for Interdisciplinary Research (CIDR), she is CESTA’s liaison with the Libraries and maintains their developing collection of digital humanities publications.
William Parish
is a PhD student in History, studying transnational, international, and global history with a focus on Native American and Indigenous Studies and computer science. He is a current Graduate Fellow at the Institute for Human-Centered Artificial Intelligence (HAI) and has been a crucial member of CESTA’s events team.

Rachel Dubit
is a doctoral candidate in Classics and a former graduate mentor for CESTA’s Undergraduate Research Internship. With Prof. Hans Bork and current graduate mentor Annie Lamar, she organizes a Stanford Humanities Center workshop on “The Future of the Past: Classics & Technology”.
Max
AshtonMax is CESTA’s Acting Center Manager, whose portfolio spans everything from logistics to our internship program. He graduated with a PhD in English in 2019, and his current research focuses on representations of war and heroism in medieval literature.
© 2021 CENTER FOR SPATIAL AND TEXTUAL ANALYSIS
 Boris Shoshitaishvili
Boris is a former member of CESTA’s staff team. Since graduating from Stanford with a PhD in Comparative Literature, he has developed a burgeoning interest in computational text analysis, which he is currently employing in a collaborative project on the language of psychiatric therapy.


This online publication was adjusted for a limited print run in December 2021.
FOURTH
450
cesta.stanford.edu | iv
iii | Center for Spatial and Textual Analysis (CESTA) at Stanford University
FLOOR, WALLENBERG HALL (BLDG.
160)
JANE STANFORD WAY, STANFORD, CA 94305-2055
cesta.stanford.edu • @cesta_stanford • cesta_stanford@stanford.edu
TABLE OF CONTENTS
TEXT TECHNOLOGIES: MEDIEVAL NETWORKS OF MEMORY

Uncovering the Stories Preserved in Medieval Mortuary
by Hailee Heinrich with Elaine Treharne
THE GRAND TOUR PROJECT
Tourist Genealogies...........................................................................3 by Nicholas Clark with Giovanna Ceserani
GEORGE MOSES HORTON PROJECT
Bringing Horton’s Artistry to Life with VR.............................5
by Salma Kamni and Alaina Lim with Zephyr Frank and Cecil Brown
JOSQUIN RESEARCH PROJECT
Analyzing Three-Voice Renaissance Polyphony..................8
by Mitchell Garmany with Jesse Rodin and Craig Sapp
SOCIAL NETWORKS IN ROMAN COMEDY
Prototyping Roman Comedies....................................................11 by Salma Kamni with Hans Bork
v | Center for Spatial and Textual Analysis (CESTA) at
University Director’s Welcome........................................................ i Note from the Mentor Team.......................................... ii Acknowledgements and Credits................................... iii Visualizing Ten Years of the Internship........................ iv Behind the Design......................................................... ix Student Researchers..................................................... xi
Stanford
Rolls...........................................................................................................1
THE LITERARY LAB
Tracing Author-Reader Collaboration in Fanfiction..........33 by Regina T.H. Ta and Natasha Johnson with Mark Algee-Hewitt
RUMSEY MAP CENTER: CHEROKEE HISTORY
Mapping Indigenous History: Visualizing Changes in Cherokee Land...............................................................................37
by Miraclestar Doby with Constance Owl
AFTERMATHS OF ENSLAVEMENT
A Blueprint for Building a Digital Database of the Trials of Slavery.................................................................................40 by Anthony Bui, Kiana Hu, and Juna Nagle with Grant Parker
COMPUTATIONAL BORDER STUDIES
Counter-Surveilling the State.....................................................43
by Brooke Tran with Bridget Algee-Hewitt
LIFE IN QUARANTINE
Outreach and Expansion................................................................45
Teaching Quarantine........................................................................47
by Ariana Davarpanah, Alana Mermin-Bunnell, and Hannah Walton with Nelson Endebo, Ellis Schriefer, Farah Bazzi, and Amir Eshel
MODERNIST ARCHIVES PUBLISHING PROJECT

Making Sense of Missing Metadata.........................................49
by Malia Maxwell with Alice Staveley
CISTERN
Decolonizing Western Catalogues of the Middle East.....51
Developing a Searchable Database and Virtual Gallery Space.......................................................................52
by Umar Patel and Keoni Rodriguez with Adrien Zakar and Merve Tekgürler
MAPPING OTTOMAN EPIRUS
Mapping Travel Across the Ottoman Empire.......................55 by Emir Kirdan with Ali Yaycioglu
OPENGULF: HISTORICAL TEXTS AS DATA
Better Training Sets, Better Research....................................57
Computing Lorimer..........................................................................59
by Moe Khalil and Danny Tse with Nora Barakat
ORAL HISTORY TEXT ANALYSIS PROJECT
Winnow-ing Metadata.....................................................................61
by Jade Lintott with Estelle Freedman and Natalie Marine-Street
POETIC MEDIA LAB
Free Speech and the Digital Public Sphere..........................63
The Hidden Secrets of Translation............................................65 by Uma Phatak and Yonatan Laderman with Amir Eshel, Jens Pohlmann, and Gilad Shirman
PANIC AND PANDEMIC
Early Modern England.....................................................................67
Modern France...................................................................................69 by Karin Kutlay and Cat Fergesen with Laura Stokes
Stanford sits on the ancestral land of the Muwekma Ohlone Tribe. This land was and continues to be of great importance to the Ohlone people. Consistent with our values of community and inclusion, we have a responsibility to acknowledge, honor, and make visible the University’s relationship to Native people.
vii | Center for Spatial
Textual Analysis
at Stanford University TABLE OF CONTENTS
and
(CESTA)
cesta.stanford.edu | viii
CESTA ANTHOLOGY 2020-2021
Behind the Design
KIANA HU SALMA KAMNI
Anthology Design Team
Over the past two years we have gotten well-acquainted with the digital space. We have been hunched over our laptops for work, entertainment, and study, seemingly spending more time in the digital world of bits and bytes than the physical world around us. The design of this anthology is the antithesis of the sterile and harsh computer screen we have all become accustomed to. The vibrant, joyful color scheme is intended to combat the glaring blue light we’ve become all too familiar with. Unrestrained, off-the-page typography provides a mental stimulation that the uniform words on our computer screens never gave us. And finally, beautiful, hand-drawn sketches and doodles bring in a physical, human, and expressive element that we have often been lacking while stuck in our digital world.
Creating the Cover
Building the Book
The process of creating this anthology began over the summer quarter and lasted until the end of fall. We began by figuring out how to best exhibit our deeper message through the design. Questions like “Does it feel personable?”, “Does it bring joy and excitement to readers?”, and “How do we best display the anti-digital theme?” guided and influenced our design. Of course, we also acknowledge and thank the CESTA staff who guided our creative process, collected and curated the content, supported our ideation, and were patient with our unpredictable student schedules.
Above: The CESTA logo with its overlapping rings of different colors, from which we extracted the four main colors: eggplant, auburn, sienna, and teal. These four colors provided the basic structure of the color-blocking scheme in our project layouts as well as the gradient on the cover.
Drawing inspiration from some Pinterest boards, we started the cover design with a sketch of a few project doodles and a centered title for the anthology, and a solid color background to contrast with the white doodles.
Next, we went over all the cover elements in Procreate and designed additional project doodles over a gradient background in order to include all of CESTA’s colors (explained on the next page).
2 3 1
Finally, we added the remaining projects, resized all of the doodles to fit the proper document size (along with a lot of reordering), and standardized the brush size for everything.
1 2 3
1 2 3
Titles for projects are set against a background of one of the four colors of the CESTA logo (which we rotate through in the order above). Other titles are in the same color.


Each project is accompanied by a unique, hand-drawn sketch corresponding to the research theme.
Images and student researcher information are framed by a block in the same color.

ix | Center for Spatial and Textual Analysis (CESTA) at Stanford University cesta.stanford.edu | x CESTA ANTHOLOGY 2020-2021
STUDENT RESEARCHERS
is a sophomore with interests in computer science, digital humanities, and education. She worked with Dr. Christina Hodge on the Stanford University Archaeology Center’s Women in Provenance project to analyze the role that women played in the provenance of the museum’s objects. She is fascinated by the process of synthesizing data to visually highlight trends and patterns.


is a senior majoring in Art History with a concentration in Cultural Heritage Studies and a minor in Modern Languages. She worked with Digital Humanities Graduate Fellow Anna Toledano on Anna’s project “Collecting Independence: The Science and Politics of Natural History Museums in New Spain, 1770–1820”. This included transcribing 18th-century Spanish texts to help create a database of letters and natural objects that circulated through the Spanish Empire.
is a senior majoring in Comparative Literature with minors in Creative Writing and Slavic Languages and Literatures. She is interested in the marginalized voices of women and minorities and to that end was delighted to work on Prof. Joel Cabrita’s Visible Bodies project. Her role involved negotiating for rights to the works of Regina Twala for the online archive.
is a senior majoring in Mathematical and Computational Science with a minor in Classics. In his work on the Grand Tour Project, he has pursued new ways to detect and represent meaningful connections within the project’s dataset, such as family trees for travelers. Nick is passionate about the human deep past and excited to apply his technological knowledge to advance its study.
is a junior majoring in Political Science, with interests in social good and entrepreneurship. Her time working for the Life in Quarantine project taught her about the importance of using technology to aid historical preservation. She helped to build a historical archive to share the stories of real people during times of crisis, focusing especially on the cultivation of the site’s literary submissions.
is a senior majoring in Symbolic Systems and coterming in Sustainability Science and Practice. She worked with Digital Humanities Graduate Fellow Laura Menéndez Gorina on Laura’s project “Building a Home: Narratives of Houses and Ruins from Barcelona and Havana”. Her work included analyzing city data and creating visualizations in the form of ArcGIS maps to explore housing destruction and reconstruction in Barcelona and Havana.


is a junior double-majoring in Philosophy and Classics. He is interested in ancient history, philosophy, and art, but was able to broaden his interest in more recent history through his work with Prof. Grant Parker’s Aftermaths of Enslavement project.


is a junior planning to major in Computer Science with a Human-Computer Interaction concentration and a minor in Music. She is invested in making educational opportunities and information accessible to everyone. In 2021, she worked on the Rumsey Map Center: Cherokee History project that harnessed GIS tools and data visualization to map the history of Cherokee land.


Lucy Chae
is a sophomore majoring in Classics and Urban Studies with a minor in Digital Humanities. She has a strong interest in mapping and historical preservation. In 2021, she worked with Dr. Christina Hodge on the Stanford University Archeology Center exhibit “Modeling Mesoamerica” and also on the project of graduate fellow Dharshani Lakmali Jayasinghe: “Towards Legal but Humane Border-Crossings: A Literary and Filmic Engagement with Visa Law and Policy”.
is a junior majoring in English. They are deeply interested in the intersection of computational methods and literary analysis as a means to open new areas of literary criticism. Leah has worked on various projects at the Literary Lab, including Novel World-Building and Personhood, as well as a project exploring speech patterns in 19th-century American fiction.
is a senior studying Political Science and Music Composition. With Jesse Rodin and Craig Sapp on the Josquin Research Project, he investigated unorthodox methods of analyzing fifteenth-century choral music, with accompanying data visualizations. He is particularly interested in music copyright and the various factors that contribute to creators’ musical identities.

is a sophomore studying Computer Science and Archaeology. Cat worked with Prof. Laura Stokes on the Panic and Pandemic project, where Cat read publications on the plague written in Middle French between 1500 and 1750 and analyzed genre in relation to geographical and historical positioning. Cat performed a similar analysis on Modern French publications on the COVID-19 pandemic. Cat encountered all kinds of beautiful old books, learned unfortunate plague-related words in French and German, and picked up new programming tricks.
 Pauline Arnoud
Isabel Benak
Josie Brody
Anthony Bui
Pauline Arnoud
Isabel Benak
Josie Brody
Anthony Bui
xi | Center for Spatial and Textual Analysis (CESTA) at Stanford University
Leah Chase
Ariana Davarpanah
Jordan Deasy
Star Doby
cesta.stanford.edu | xii
Cat Fergesen
Mitchell Garmany
CESTA RESEARCH ANTHOLOGY 2021
Nicholas Clark
Joshua Goodwin
is a senior majoring in History and coterming in Philosophy along the PreLaw track. He worked on the Senegalese Slave Liberations Project translating, transcribing, and analyzing a dataset of over 25,000 slave liberations in colonial French West Africa. He identified demographic trends in a period of more than 50 years and hopes to align the dataset’s location information to create infometrics and other data visualizations.
Arushi Gupta
is a junior planning to major in Political Science. She worked on the Global Urbanization and its Discontents project, specifically the team exploring privacy bias in Google Street View, where she learned about computer vision methods and GIS data.


is a junior pursuing a double major in Political Science and Communication. She is interested in how methods of communication affect relationships. Over two quarters this past year, she assisted with research on Medieval Networks of Memory, a Text Technologies project led by Prof. Elaine Treharne. She helped transcribe data to produce visualizations of religious medieval communication patterns.
Julia Hernandezis a sophomore from Tallahassee, FL considering pursuing a double major in Computer Science and Sociology. Over the past year, her role with the Global Urbanization and its Discontents project over the past year has included conducting graphical analysis of data illustrating privacy bias in Google Street View and web-scraping the Diario Oficial de Mexico to extract data on ejidos (communal lands).
Kiana Hu

is a junior studying Classics on the Greek and Latin track. Over the summer, she worked with Prof. Grant Parker on the Aftermaths of Enslavement project to curate a database from records of the slave trade. She also co-designed this anthology!
Natasha Johnsonis a junior studying Symbolic Systems, with a concentration in Text-Based Data Mining and Analysis. She spent the past year working in the Literary Lab, using text mining to explore the significance of authorcommentator interactions in the fanfiction community, and she hopes to continue working on this project this upcoming year.
Corazón Johnston
is a senior majoring in Science, Technology, and Society. Through her work with the Literary Lab, she has learned about the many computational methods one can leverage to analyze texts. Last year, she worked on the Personhood project, examining the different ways a character’s personhood is defined and presented in works of literature.
Salma Kamni
is a sophomore majoring in Product Design with interests in the digital humanities and extended reality. In Winter and Spring quarters, she worked with the George Moses Horton project to bring storytelling into the world of virtual reality. In the Summer, she worked on the Global Medieval Sourcebook and on Roman Comedy: Social Network Relationships. She also co-designed this anthology!
is a junior majoring in Computer Science and minoring in Comparative Literature. This year, he worked on the OpenGulf: Historical Texts as Data project. His role involved building and training an Optical Character Recognition model for Arabic text through Transkribus.


is a sophomore planning to major in Computer Science and double-minor in Ethics in Society and Public Policy. Her work with the Text Technologies project Medieval Networks of Memory included working with data that had already been gathered to produce interactive maps of religious houses and visualizations of scribal networks.
(they/she) is a junior majoring in Comparative Literature and Mathematics. Working with Digital Humanities Graduate Fellow Anna Mukamal on her project “The Therapeutic Encounter,” Hayn explored the interaction between therapeutic culture and literature in the 20th century. They applied computational tools to a corpus including T.S. Eliot’s “The Cocktail Party” and Djuna Barnes’ “Nightwood”, then co-presented the result at CESTA’s Digital Humanities Research Symposium.
is a sophomore with interests in history, digital humanities, anthropology, archaeology, and symbolic systems. Working with the Mapping Ottoman Epirus project, Emir applied big data, spatial and network analysis, visualization, and other digital methods to investigate how the Ottoman Imperial regime operated in the vivid regional economies and power-centers of the Balkans, especially Epirus. He also worked on the Immigration Detention project..
Hailee Heinrichxiii | Center for Spatial and Textual Analysis (CESTA) at Stanford University
Moe Khalil
Hannah Kim
Hayn Kim
cesta.stanford.edu | xiv STUDENT RESEARCHERS
Emir Kirdan
CESTA RESEARCH ANTHOLOGY 2021
Karin Kutlay
is a sophomore, planning to major in “anything goes.” She has been (perhaps worryingly) obsessed with the plague and Middle Ages for as long as she can remember and fittingly worked on the England side of the Panic and Pandemic project with Prof. Laura Stokes.
Yonatan Ladermanis a sophomore interested in the intersection between philosophy, literature, and psychology. In winter 2021, Yonatan worked in the Poetic Media Lab on the Hidden Secrets of Translation project. He compared different Hebrew translations of Goethe’s Faust to investigate how the relationship between the Jewish people and German culture has changed through time.
Alaina Lim
is a senior majoring in Math and coterming in Computer Science. She worked on the George Moses Horton Project, where she was interested in the technical coding aspect as well as the design and storytelling. She loved having the opportunity to share the inspiring life of enslaved poet George Horton and to learn about VR.
Jade Lintottis a fifth-year student who majored in Math and is coterming in Theoretical Computer Science. She is working on the Oral History Text Analysis Project, where she helps analyze transcripts of interviews to see when and how American women had talked about sexual assault and harassment before the very recent past.


 Malia Maxwell
is a junior majoring in English with an emphasis in Creative Writing (Poetry Track). She worked with the Modernist Archives Publishing Project (MAPP) as a research assistant for Dr. Alice Staveley in summer 2021, primarily assigning metadata to and writing summaries for the Hogarth Press’ archived letters and publishing materials.
Alana Mermin-Bunnellis a junior passionate about visual art and bioscience. She worked as a research assistant for the Life in Quarantine project in spring quarter 2020. Alana helped with interviews, outreach, writing blog posts, and creating graphics for the website and social media.
Juna Nagleis a sophomore planning to major in Psychology. In 2021, she started work on the Aftermaths of Enslavement project, investigating and documenting the transIndian Ocean slave trade in South Africa. She continues to aid the team in documenting resources and creating a website that will make project information accessible.

Umar Patel
is a kunior double-majoring in Computer Science and Archaeology with interests in machine learning applications to heritage, textual analysis, computer vision, and virtual museum development. This past spring he worked with the CISTERN project team. He helped to develop a searchable database of Ottoman books, maps, and literature, and created a virtual gallery in Unity to serve as an immersive research space for academics and enthusiasts.
Uma Phatakis a junior majoring in Computer Science and minoring in Spanish. She worked with the Poetic Media Lab on the Free Speech and the Digital Public Sphere project, which explored the evolving field of internet speech policy. She performed statistical analysis on IT blog discourse to compare the US and Germany’s respective opinions on internet speech policy.
Sahir Qureshi
is a sophomore with interests in mathematical and computational science, public policy, and anthropology. This year, he worked on the Border Cities team of the Global Urbanization and its Discontents project to uncover patterns of urbanization, industrialization, inequity, and economic upheaval in border landscapes over the past few decades.
Ashwin Ramaswamiis a 2021 graduate who majored in Computer Science. He worked with several projects at CESTA, including the Grand Tour Project and the Poetic Media Lab. Together with Daniel Bush, he spearheaded a technical survey of CESTA projects which is helping to shape guidance for faculty-led research.
 Keoni Rodriguez
interned at CESTA during their senior year as a History major with a double minor in Earth Systems and Comparative Studies in Race and Ethnicity. In their work on the CISTERN project, they aided the team by compiling resources to expand the project’s theoretical methodologies and English-language geographic sources.
 Regina T.H. Ta
is a junior pursuing a double major in Comparative Literature and Symbolic Systems. Working with the Literary Lab on the Grammar of Gender, Personhood, and Fanfiction projects has introduced her to new methods of textual analysis, and she is fascinated by the possibility of extracting stories and patterns from language.
Ryan Tan
is a senior majoring in Comparative Literature and Philosophy and minoring in Computer Science. Ryan collaborated with the Grand Tour Project team with the goal of completing its digital publication.


xv | Center for Spatial and Textual Analysis (CESTA) at Stanford University
cesta.stanford.edu | xvi STUDENT RESEARCHERS
CESTA RESEARCH ANTHOLOGY 2021
Brooke Tran
interned at CESTA while a senior majoring in Management Science and Engineering. She worked on the Computational Border Studies project, where her role was to build a mapping platform that uses geospatial data to track ICE raids throughout the U.S. and incorporates ethnographic surveys of undocumented immigrants.


is a sophomore from Berkeley, CA. She is potentially majoring in Product Design and minoring in Urban Studies. Audrey worked with the Urban Studies and Practice of Theory project, led by Prof. Ato Quayson, to investigate the “high streets” of New York and San Francisco by collecting OSM data and historical records.
Danny Tseis a junior majoring in Mathematics and minoring in Statistics, and considering a co-term in Computer Science. As a CESTA intern working on OpenGulf: Historical Texts as Data, a joint effort between Stanford and NYU Abu Dhabi, he utilized unsupervised machine learning methods, such as k-means clustering, to analyze historical data from the Persian Gulf.


is a junior pursuing a major in Computer Science and a minor in Energy Resources Engineering. As an intern for the Urban Studies and Practice of Theory project led by Prof. Ato Quayson, she collected geographical and historical information on the commercial districts and high streets of London in order to understand their significance for the city’s development.
is a junior interested in mathematical sciences. He is particularly fascinated by networks anywhere they show up, including in historical manuscripts. This year he worked with Prof. Michael Penn on Social Networks in the Early Islamic World, where he extracted social and geographical network information from a Syrian monastic history text.

is a sophomore interested in the intersection of computer science and economics. Last winter, Vicky worked with Prof. Grant Parker on the Aftermaths of Enslavement project. Through the text mining of records preserved in the VOC archives, her work helped to uncover the rich social and cultural world created by slaves in the Cape colony.
Hannah Waltonis a senior majoring in English and minoring in Human Biology. In spring 2020, she joined the Life in Quarantine project, which is working to produce a historical public archive documenting the COVID-19 pandemic. Her work for Life in Quarantine included website design and archive development.


is a junior from Shenzhen, China, who is pursuing a double major in Gender Studies and Data Science. This year, Glede worked with Prof. Joel Cabrita on the Visible Bodies project, where she focused on organizing and archiving unpublished works from a talented African writer and political activist, Regina Twala.
is a sophomore from Chengdu, China, who is planning to double-major in Symbolic Systems and Classics. She is interested in literary analysis and language learning, which she does both in and out of class. This year, she worked with Digital Humanities Graduate Fellow Maciej Kurzynski on Maciej’s project, “Negotiating the Nation-State: Affects and Vocabularies in the Literature of the People’s Republic of China”, where she analyzed language usage in the literature of the People’s Republic of China.
Runqi Zhang
is a senior majoring in Classics and German and coterming in German Studies. Runqi was an intern for the Global Medieval Sourcebook, where she encoded texts for digital publication and worked on translations from medieval Latin. Runqi loves reading everything medieval and enjoys the beauty of churches. She also loves learning all kinds of ancient languages.
is a senior majoring in Classics and Symbolic Systems. Dante was an intern for the Global Medieval Sourcebook, where she focused on developing content related to a collection of Chinese song lyrics. She also contributed to the encoding of texts for digital publication and archiving. Dante is fascinated by ancient Greek as well as other ancient languages and enjoys using digital tools to add new possibilities to ancient texts.
is a sophomore studying Economics and Computer Science. He worked on the Global Urbanization and its Discontents project, focusing on patterns of urbanization in border cities along the Rio Grande. He loved having the opportunity to contribute to amazing research that tackled issues of displacement, urbanization, and housing vulnerability.
Shayana Venukanthan Qixuan “Glede” Wangxvii | Center for Spatial and Textual Analysis (CESTA) at Stanford University
Rachel Wang
Audrey Ward
Thomas Worth
Vicky Wu
Dante Zhu
Michael Zhu
cesta.stanford.edu | xviii STUDENT RESEARCHERS CESTA RESEARCH ANTHOLOGY 2021
TEXT TECHNOLOGIES: MEDIEVAL NETWORKS


OF MEMORY
Project
Description
Elaine Treharne, Professor of English
Stanford Text Technologies (texttechnologies.stanford.edu) investigates all forms of human communication from 70,000 BCE to the present day in order to determine trends and characteristics of information systems from the cuneiform tablet to the scroll, to books, film, and mobile devices. Medieval Networks of Memory is one of several sub-projects under this umbrella. It aims to reveal a new and dynamic picture of thirteenth-century religious and social networks and community commemoration. It will achieve this through describing, mapping, visualizing and analysing unique and culturally rich textual artefacts—the Mortuary Roll of Lucy of Hedingham, now kept at the British Library (MS Egerton 2849, parts I and II), and the Mortuary Roll of Amphelisa of Lillechurch, which belongs to St John’s College, Cambridge (MS N. 31).
Our research visualizes which English institutions of men and women were united in their effort to remember Prioress Lucy de Vere and Prioress Amphelisa and how each religious establishment sought to inscribe their respects to the prioresses after their deaths. Our team is producing a database that contains information for each inscription and religious house written into the Roll, creating manipulable data for an interactive map, behind which will be locational, descriptive, textual, and evaluative evidence. Such data permits a much closer account of spiritual networks in this period, together with an assessment of religious houses’ resources and abilities to connect perceptibly with each other. New questions are emerging from this project’s work that we hope will allow subsequent innovative research on holy women, their communities and their scribal capability; on script types and trends in the earlier thirteenth century; and the significance and methods of collective memory formation in medieval England.
Uncovering the Stories Preserved in Medieval Mortuary Rolls
 Hailee Heinrich
My primary focus on this project was to input entries from two major thirteenth-century mortuary rolls into a CSV file and assist in the process of data visualization. Mortuary rolls are documents memorializing deceased members of religious institutions such as monasteries. The dataset I helped create catalogued the particular institutions to which each deceased person had belonged, along with details of the institution’s make-up (e.g. an all-male monastery) and its precise geographic location. The PI provided additional information about the institutions and the type of script used in the rolls. The team then configured this dataset into an interactive map through which users could discover more of the nuances. For example, users can see the geographic distribution of entries, the length of the journey to each religious institution, the number of male vs. female institutions that were visited, as well as images of the script and of illustrations from the roll itself. The map will help us better understand the politics of communication and the
importance of religious institutions as nodes connecting individuals, groups, and places (Figure 1). In the spring, I gave a presentation on resonances between the monumentality of a medieval artifact like the Mortuary Roll of Lucy of Hedingham (Figure 2) and modern built monuments, such as Maya Lin’s 1981 Vietnam Veterans Memorial and Daniel Libeskind’s Jewish Museum in Berlin. The comparison of these structures with the medieval mortuary roll can remind us how the medium and practice of monumentality and human memorialization changed across centuries, even as the essential motivation persisted. Moving forward, I hope to catalogue more rolls and log additional details for each entry. This will support a deeper understanding of religious networks in this period and help uncover the many stories preserved in these works of art.
1 | Center for Spatial and Textual Analysis (CESTA) at Stanford University
cesta.stanford.edu | 2
Figure1:Theinteractivemapourteamcreatedusingtheentriesofthemortuaryroll,color-codedforthe different kinds of information taken from the dataset.
STUDENT RESEARCHER
Figure 2: Screenshots of the Mortuary Roll of Lucy of Hedingham. You can see the detail and care with which these mortuary rolls were created, both in their script and illustrations.
Hailee Heinrich
THE GRAND TOUR PROJECT
Project Description
In the eighteenth century, thousands of Northern Europeans traveled to Italy for a journey of cultural and symbolic capital they called the Grand Tour. These travels were a formative institution of modernity, contributing to a massive reimagining of politics and the arts, the market for culture, ideas about leisure, and the practices of professionalism. Since 2008, the Grand Tour Project (grandtour.stanford.edu) has used and generated digital tools, analysis, and visualizations to bring us closer to the diverse travelers, elite and otherwise, who collectively represent eighteenth-century travel to Italy. We have been digitizing and enhancing the Dictionary of British and Irish Travelers to Italy 1701-1800 to create a searchable database of more than six thousand entries and visualizations cataloguing the journeys and lives of those who made the Grand Tour. We are now working towards the public release of this interactive database with an accompanying digital volume of explanatory essays.
Tourist Genealogies
 Nicholas Clark

The current data visualizations in the Grand Tour Explorer tool represent travelers in the same alphabetical order in which they appear in the print Dictionary (Figure 1). But my research in Spring 2021 aimed to create a large-scale family tree using the Grand Tour Explorer database. A robust, concrete representation of genealogical relationships among travelers will provide insights into how the culture of these tours developed over the course of the eighteenth century. Using a Python library called NetworkX, I generated a graphical network structure to show connections between spouses and between parents and children.


Our data for the Grand Tour includes life events for each traveler, including marriage. Spousal connections were
extracted from these life event data points. Similarly, parent-child relationships were extracted from the parentage data available for most (but not all) travelers. A first attempt to gain insight into family relations in our data, both marriages and parentage, is shown in Figure 2. This figure was generated from just a small subset of our data as this form of family tree can be computationally slow to build. Future extensions of my work will include the ability to connect multiple generations of a single family, and to expand the overall number of travelers in a single genealogical visualization, by using traversal algorithms or other methods from graph theory (Figure 3 offers an example of how this might look).

STUDENT RESEARCHER
3 | Center for Spatial and Textual Analysis (CESTA) at Stanford University
cesta.stanford.edu | 4
Figure 2: Even when sorted by travel date, current data visualizations for travelers in the Grand Tour Explorer maintain the alphabetical order of the print form.
Figure 2: A subset of the Grand Tour data visualized as a network graph usingthePythonlibraryNetworkX,asafirstattempttodrawoutfamily relations in the data.
Figure3.Desiredfamilytreevisualizationforfutureresearch.
Giovanna Ceserani, Associate Professor of Classics and Faculty Director of CESTA
Nicholas Clark
Figure3.Desiredfamilytreevisualizationforfutureresearch.
GEORGE MOSES HORTON PROJECT
Project Description
Zephyr Frank, Professor of History, and Cecil Brown, Independent ScholarWho was George Moses Horton? What is his significance to American culture today? An African American slave (1797–1888) challenged by laws that prevented him from learning to read and write, Horton developed a method of composing poetry orally. Like contemporary rappers Jay-Z, Common, and the Last Poets, he created a new way of making poems, generally called “free-styling.” Students would pay 25, 50, or 75 cents for Horton’s poems, depending on the level of passion for their object of affection! Using AR (augmented reality) and VR (virtual reality), the Horton Project will transport viewers to the antebellum world of the University of North Carolina, helping us to recover aural and spatial dimensions of oral poetry and performance in the 19th century.
Bringing Horton’s Artistry to Life with VR
Salma Kamni and Alaina LimThe life and work of George Moses Horton was groundbreaking and inspiring. Despite being enslaved and never taught to write, he became the first African American author to be published. His methods of improvisational composition resonate through history—his poetry can be seen as a predecessor of today’s freestyle rap—yet his story is not well known. This project uses the VRbuilding tool Unity to bring his remarkable life and work into today’s educational environments.
Being new to the history of George Moses Horton as well as to VR design, we began by immersing ourselves in materials (articles, maps, and poems) connected to Horton and to antebellum UNC-Chapel Hill, where he sold fruit and composed his poems for pay (Figure 1).

We also met with a number of experts in avatar creation, VR, and AI who led us to Unity as the cross-platform game engine in which to design and code Horton’s virtual setting. Working to adapt an 1818 map of UNC-Chapel Hill in VR, we took inspiration from an interactive VR map of the University of Oregon (Figure 2).
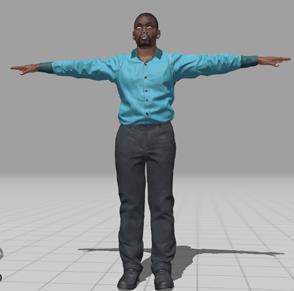
Creating objects, adding colors to the VR world, and designing historically accurate buildings and clothing were just a few of the challenges. We also had to perfect timelines of episodes in Horton’s life to construct cohesive, cinematographic scenes in which the actions of multiple avatars would make narrative sense (Figure 3).
Our PI, Dr. Cecil Brown, created a script for a “haunted house” scene where Horton, fleeing bloodthirsty hounds, asks a free man for refuge. We spent hours scouring the Unity asset store to perfect the environment—from specific trees only found at UNC to a rundown haunted house and the avatars of Horton and the free man.

As we built the scene, we often had to study tutorials or seek guidance from experts. Moreover, staying true to the script while relying only on the free materials available online was difficult. Much as we wished to create a highly-detailed, nineteenth-century, rural North Carolina town, we quickly realized how limited we were in our resources and abilities. Still, as the images demonstrate, we made significant progress while learning an incredible amount. We’re proud to have given this important project a strong foundation for future interns to build on.

5 | Center for Spatial and Textual Analysis (CESTA) at Stanford University
cesta.stanford.edu | 6
Figure 1: A bird’s-eye-view illustration of the setting where George Moses Horton stood and recited to his students and peers.
Figure2:AmapofUNC-ChapelHill’scampusin1818thatwerecreatedinUnity.Some iconic buildings, like UNC’s bell tower and old well, hadn’t been built yet.
STUDENT RESEARCHERS
JOSQUIN RESEARCH PROJECT


Project Description


 Jesse Rodin, Associate Professor of Music, and Craig Sapp, Adjunct Professor of Music
The Josquin Research Project (josquin.stanford.edu) is an openaccess tool for exploring Renaissance music. The JRP hosts a large and still growing collection of complete scores that are browsable online. Users can not only see the music, but also search the repertory for melodic and rhythmic patterns. A series of analytical tools can be used to probe individual works or explore musical phenomena across larger repertories. The project’s goal is to bring big data into conversation with traditional analytical methods in order to gain deeper knowledge of polyphonic music from ca. 1400 to ca. 1520.
Analyzing Three-Voice Renaissance Polyphony

Mitchell Garmany
Five-hundred years after the death of Josquin des Prez, the greatest Renaissance composer, fundamental questions ranging from matters of style and compositional technique to problems of attribution continue to benefit from close study. My work this quarter with the Josquin Research Project has revolved around comparison, analysis, and data visualization of Renaissance compositions scored for three voices. These analyses give us insights into the particular styles and practices that define and differentiate composers and genres, offering new ways to approach and interpret them.
Several existing studies have focused on “counterpoint modules.” A counterpoint module expresses the momentary relationship between two voices, both vertically (when two notes are sung simultaneously) and horizontally (how each voice moves from one note to the next), shown in Figure 1. Although some modules appear throughout the repertoire, each composer, genre, and generation bears a unique mark; certain modules achieve popularity, while others are relegated to obscurity.
We investigated the works of several Renaissance composers to discern the relationships between their treatments of the different voices that make up a three-voice composition (Figure 2). From samples of their music, we noticed patterns in counterpoint modules between each pair of voices
 Figure1:Thisexampleillustrateshowcounterpointmodulesareformulated:theverticaldistancebetweentwovoicesat one moment, the motion of the bottom voice out of the two, and the vertical distance between the voices afterward. This particular module would be encoded as: 10 -2 12.
7 | Center for Spatial and Textual Analysis (CESTA) at Stanford University
Alaina Lim Salma Kamni
Figure3:TheUnityworkspaceusedfordesigningscenesalongsideactualgameplayfromascenewebuilt.
Figure4:Terrainforthe“hauntedhouse”scene.
Figure 5: The haunted house we used in the scene.
GEORGE MOSES HORTON PROJECT cesta.stanford.edu | 8
Figure 6: The Horton avatar from multiple scenes next to an aged version we created using Ready Player Me.
that more or less mimicked power law distributions (Figure 3). This should not be surprising: as with words in language, there exist a few musical fragments that appear very often, and a multitude that appear only once or twice in a composer’s oeuvre. While this power-law property generally applies to all voices across all the composers we studied, we noticed that the outermost voices — those which generally sing the highest and lowest notes in a piece — displayed much steeper curves than other pairs.


This data is not without complications: within works composed for three voices, composers often have one voice rest temporarily in order to thin out the musical texture. Compositional practice of the time suggests that composers approach writing for two voices with strategies that are different from those they would use for three or four voices. Even in three-voice music, then, there are moments of two-voice texture that may be composed with different styles in mind. Analysis of three Renaissance composers demonstrates that as much as 35% of the contents of three-voice works is scored for less than three voices (Figure 5).


In order to ensure that the data we collect is actually representative of three-voice Renaissance writing, we are currently considering methods by which to account for the differences presented by these moments of two-voice writing.
one standard deviation above or below those means to reflect the variance in the corpus.
To further investigate this phenomenon, we expanded our samples to include all the three-voice works by five composers and categorized them by both composer and genre. We found that while all composers and genres displayed a preference for two particular counterpoint modules, some evinced considerably greater variety in their counterpoint practices than others (Figure 4). These tendencies offer us a mathematical means of evaluating trends in musical variety and homogeneity, which point to the emergence of modern triadic harmony. They also allow us to identify idiosyncratic composer behaviors with which to compare unknown pieces.

9 | Center for Spatial and Textual Analysis (CESTA) at Stanford University
Figure5:Sectionsofthree-voiceworksareoften composedfortwovoicesorevenone.Thisdiagram measures the mean proportion of time for which each numberofvoicessingsOckeghem’sthree-voiceworks (asanaverageofallproportionsforthatnumberof voicesacrossallofOckeghem’sworks),withthinnerbars stretching
Figure 4: This histogram lists the most common modules for three-voice textures among works by Johannes Ockeghem in the JRP corpus. Although Ockeghem favors the same modules as Josquin (“10 2 10” and “10 -2 10”), these comprise only 8.45% of the possibilities that govern the outermost voices, as compared with 1.7 times more forJosquin(seeFigure3).
STUDENT RESEARCHER cesta.stanford.edu | 10
Mitchell Garmany
Figure2:ThisisanexampleofhowweencodedourcorpusofRenaissanceworksusingtheHumdrumToolkit. On the left, a text-based, note-by-note version of the score presents each individual voice in a distinct column. The modern score appears on the right. Encoding relevant works via this system enables thorough and rapid analysis of the harmonic, melodic, and rhythmic elements of both individual works and vast swathes of music.
JOSQUIN RESEARCH PROJECT
Figure 3: This histogram outlines the most common counterpoint modules for all instances of three-voice texture among works securely attributed to Josquin in the JRP corpus. Note the pronounced preference toward themodules“10-210”and“10210,”accountingfor14.48%oftheintervalsbetweenthetopandbottomvoices.
SOCIAL NETWORKS IN ROMAN COMEDY
Project Description
Hans Bork, Assistant Professor of ClassicsThis project aims to generate “social network maps” among characters in ancient Roman Comedy. Plautus’ work is one of the few places in ancient Roman literature where we encounter people of different statuses, ethnicities, economic classes, and genders interacting with each other. (Most ancient Latin literature tends to feature elite, Roman, male figures; Plautus is a rare exception.) The interactions among Plautine characters are crucial evidence for a more accurate understanding of ancient Roman society, but until now they have never been examined from a contemporary networking perspective. We fill this gap by using multiple indices of interaction—including the total lines spoken between characters, the total time onstage, and the total number of characters in a play, among others—to create the first visualizations of Plautine social networks. Our prototype can be viewed at ancient-drama-sna.github.io/Roman_comedy_networks


Prototyping Roman Comedies


Salma Kamni
Being part of Social Networks in Roman Comedy was an incredibly illuminating and exciting experience for me. Joining at its inception, I had a significant role in influencing the direction the project would take, which tools we would use, and how best to illustrate our findings.
The project aims to map social network relationships while ensuring the online accessibility of the original data. I participated in making decisions on the optimal resources for mapping and exhibiting data on the site. I conducted a review of promising data visualization tools and determined which would be best: D3, Tableau, or Gephi. Given our project objectives—interactivity, accessibility, and web-friendliness—D3 prevailed. For hosting, we chose GitHub pages and the Jekyll framework for the static site. I also familiarized myself with D3.js, worked on social network graphing sourced from other programmers, and created a prototype using our dataset for Plautus’ play Captivi (“The Prisoners”). I documented my process diligently throughout, from choosing software for visualizations to selecting data-formatting and collection methods.
Overall, the project helped me strengthen my web development skills, enabled engagement at different stages of the decision-making process, and invested me with a sense of ownership over our prototype.
cesta.stanford.edu | 12
Figure2:TwoimageshighlightingD3’sweb-basedinteractivity.Ontheleft,aslidertoolonthewebpagehasincreasedthe map’snodesizes.Ontheright,auserhasdraggedthecharacternodeof“Hegio”tothetopofthesocialnetworkgraph.(In theD3.jslibrary,theforcelayoutusesaphysics-basedsimulatortorepositionalloftheelementsasoneofthenodesis dragged,factoringincentersofgravityandrepulsion.)
Figure3:Thedatabaseusedtobuildourcurrentprototype.Itsrelativelyfewentriesmadeiteasytoexperimentwithdata inthecoderatherthanbypullingfromanexternalJSONfile.Wehopetoaddvisualizationandqueryfeaturesforother importantinformationheldinthisdataset,suchascharactersocialstatusandorigin.
STUDENT RESEARCHER
Salma Kamni
11 | Center for Spatial and Textual Analysis (CESTA) at Stanford University
Figure1: Aprototypesocialnetworkvisualizationof characterinteractionsinPlautus’playCaptivi(“The Prisoners”).Thethicknessofthelinesindicatesthe frequency of the interactions.
IMMIGRATION
DETENTION
Project Description
 Ana Minian, Associate Professor of History
This project tracks the history and growth of immigration detention in the United States from Ellis Island to the present day. In particular, it focuses on the detention of European migrants in Ellis Island, Chinese migrants in Angel Island, Cuban migrants in the Atlanta penitentiary, and Central American migrants who have experienced family separation. Through these case studies, it hopes to tell the broader history of immigration detention.
Tracing the History of Immigration Detention
Emir Kirdan

Initially imposed in the late 19th century, immigration detention was abandoned after the decrease in European and Asian migration due to the Immigration Act of 1924 and the Great Depression. The influx of Cuban and Haitian immigrants in the 1980s, however, which was highly politicized by the media, changed the discourse on immigration detention and led once more to the detention of immigrants in jails and detention centers on the US mainland.
By scrutinizing the annual reports of the Immigration and Naturalization Service from 1940 to 1982, we obtained detailed information about immigration and naturalization, travel control and enforcement, border patrol and investigations, and deportation and detention activities. We found a number of inconsistencies in the way the information was recorded: the format and content of these reports changed from year to year, and the presentation of the alien categories and
policies pertaining to immigration detention shifted over time. It therefore took significant effort to track the patterns in the number of deportable aliens, aliens detained, aliens apprehended, aliens deported, etc. After studying numerous reports, highlighting any discrepancies and consistencies, and using various other resources for the missing years, we created an extensive data table that records immigration detention and related policies from 1940 to 1982. We organized the data so as to group together different labels for the same category (Figure 1).


Beyond quantitative evidence, the reports provided the stories and personal accounts of many immigrants, from the German and Italian enemy aliens who could not proceed towards naturalization, to the 290 Peruvian Japanese immigrants who were deported without the approval of the Peruvian Government, to immigrants who were admitted to non-Service detention facilities and jails. We created visualizations from the compiled data (Figure 2) that show how the numbers of people detained, expelled, deported, paroled, and apprehended have changed over time and the ethnicity, age, etc., of those immigrants.
Once the National Archives reopen, we will collect sources on Chinese detention in the Bay Area, which we will use to create more specific graphs about the characteristics of the immigrants detained there, and to gather more of their stories. We will also explore how best to use our visualizations for Prof. Minian’s book on the history of immigration detention.
13 | Center for Spatial and Textual Analysis (CESTA) at Stanford University
cesta.stanford.edu | 14
Figure 1: The table on the left lists all the categories of immigration data we extracted from the reports for the years 1940 to 1982. The one on the right shows our organization of the data to consolidate categories and trackhownumberschangefromoneyeartothenext.
Figure 2: These are three visualizations of the data we extracted from the 1940-1982 reports. Moving top to bottom, they represent: aliens deported (blue), required to deport (red), and expelled (yellow); total aliens deported (blue) compared with aliens deported to Mexico (red); and nationwide apprehensions for the fiscal years 1941-1986.
Emir Kirdan
STUDENT RESEARCHER
SENEGALESE SLAVE LIBERATIONS PROJECT

Project Description
The Senegalese Slave Liberations Project builds on the Slave Voyages Database, which has transformed the study of the trans-Atlantic slave trade by presenting the most comprehensive collection of individual slave trade voyages and the most complete set of evidence of African ports of embarkation and American ports of disembarkation. The Slave Voyages Database, however, tells us virtually nothing about slavery and the slave trade within Africa. The Senegalese Slave Liberations Project provides a crucial counterpart to the Slave Voyages project in presenting evidence of slavery and the slave trade in the Senegambian, Mauritanian, and Malian region of West Africa during the second half of the 19th century. Specifically, registers of liberation have survived as records of slaves under French colonial authority who sought their freedom. We are working to provide unique identifications for each case of liberation, analyze the data, and develop visualizations to support academic research and innovative pedagogy. Of the 28,000 liberations registered for the years 1857-1904, we have already analyzed over 12,000 cases. We are now beta-testing an interactive website that would facilitate the use and exploration of this data by researchers and students.

Dataset Expansion, Visualization, and Next Steps

 Joshua Goodwin
As a research assistant on this project, my primary focus was on expanding the size of our dataset to include previously untranscribed entries recording the liberation of orphaned child slaves. I also collaborated with team members at Hamilton College to update our data analytics and prepare our research for publication. For the first task, I increased the size of our dataset to over 12,000 individual entries of liberated persons by incorporating all the original sources from the years 18921904. We also completed data gathering on minors who had been liberated into the custody of the state, an addition crucial for future study of this historically overlooked population (Figure 1).

We were then able to compare our findings with previous demographic analyses of the same region and period that had used different registers (for example, the studies of Martin Klein). Accounting for a full decade of liberations enabled us to make concrete conclusions in our article draft, which brought us closer to publication.
Beyond the dataset itself, I helped update, expand, and standardize our data visualizations of the demographic statistics from 1892-1904 (Figure 2). The data visualizations we produced show where enslaved peoples originated, which is significant progress toward our goal of depicting the liberated population’s geographic distribution. Eventually, we hope to extend our coverage to the entire fifty-year period contained in the data archive.
Finally, I ensured all data and visualizations met publication guidelines for the academic journal Esclavages & Post-Esclavages (Slaveries & Post-Slaveries), where our preliminary article analyzing these liberation cases has been published: https://journals.openedition.org/slaveries/5495

15 | Center for Spatial and Textual Analysis (CESTA) at Stanford University
cesta.stanford.edu | 16
Figure 2: From left-to-right: A map based on our data which depicts slave liberations in French West Africa in relation toprovincialdistricts;thesamemapbutcolor-codedforthespecificpercentagedistributionofliberationsperdistrict.
Richard Roberts, Professor of History, and Rebecca Hall, Visiting Assistant Professor of Environmental History (Hamilton College)
RESEARCHER
Figure 1: A photograph of an 1897 register of liberated orphans—note the lack of parent names as well as the names of new guardiansafterliberation—aboveascreenshotofaCSVtemplatefilledwithdatafromthisregister.
STUDENT
Joshua Goodwin
STANFORD UNIVERSITY ARCHAEOLOGY COLLECTIONS:

WOMEN IN PROVENANCE
Project Description
Hodge,Stanford University Archaeology Collections cares for over 100,000 cultural artifacts from around the world, dating from hundreds of thousands of years ago to the late 20th century. The Women in Provenance project intertwines object and personal biography to explore how gender shaped this cultural collection. Through archival and historical work, the project will identify women named in our records, research their lives, and interpret their contributions in the context of Stanford’s institutional history and the broader history of archaeology, anthropology, colonialism, and gender. We will enrich SUAC’s basic provenance records (summaries of who owned an artifact) by creating a digital finding aid that helps users rediscover these overlooked women and the cultural collections they assembled. The project thus combines qualitative methodologies with computational pattern analysis to improve access to our aggregated provenance data—to the who, what, where, when, and how of our collection’s creation.
Visualizing Women in Provenance


A recent inventory of the Stanford University Archaeology Collections (SUAC) found that at least 45 women played a prominent role in excavating, collecting, and donating the cultural artifacts now held in the collection. We aim to reintegrate their contributions and give these hidden women their voices back while gaining a better understanding of the role of trained and untrained women in the history of archaeology and anthropology. With this goal in mind, we are creating interactive visualizations that can assist research and improve public and stakeholder outreach.
I joined this project in January 2021, when it was still in its infancy. I worked with Dr. Hodge and Veronica Jacobs-Edmondson (the collections assistant) to create a project plan. We focused first on researching the lives of these women and determining how best to organize their biographical
information in a dataset. Searching through archives and database records, we identified relevant information and built up a database. Once this was populated—with the help of 16 students from Dr. Hodge’s “Museum Cultures” class—we switched our focus to visualization.
The main tasks were cleaning up the data to ensure no errors persisted; converting the data into different formats for exploitation; creating the visualizations themselves; and documenting the whole process for future contributors (via a data entry style guide, training videos, meeting notes, and GitHub).

I created three different scripts that call functions to validate different kinds of data, such as confirming the unique nature of each ID or validating uniform formatting across data entries. Future work will focus on expanding these validation scripts for more robust coverage. We then needed to convert our datasets into appropriate formats for the two platforms we were exploring: Palladio (a Stanford-designed platform for visualizing complex historical data) and Omeka (an open-source publishing, collections management, exhibition, and visualization platform).
I used platform-specific Python scripts to convert the CSV files from workin-progress tables to CSV files fit for each platform. Conversion enabled us to begin working with the different platforms to visualize the data and compare outputs as we continued to build the tabulated dataset. While I produced some visualizations in Palladio, I relied most on Omeka features (Neatline maps and exhibits) and original Python scripts
cesta.stanford.edu | 18
Figure 1: Screenshot of a Neatline map with a focus on the congresswoman and ambassador Ruth Bryan Owen.
Figure 2: Screenshot of a Bokeh Python map, also focused on the congresswoman and ambassador Ruth Bryan Owen.
17 | Center for Spatial and Textual Analysis (CESTA) at Stanford University
Christina
Academic Curator and Collections Manager of the Stanford University Archaeology Collections
Pauline Arnoud
ThepioneeringarchaeologistHazelDorothyHansenwithherstudentsatStanford.
(Bokeh maps). Neatline maps allow us to tell individual women’s stories through maps, images, and timelines, enabling simultaneous temporal and spatial exploration of the data, and Omeka exhibits allow us to tell these women’s stories through more of an imageand text-based approach. The interactive Bokeh map, meanwhile, lets us visualize data from all the women together and compare more than two dimensions of data at the same time. We decided the Bokeh map is a stronger research tool for revealing patterns across the cohort of women studied (Figures 1 and 2).
Throughout the project, I created tutorials on our methods so that new researchers can more easily build on what we’ve accomplished so far. SUAC now plans to complete and clean the CSV dataset; to upload it to Omeka exhibits with short write-ups and images as an interpretive finding aid; to integrate the Bokeh map; and to develop additional visualization tools. Most recently, we launched a virtual StoryMap exhibit based on the research of the 2021 “Museum Cultures” class.
SOCIAL NETWORKS IN THE EARLY
ISLAMIC WORLD
Project Description
Michael Penn, Professor of Religious Studies
This project stems from the world’s largest alumni newsletter: in the mid-9th century, Thomas, the East Syriac Bishop of Marga (a region in modern day Iraq), decided he would collect as many stories as he could concerning those who graduated from his home-monastery of Beth Abhe. Titled The Book of Governors, the resulting hagiography runs 685 pages and has just shy of 500 characters. It contains a treasure trove of information on topics ranging from Christian-Muslim relations to medieval economic history, ecclesiastical politics, and ancient pilgrimage routes. In recent years, humanists have increasingly applied techniques associated with social network analysis to historical sources. Social network analysis is a set of visualization and quantification tools that helps scholars study and display how groups are structured and group members interact. Despite its utility, it has rarely been applied to pre-modern history. The Book of Governors makes for a particularly intriguing and productive case study for pre-modern social network analysis. It is an amalgamation of evidence for what we’d consider historically plausible interactions (e.g. well-known abbots, caliphs, and theologians) alongside those we’d consider less plausible (e.g. teleporting trees, petrified dragons, and, in one case, a temporarily resurrected dog).
Spatializing Text-Based Interactions


Thomas Worth
The Book of Governors contains a dense web of characters. Previous interns on this project had built a database to catalogue their interactions with one another (Figure 1).

My primary task was to apply social network analysis methods to study the interconnections in the already-compiled historical textual data. Using Gephi and Cytoscape softwares, I analyzed interactions between particular characters and locations (rather than between characters) and produced a bipartite graph to visualize the resulting network. This type of graph is not often used in textual network analysis but proved productive for our project goals (Figures 2 and 3).

19 | Center for Spatial and Textual Analysis (CESTA) at Stanford University
RESEARCHER
Pauline Arnoud
STUDENT
Figure1:TheBookofGovernors,oursourcetext,withnamesofpeopleandplacescircled,nexttoascreenshotofaspreadsheet cataloguingthisdataandthetypesofinteractionsbetweenpersonandplace.
SUAC: WOMEN IN PROVENANCE cesta.stanford.edu | 20
Figure3:AscreenshotoftheonlineStoryMapexhibit“WomenintheWorld”,whichwaslaunchedinOctober2021.
The bipartite graph allowed us to produce two new networks, each consisting of nodes characterized by one type of data from our original network: i.e. either people or places (Figure 4). Finally, we successfully overlayed our more abstract network of people and places onto maps from Google Earth to create a geographic visualization (Figures 5 and 6).


STUDENT RESEARCHER 21 | Center for Spatial and Textual Analysis (CESTA) at Stanford University
Figure5:AscreenshotoftheGoogleEarthoverlaywhichaddsgeographicalspecificitytoour abstract network of people and places from the Book of Governors.
Thomas Worth cesta.stanford.edu | 22
Figure6:AmoregranularviewofnetworkconnectionslaidoverwithGoogleEarth.
Figure2:TheinterfacefornetworkvisualizationinGephi,oneofthe softwaresweusedtocreatethebipartitegraph.
Figure3:Ourbipartite(personandplace)graph visualizingthenetworkofpeopleandplacesfromBook 2 of the Book of Governors.
SOCIAL NETWORKS IN THE EARLY ISLAMIC WORLD
Figure 4: This graph highlights how limiting the nodes (thepointsinthenetwork)toplaces,ratherthanplaces and people, alters the overall shape of the network (comparedtoFigure3).
THE GLOBAL
MEDIEVAL SOURCEBOOK
Project Description
Kathryn Starkey, Professor of German Studies, and Mae Velloso-Lyons, PhD Candidate in Comparative LiteratureThe Global Medieval Sourcebook (sourcebook.stanford.edu) is an open-access resource for teaching, learning, and research. It presents medieval texts in their original language and in new English translations, complemented by new introductory materials. Our collection spans one thousand years (600-1600) of literary production from around the world and contains nearly 200 texts in a wide variety of genres, almost all of which have never been translated into English before. For teachers and students, the project provides curated collections of medieval texts for classroom use and course reading. For scholars and the broader public, the project fosters deeper engagement with medieval cultures in their rich geographic diversity. This summer was especially busy as we prepared many texts for publication ahead of launching a new version of our site.

Translating the Prayers of Medieval Mothers
Runqi ZhangMy time on this project included encoding texts for digital publication, designing print-ready versions of texts to be easily read offline, and translating medieval Latin texts for the collection. I’m especially proud of the three Latin texts that I translated (Figure 1).
Bringing Chinese Song Lyrics to New Audiences
Dante ZhuIn addition to making print layouts and encoding texts for digital publication, I spent much of my time with the Global Medieval Sourcebook translating a collection of ci (a genre of lyric poetry and song from the Chinese Song dynasty). I’m very happy that translations of ci by Chinese poets Liu Yong, Yan Jidao, Yan Shu and Su Shi are now polished and available on the site for anyone to read. With the help of my project leader Mae, I refined previous translations of these songs and added notes to help readers who are new to the genre understand the sociocultural context of imperial China (Figure 3).
I also researched and wrote introductory material for the ci genre as well as biographies for its poets. Several years ago, I was really intrigued by Song-era ci, but when I came to the U.S. for college, the opportunity to read and work on these texts went away. Thanks to the GMS project, I was able to return to the ci poetry I love and introduce this amazing genre to a wider audience. Most of the ci we worked on focus on the theme of love and desire, but with significant differences from contemporary European courtly poetry—in, for example, the ambiguity of the speaker’s persona or the expected emotional expressions of different genders.

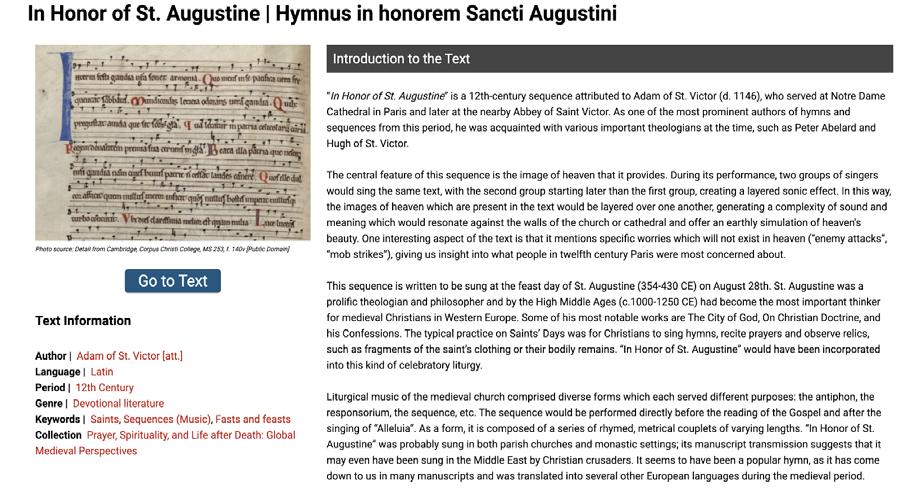
I had previously worked for the Global Medieval Sourcebook during my freshman summer, when I was tasked with transcribing and translating a Latin hymn dedicated to St. Augustine. I had run out of time to complete it then, but this summer, I went back to my translation and was excited to use my much-improved Latin to finish and strengthen it. I worked closely with my project leader, Mae, to edit my translation of the hymn as well as the introductory material for publication in the GMS (Figure 2).
I also produced and published translations of two Latin texts on childbirth: a twelfth-century medieval charm and a fourteenth-century medieval prayer. I had first translated these unusual texts, which give us rare insight into the hopes and fears of medieval women, when I was in high school. But with Mae’s help I made significant improvements to my earlier translations and corrected various transcription errors. I also wrote introductions for both to help new readers understand their significance.
The different backgrounds of the project team gave us a variety of perspectives on the material, and I enjoyed exchanging ideas and gathering our observations in the introductions to the texts.
cesta.stanford.edu | 24
Figure 3: One of the ci displayed with translation and critical notes on the GMS website.
23 | Center for Spatial and Textual Analysis (CESTA) at Stanford University
Figure1:ThehomepageoftheGlobal Medieval Sourcebook website showing three Latin texts translated by Runqi Zhang.
CESTA RESEARCH ANTHOLOGY 2021
Figure2:Theonlineintroductiontothehymn“InHonorofSt.Augustine”.
URBAN STUDIES AND PRACTICE OF THEORY
Building Resources for Teaching and Learning
Runqi Zhang, Dante Zhu, Salma Kamni

The work we did this summer gave us a better understanding of the Global Medieval Sourcebook project as a whole. From designing the templates for Arabic and Hebrew print layouts to choosing fonts for different languages, we learned new methods and created new standards (Figure 4).

The texts incorporated in the GMS were never widely available, and so their publication on our website and their availability as PDFs will make it easier for students and teachers to use them in classroom settings. Not only will college students be able to encounter a wider array of medieval primary source material, but younger students interested in the Middle Ages now have the chance to start their learning journey on our website.
STUDENT RESEARCHERS
Project
Description

 Ato Quayson, Professor of English
Deploying an interdisciplinary approach that draws on geography, anthropology, archival and historical research, as well as perspectives from literary criticism and cultural studies, this project refocuses the discussion of Accra, New York, London, and Hong Kong in ways that have so far gained scant attention. We marry theoretical concepts to everyday research practice by attending to the relationships between high streets and business districts, street life, spatial morphologies, and the character of inequalities that are inextricably entangled with these cities. We study how high streets and other urban phenomena intersect with various elements and vectors of urban life such as restaurants, ethnic food stores, transport systems, parks, and the real estate market, among other phenomena, even when these do not appear to be obviously related to one another in the first instance. The project also has an interest in the apparent messiness of migration and settlement for understanding the different ways in which globalization has been sedimented in these cities in the 20th and 21st centuries. The project aims at a full-spectrum and multi-scalar approach to cities, starting from high streets and their adjacent neighborhoods, and expanding in concentric circles to embrace other urban phenomena.
London, New York, and the Histories of High Streets: A Comparative Analysis
 Audrey Ward and Shayana Venukanthan
Our team did a comparative analysis of the history and evolution of high streets in London and New York. By extracting and cataloging information about place-types from online maps and databases, we traced the history of these two metropolises through the evolution of iconic streets in each city, namely Oxford Street in London and its adjoining areas, and Fifth Avenue and Bleecker Street in New York. Through this comparative analysis, we have identified connections between the histories of these high streets and their present-day place in the makeup of each city.
We began our investigation into urban landscapes by focusing on Oxford Street in London, Europe’s busiest shopping street. Using OpenStreetMap and Open Refine, we collected data on the numerous shops lining
25 | Center for Spatial and Textual Analysis (CESTA) at Stanford University
Figure 4: Page layout for the print version of “A Monstrous Courtship” done in Adobe InDesign and published on the website.
Dante Zhu
Runqi Zhang Salma Kamni
cesta.stanford.edu | 26 Figure1:ExampleofahistoricalmapofLondonthatweusedtotracethe
development of the city’s districts over time.
this major thoroughfare and classified them according to their merchandise and size—clothing, department, shoes, jewelry—allowing us to analyze street trends and provide a baseline for historical research on the area. From this baseline, we conducted deep research into the history of the area. The result was an historical arc showing how an area known as Tyburn Gallows, where prisoners were publicly hanged, developed into a world-class shopping district home to some of the best-known luxury shops and brands. We extended our analysis by compiling historical maps of London (Figures 1 and 2) to trace the physical development of this area from an agricultural to a residential and then to a commercial district. We have begun investigating Regent Street, another major shopping street in the West End, using the same methodology to compare its development to that of nearby Oxford Street.
Following our research on the high streets of London, we pivoted to New York to apply the same digital historical methods to Fifth Avenue and Bleecker Street. We have since expanded our research to other areas of the city, studying the high streets in Chinatown, Harlem, and the Lower East Side in Manhattan, as well as those in Queens and Brooklyn. We used OpenStreetMap and Open Refine to collect disaggregated data on the types of business on these streets and classify various place types: restaurants, grocery stores, museums, jewelry stores, and boutiques, among others. We also collected US Census data to identify the current ethnic and socio-economic makeup of the population in each region, creating baseline descriptions of the urban areas of interest. While collecting this data we investigated the historical background of the respective neighborhoods, often pinpointing events or phenomena that proved essential to the historical evolution of the areas. More specifically, we explored the history of sports teams, government development and consolidation, religion and religious institutions, epidemics and tenement housing, emigration and immigration, and slave revolts, connecting regional histories with the trends we identified in present-day OSM and US Census data. We then compiled our historical research and digital analyses into portfolios for each high street in the neighborhoods we studied, replicating the method we used to study Fifth Avenue. Ultimately, the portfolios enabled us to perform a comparative analysis of these distinct regions in New York, shedding light on the


diversity of experiences in this complex and vast metropolis.


Our ongoing comparative analysis of London and New York City points to the methodological value of using the historical development and composition of high streets to shed light on their present-day place in the fabric of their cities. By pairing spatial and census data with deep historical research, we have been able to construct a detailed depiction of the changes to these streets since their inception, identifying them as sites of migration, inequality, opportunity, and globalization.


 Figure 6: This data table is another example of urban spatial and census data, identifying places of worship in different areas of Manhattan.
Figure 4: A historical map of New York City. Maps like this were important primary sources for our studyofthecity’schangingurbanlandscape.
Figure2:ExampleofahistoricalmapofLondonthatweusedtotracethedevelopment of the city’s districts over time.
Figure3:Thismapprovidesaglimpseintohowwecombinedourhistoricalmethodsanddigitaltoolstoproducenewinsights into the historical and present-day composition of high street neighborhoods. In this particular map, place types have been identifiedandmappedalongOxfordStreetinLondon.
Figure 5: This data table is an example of urban spatial and census data that we compiled for particular New York neighborhood. It shows the racial and ethnic breakdown and density of a subset of Manhattan districts.
Figure 6: This data table is another example of urban spatial and census data, identifying places of worship in different areas of Manhattan.
Figure 4: A historical map of New York City. Maps like this were important primary sources for our studyofthecity’schangingurbanlandscape.
Figure2:ExampleofahistoricalmapofLondonthatweusedtotracethedevelopment of the city’s districts over time.
Figure3:Thismapprovidesaglimpseintohowwecombinedourhistoricalmethodsanddigitaltoolstoproducenewinsights into the historical and present-day composition of high street neighborhoods. In this particular map, place types have been identifiedandmappedalongOxfordStreetinLondon.
Figure 5: This data table is an example of urban spatial and census data that we compiled for particular New York neighborhood. It shows the racial and ethnic breakdown and density of a subset of Manhattan districts.
RESEARCHERS
Shayana Venukanthan
STUDENT
cesta.stanford.edu | 28 27 | Center for Spatial and Textual Analysis (CESTA) at Stanford University
Audrey Ward
GLOBAL URBANIZATION AND ITS DISCONTENTS

Project Description
 Zephyr Frank, Professor of History; Erik Steiner, Codirector of the Spatial History Project; and Leo Barleta, Postdoctoral Research Fellow in History
Over the last several decades, millions of people have migrated from rural villages and towns into urban contexts. Today, cities hold over half of the world’s population. The growth of cities has been accompanied by an astonishing surge in land values and housing costs, driving housing prices upward and crowding out low-income residents. Our project is a multi-institution, NSF-funded collaboration investigating the spatial and temporal dynamics of property, rent, and displacement in the 20th century. We focus on a variety of world cities together with their hinterlands. This summer, we studied the process of urban sprawl in Latin America and its relation to changing patterns of land use, zoning regulations, and distressed landscapes. In the past five decades, Latin America has shifted from a predominantly rural society to the world’s most urbanized region. Using GIS and Computer Vision, we analyzed remote sensor and street level imagery of Guadalajara (Mexico), Belo Horizonte (Brazil), and Curitiba (Brazil) to understand how expanding cities contribute to urban vulnerability and produce distressed landscapes.
Visualizing Privacy Bias
Julia Hernandez and Arushi GuptaIn early spring, we began work on the Privacy Bias project, using computer vision analysis of Google Street View (GSV) to determine how class shapes privacy. “Privacy bias” refers to residents of wealthier neighborhoods maintaining a greater degree of privacy in GSV images than residents of poorer neighborhoods. Our initial efforts to categorize images of residential areas as “private” or “exposed” raised a litany of questions about expectations of privacy in the age of GSV. For example, how should we tag an image of a home with a fence tall enough to block the view of passersby, but too short to shield the house from the perspective of the GSV camera? We chose to define privacy from two viewpoints—that of a hypothetical passerby on the street and that of the GSV camera—so that we could capture the difference between intrusive GSV photography and an exposed home. In the latter case, we identified several features indicating whether a house is “private” or “exposed”: e.g. foliage blocking the view of a house indicates privacy, while streetfacing windows through which someone could look into the house indicate exposure.
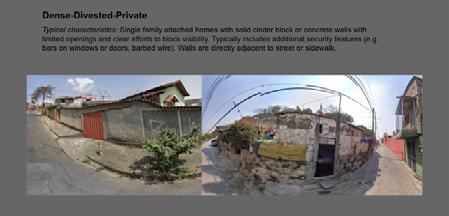
In the next phase of our work, we created a reliable training set. We sifted through hundreds of images, categorizing them as private or exposed to passersby vs. private or exposed to GSV. As we began tagging, certain patterns of privacy emerged based on neighborhood investment and density. Houses in “invested” neighborhoods tended to be hidden by lush foliage and separated from the street by a gate or long driveway, while houses in divested neighborhoods often relied on makeshift methods of maintaining privacy, such as cinder block walls (Figure 1).


It was challenging to tag enough images for a reliable training set, and we ultimately shifted to a narrower definition of privacy selecting homes that were occluded from GSV altogether. This
change allowed us to train a computer-vision (CV) system that tagged residences in Philadelphia, Raleigh, Indianapolis, Phoenix, and Seattle as either “occluded” or “exposed.” Combining our CV model with census data, we plotted block-level averages for occlusion and exposure against census variables like median household income and median household value. The results highlight the relationship between wealth markers and levels of privacy (Figures 2 and 3).


cesta.stanford.edu | 30
Figure 2: Scatterplots showing the average level of “exposed” (left) and “occluded” (right) tags against the median household income in Philadelphia residential blocks. As income rises, more households are “occluded” and fewer are “exposed”.
Figure 1: Three privacy/exposure archetypes. Clockwise from top-left: “Sparse-Invested-Private”; “Dense-Invested-Private”; “Dense-Divested-Private”; and “Dense-Divested-Exposed.”
29 | Center for Spatial and Textual Analysis (CESTA) at Stanford University
Border Cities Project


Our work this quarter focused on understanding the growth of the maquiladora industry— manufacturing plants located in Mexico close to the US-Mexico border but owned by foreign entities and making products for export. Using mapping tools and data visualization, we hoped to understand the role of this type of industry in the urbanization of Ciudad Juárez prior to and during the privatization of ejidos (farming communes unique to post-revolutionary twentiethcentury Mexico), shown in Figure 4.
We began by searching JSTOR and Proquest for newspapers listing the names of maquiladoras in the Juárez area. We created a table of maquiladoras near the city from 1970 on with their approximate locations. However, we soon realized we needed their precise locations to make a more concrete historical argument. We found an online directory (infomaquila.com) that stored maquiladora addresses, and used the package RVest to create a web scraping tool which quickly compiled and organized all the data on the website into a CSV file. We then proceeded to visualize this data as a map, searching for a trend or pattern linking the maquiladoras to neighborhoods and areas that had been part of ejidos (specifically Zaragoza, Senecú, and Salbarcar). After formatting the data so that it could be imported into MMQGIS, we attempted to geocode each maquiladora’s address. Initially, we tried to use OpenStreetMaps, but we found that Google Street Maps was better equipped to handle the lack of uniform formatting in the dataset. Ultimately, we managed to geocode the majority of the addresses and generate an informative map (Figure 5).


STUDENT RESEARCHERS


cesta.stanford.edu | 32
Figure4: CiudadJuárez’surbanareaintheyears1975,1990,2000,and2014,withsubstantialgrowthoccurringespecially between 1975 and 1990.
Figure5:Left-to-right:anearlierandlateriterationofvisualizingmaquiladoralocationdata.Thesparsenessofthefirst mapisduetoourinitialdifficultygeocodingmanyoftheunformattedaddresses.WeresolvedthischallengeinGoogle Street Map to create the dense map on the right.
31 | Center for Spatial and Textual Analysis (CESTA) at Stanford University
Julia Hernandez Arushi Gupta Sahir Qureshi Michael Zhu
Sahir Qureshi and Michael Zhu
GLOBAL URBANIZATION AND ITS DISCONTENTS CESTA RESEARCH ANTHOLOGY 2021
Figure3:Hexbinplotsillustratingthedistributionof“exposed”(left)and“occluded”(right)tagsthroughoutPhiladelphia.
THE LITERARY LAB
Project Description
Mark Algee-Hewitt, Assistant Professor of EnglishThe Stanford Literary Lab is a research collective that combines computational methods of textual analysis with critical inquiry to investigate questions of interest to scholars in literary studies and across the humanities and social sciences. The lab is currently engaged in over 16 active projects which are supported by over 25 collaborators. While much of our work focuses on using computation to explore patterns of language in corpora of literature, through our collaborations we have brought our methods to bear on fields as diverse as economics, international law, and medicine. This year our undergraduate researchers made major contributions to a number of projects, including Tracing Author-Reader Collaboration in Fanfiction. We encourage you to visit our website (litlab.stanford.edu) to learn more about our research and publications.
Tracing Author-Reader Collaboration in Fanfiction
 Regina T.H. Ta and Natasha Johnson
Over the past three quarters we have explored two aspects of fanfiction: the genesis and evolution of different genres in fanfiction and the role that author-reader collaboration plays in its production. The popular Harry Potter series and its related fanfiction provided us with our primary text corpora.
In winter quarter we asked whether certain genres of Harry Potter fanfiction allowed for more communal authorship than others. We first mapped genre-category tags for each fanfic story from 2000 to 2016. These category tags accurately reflected reader engagement, and we found that romance was consistently the most popular genre among the fanbase. In fact, writers tended to pair other genres, such as comedy or drama, with romantic storylines (Figures 1 and 2).

Wondering if there was correlation between prevalent genres and fanfiction collaboration, we measured “uptake,” or the degree to which an author incorporates suggestions and comments by readers. We brainstormed examples of explicit “uptake” markers, such as references to Harry Potter terminology, tropes, and plot events, and then built wordlists that included key themes,

cesta.stanford.edu | 34
Figure2:Fanfictionwritersofothergenres,suchasdrama(shownhere),mutuallytagtheirstoriesmostoftenwithromance(in thiscase,dramafanfictionstoriesalsotaggedasromanceareshowninthefourthrow).
Figure3:Awordlistorganizingterms,types,anddefinitionsfromtheonlineHarryPotterglossary.
33 | Center for Spatial and Textual Analysis (CESTA) at Stanford University
CESTA RESEARCH ANTHOLOGY 2021
Figure 1: The prevalence of each genre in the corpus over time. Romance (pink) consistently dominates, peaking in 2011. Two other genres, adventure (dark blue) and drama (light blue), are well represented through time.
character traits, character nicknames, and romantic pairings from the “fanon” (fandom canon). Graduate researchers also compiled wordlists of spells, magical objects, and settings that appear in the series (Figure 3).
The next step in determining the extent of author-reader collaboration in the Harry Potter fanfiction community was to parse our corpus with these wordlists. By recording instances in
e.g. for the term “Harry Potter,” the program counted how frequently “Harry,” “Potter,” and “Harry Potter” occurred. With these results, we generated CSVs detailing every possible n-gram and its count in each novel. We have three sheets for n-grams based on the three wordlists we had built: the Bloomsbury Glossary of Harry Potter terms, themes throughout the Harry Potter series, and terms from the Harry Potter card games (Figure 4).


Enumerating how often certain words appeared in the novels raised interesting questions for potential comparison to Harry Potter fanfiction. For example, “wizard” occurred in the novels over twice as frequently as “witch,” whereas “witchcraft” occurred more frequently than “wizardry.” We wondered about the significance of this finding. Did it mean that men (wizards) were spoken about because of who they were, whereas women were spoken about because of what they did (witchcraft)?
How would the occurrence of these words in fanfiction compare to their occurrence in the novels?

Could differences between the two corpora tell us something about the specific values held by fanfiction writers?
Our summer work began to engage these kinds of questions. To
compare the frequency of words in the Harry Potter novels to their frequency in fanfiction (and across different genres of fanfiction), we wrote a program that would read a .txt file and export a list of every word that occurred in the file together with its frequency (Figures 5 and 6).
While coding together in Google Colab, we did run into challenges related to data cleaning (persistent indents and random punctuation marks) and compiling (due to moving between different computers and software). Having identified these issues, we’ve decided to modify the code so that, instead of taking in the novels as input, it takes in an entire fanfiction database. This will give us the information we need to analyze and compare the frequency of key words in the Harry Potter novels versus their fanfiction.


which uptake terms appeared in the comment section before they appeared in a fanfiction story, we could measure the extent to which a fanfiction author was inspired or influenced by reader comments. We began by breaking down terms in the wordlists into the smallest n-grams we could possibly use to accurately find instances in which the term occurs. To do this, we collaboratively wrote a program in R that took all the terms, broke them into every possible combination of n-grams, and counted how frequently each of these n-grams occurred in the Harry Potter novels—
STUDENT RESEARCHERS
 Figure 6: Code written to clean the data and extract ngrams.
35 | Center for Spatial and Textual Analysis (CESTA) at Stanford University
Natasha Johnson Regina T.H. Ta
Figure 4: An Excel sheet generated by running our code on a list of terms from one of the Harry Potter card games. It shows how frequently the possible n-grams of all list terms appear in the Harry Potter novels.
THE LITERARY LAB cesta.stanford.edu | 36
Figure 5: Input text from the Goblet of Fire
RUMSEY MAP CENTER:
CHEROKEE HISTORY
Project
Description
Mapping practices have traditionally erased or ignored the Cherokee people, their language, and their conceptions of land and place. This exhibition, which will open at Stanford University and then at Western Carolina University in Cullowhee, NC (next to the lands of the Eastern Band of Cherokee Indians) examines how maps can nevertheless be read within an indigenous framework to trace Cherokee placemaking, unearthing the ways the tribe has created, maintained, and reclaimed Cherokee spaces and landscapes throughout time.
Mapping Indigenous History: Visualizing Changes in Cherokee Land
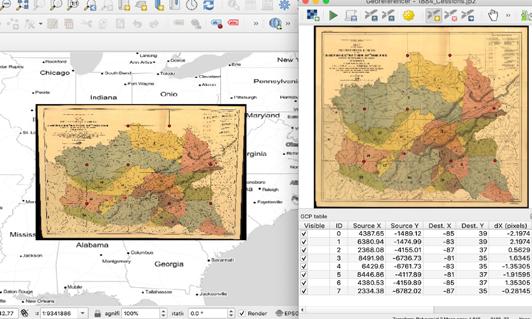


Miraclestar Doby
highlighted misconceptions about the dynamic nature of settlements, names, and borders, which tend to appear as deceptively static on maps. This table helped us understand some of the key Cherokee settlement patterns during the 18th century. Because borders are not always clearly outlined, this data was critical in understanding the general shape of the territory and the role of placemaking in Cherokee history.

While most histories of the Cherokee focus on the Trail of Tears, this exhibition presents a larger view, beginning with the pre-colonial landscape, through the aftermath of the removal crisis of the 1830s, to today. To present the information in a way that both honors and centers the Cherokee worldview, and to highlight the way language, place names, and maps were and continue to be used as tools of power, the exhibition is presented in the Cherokee language with a full English translation. As one of only a handful of exhibitions presented in the Cherokee language, the project expands language revitalization efforts into new realms, creating content with which to engage Cherokee speakers and language learners, while simultaneously bringing in new audiences.
As this project’s first CESTA intern, I helped research both the content and the technologies involved in constructing the exhibit. We began by searching for a better understanding of how the history of Eastern Band Cherokee Indians interacts with our perception of various land maps. We compiled and read several texts outlining significant points in Cherokee history, especially the formation of the Eastern Band in modern North Carolina. In light of what these preliminary investigations revealed, we looked to other mappings of indigenous land to see how other authors have visualized the dynamism of Cherokee land (Figure 1).
Guided by our preliminary research, I looked into the best tools and approaches to build our final product. We were grateful to receive immense support from David Medeiros at the Stanford Geospatial Center with our use of QGIS (Quantum Geographic Information System) to create an interactive visualization of a changing landmass. Fortunately, our team had already curated a number of maps from the David Rumsey Map Collection, Library of Congress, SearchWorks, and elsewhere. It took detailed work to learn how to utilize the georeferencer, identify coordinate reference systems (CRS), extract data points from maps, and create new shapefiles (Figure 2), and I was aided in this process by skills sharpened in Stanford Geospatial Center workshops.
this
37 | Center for Spatial and Textual Analysis (CESTA) at Stanford University
Constance Owl, Assistant Director of Admissions and Member of the Eastern Band of Cherokee Indians
cesta.stanford.edu | 38
Figure 1: Betty Smith’s “Distribution of Eighteenth-Century Cherokee Settlements”
Figure 2: This 1884 Land Cessions map from the Library of Congress (left) shows former territorial limits of the Cherokee “Nationof”Indiansandprovidesdetailedinformationaboutthelandcessiontreatiesandtheirdatesforeachparcelofland. TheimageontherightshowsthesamemapgeoreferencedontopoftheStamenTonerLitebasemap.Therealchallengein thisprocesswasdecidingthepropercoordinatereferencesystem(CRS)forthegeoreferencingprocessandthebasemap;in
case, we have settled on using WGS 84.
One ongoing challenge lies in identifying critical maps that will create the most effective visualization. Many early 18th-century maps do not have rigid borders for Cherokee land, making it difficult to digitize the shape of the landmass. On the other hand, we have maps from the late 19th century that clearly outline the Cherokee cessions to the United States. We hope to harness our collective knowledge of Cherokee history and determine what is necessary in creating an interactive time-based visualization (Figures 3-4).

AFTERMATHS
OF ENSLAVEMENT
Project Description
Grant Parker, Associate Professor of ClassicsHow might we understand the experiences of enslavement at the Cape of Good Hope in the long 18th century, and what are its legacies? As an exercise in commemorative justice, this project distills narratives out of court documents involving enslaved persons (1704-1795). Our goal is to republish the selected legal documents online in such a way that provides readers with rich context, including maps and other images. We especially seek to make our website a publicly available resource that can be used by school learners, teachers, students, tourists alike—in fact by anyone interested in histories and legacies of enslavement, in South African settings and beyond.

A Blueprint for Building a Digital Database of the Trials of Slavery
 Anthony Bui, Kiana Hu, and Juna Nagle
This past summer, we created a database (Figure 1) for a collection of 87 trials contained in the Trials of Slavery (Figure 2), a collection of Dutch court documents from South Africa during the 18th century that will eventually become an interactive index publicizing the contents of the trials to a wide audience.
 Miraclestar Doby
STUDENT RESEARCHER
cesta.stanford.edu | 40
39 | Center for Spatial and Textual Analysis (CESTA) at Stanford University
Figure1: CompilingandcleaningdatafromTrialsofSlaveryconstitutedourprimaryworkoverthesummer.We initially processed 10 trials but ultimately altered our database structure as the sources required. For example, a trialinvolvingnumerousdefendantsrequiredustoorganizethedataaroundobjecttype,asseenhere.
Figure 3: This visualization provided by Native-Land.ca uses overlapping colors to represent theCherokee—includingtheEasternBand—landwearefocusingon.Weusedthisapproach asalaunchingpointforourownideasonhowtoaddressundefinedborders.
RUMSEY MAP CENTER: CHEROKEE HISTORY
Figure 4: This image illustrates our preliminary animation progress: the black polygons demonstrate land loss and colonist encroachment, while the white polygons represent the surrounding indigenous and unceded lands.
The original documents in the Cape Town archives are in Dutch, so we mined our data from the English translations provided by the authors of the book.


We first formatted our database with two tabs—one for categorical data (trial date, location, documents, defendant name, etc.) and one for more descriptive or varied data (materials listed, people referenced, notable details, etc.)—and implemented an ID system for the court cases and the individuals involved.

(1713),BarryRuderman Map Collection, courtesy of Stanford University Libraries, http://purl. stanford.edu/ts604gp4655

While we collected this data by combing through the text manually, we also used software to help compile and sort the various fields for which we searched. In order to utilize this method, we first had to separate Dutch and English versions of the cases from one another (Figure 4). One challenge while working across the two languages was the task of separating the footnotes that the authors had written from each translation of the text. The footnotes were uniquely connected to both the Dutch and English text with no way to save the corresponding text while leaving one language out. In the end, we had to manually convert the footnotes into endnotes and copy them into a relevant Dutch or English document as plain text. Because we worked on this aspect of the project near the end of our summer period, future researchers will need to connect each of the notes to their respective contexts while also translating the Dutch to ensure they relate to the correct words within the documents.
STUDENT RESEARCHERS


AFTERMATHS OF ENSLAVEMENT cesta.stanford.edu | 42
Figure2:TrialsofSlavery,editedbyNigelWorden and Gerald Groenewald. It contains 87 selected and unique trials from the Dutch archives that provideaglimpseintotheconditionsof18thcentury Cape slavery and includes introductions and footnotes on all the trials.
41 | Center for Spatial and Textual Analysis (CESTA) at Stanford University
Figure 3: Van der Aa’s map of the Cape of Good Hope, published in 1713, gave us a reference to isolate locations mentioned in the trials. It also allowed us to identify various specific farms and estates unavailable with modern day references. Pieter van der Aa, Le Cap de Bonne Esperance suivant les nouvelles observations
Juna
Figure 4: This side-by-side view shows how we operated between the electronic text taken from TrialsofSlavery(left)andtheoriginalcourtdocumentsfromtheDutcharchives(right).
Nagle
Kiana Hu Anthony Bui
COMPUTATIONAL
BORDER STUDIES
Project Description
Bridget Algee-Hewitt, Senior Research Scientist at the Center for ComparativeStudies in Race and Ethnicity

This project combines critical race and social justice theory with novel computational methods to study the urgent problem of bias within the U.S. court system. Using court transcripts, we reveal latent trends that govern judicial decisions, and which may ultimately disadvantage certain communities and peoples. Variation in asylum adjudication outcomes across U.S. immigration courts is well-documented, and personal factors are known to play observable (often compounding) roles that exacerbate discrepancies. These disparities suggest that outcomes are less dependent on the facts of the case and more on circumstances surrounding the hearing, including the beliefs and actual or ascribed characteristics of the participants.
Counter-Surveilling the State
 Brooke Tran
To determine whether the difference in COVID outbreaks between ICE detention facilities and the surrounding population were notable, I performed multiple Welch Two Sample t-tests to assess whether the differences in the mean case rate and death rate were statistically significant (p < 0.05). Statistical significance in this context would indicate that the difference in means between the two groups was unlikely to be by chance, given the distribution of the data. In other words, we can say with 95% confidence that the difference in outcomes between the two populations was the effect of a driving factor and not randomness in the data.


First, I observed the entire sample population of ICE facilities across 27 different states in the U.S. and the surrounding county populations. The results of the initial t-test show that there is a statistically significant difference between both the case rates and the death rates for these two populations.
We found in the national sample population that in ICE facilities, the case rate is higher than in the surrounding county population. However, the death rate is lower in these facilities. Following these results, I looked more closely at two individual states for which there are substantial data to perform t-test analyses: Texas and Georgia. Based on further Tableau analysis, these states’ detention facilities were COVID hotspots relative to other states in our data (Figure 1).
In both Texas and Georgia, we found that the detention center population saw a higher rate of COVID cases compared to the surrounding population, but a lower death rate, which is consistent with our findings in the national sample. The results of these t-tests demonstrate that COVID outbreaks impact the detained populations at a higher rate, likely due to the overcrowded and unsanitary conditions within these facilities. However, this population has a higher survivability rate compared to the surrounding county populations. Further research is needed to determine how the demographics of this detained population (i.e. race, age, health indicators) influence the likelihood of surviving an infection, although limitations in the data currently prevent this analysis.
Some of these limitations in the data are related to the composition of the two sample populations we analyzed. We anticipate that the data obtained through the ICE.gov website do not accurately capture the full extent of COVID outbreaks and deaths within detention facilities, whether because of inconsistent reporting across facilities, the timeliness of this reporting, or other factors. Such errors compromise the reliability of our results and the conclusions we can draw. For the populations surrounding the detention facilities, we utilized county-level COVID data collected by the New York Times. In our t-test analysis, we compared the detention facility population to the population of the state as a whole. We tried to gather data for only the counties encompassing each specific facility to control for demographic composition and local-level policies that influence COVID spread and death rates.
STUDENT RESEARCHERS

cesta.stanford.edu | 44
Figure 1: Visualizing COVID case counts using proportional mappingallowsustoseetheconcentrationofCOVIDcasesat ICE facilities across the United States.
Brooke Tran
43 | Center for Spatial and Textual Analysis (CESTA) at Stanford University
Figure 2: Welch sample t-test screenshots for Texas and Georgia. These tests demonstrated that the higher rates of COVID in ICEdetentionfacilities,ascomparedwithcaseratesinthesurroundingpopulations,werestatisticallysignificant.
QUARANTINE

Project Description
Nelson Endebo, PhD candidate in Comparative Literature; Ellis Schriefer, PhD candidate in Iberian and Latin American Cultures; and Farah Bazzi, PhD student in HistoryLife in Quarantine (liqproject.org) is an online community platform that addresses the transformations we are experiencing in the age of COVID-19. At the core of the project, we have an open, online historical archive that houses personal written accounts in a wide range of languages from various countries. These stories document how the COVID-19 pandemic is changing the lives of people from various backgrounds across the globe. Additionally, our website provides a space for different types of creative expression: personal stories, creative writing, blogs, and visual art. Our website is designed as an open education resource for students, educators, governments, organizations, and businesses to promote cultural solidarity and global interconnectedness with inclusivity at its center.
Outreach and Expansion
Ariana Davarpanah
My tasks for Life in Quarantine this year included curation of the Words in Quarantine page, outreach and planning, and recruitment for and oversight of the site’s social media. Words in Quarantine, which features stories submitted by writers from around the globe, has grown immensely since last year, and we now have 75 different authors up on the site! We have also expanded the types of submissions we receive and the countries of origin, which now include Kenya, India, Nepal, Pakistan, Zimbabwe, and many others (Figure 1). I have continued to brainstorm ways to further broaden our submission sources, and we soon plan to incorporate targeted outreach to schools and literary communities both within the U.S. and internationally, as well as increased submission calls on social media.

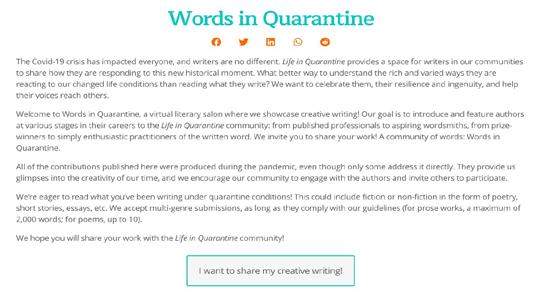
I have also recruited several wonderful volunteers to assist LiQ in the expansion of its social media presence. We have made a shift on our Instagram, Twitter, and Facebook from template-based posts to photos and art that allow viewers to better identify and interact with our posts (Figure 2). We hope to drive greater and more varied traffic to the site so that our online archive may better represent the many ways in which the world witnessed this global pandemic.
As public perception of the pandemic has changed, Life in Quarantine has started shifting to increase the role of previously published authors and expanding Words in Quarantine to include interviews and videos. As a team, we have also begun to put more focus on the Teaching Quarantine initiative, as it seems that remote learning may continue in the pandemic’s aftermath. As was the case in previous quarters, the purpose of all my tasks has been to document the real, lived experiences of individuals while simultaneously creating a space for creative expression in a time where it is so badly needed. I’m excited to continue my work with LIQ as the project enters a new phase.

LIFE IN
45 | Center for Spatial and Textual Analysis (CESTA) at Stanford University
cesta.stanford.edu | 46
Figure1:TheWordsinQuarantinehomepage(left)inviteswriterstosubmitworkscomposedaboutand/orduringthepandemic. Ourarchivecontinuestogrow,andthesubmissionmapfromJune,2021(right)demonstratesthevarietyofcountriesfromwhich we have received submissions.
Figure2:Amorephoto-basedapproachonsocialmediaaimstoconveythesame“realness”wepresentonourwebsite and helps drive traffic to the online archive.
Teaching Quarantine


Hannah Walton and Alana Mermin-Bunnell
This quarter, we focused on one of Life in Quarantine’s newer initiatives: Teaching Quarantine. This page is a place where teachers can share, comment on, exchange and adapt syllabi, assignments, activities, lesson plans, and ideas about how they are responsibly addressing the pandemic in classrooms (Figure 3). We interviewed Stanford faculty, including Professors Diana Thow, Glenn Fajardo, and Lars Osterberg; and students, including Om Jahagirdar, Hannah Joy, and Elijah Ezralow (Figure 4) and posted these interviews to the LiQ site. In addition, our Project Managers, Nelson Endebo, Ellis Schriefer, and Farah Bazzi, attended the Arizona Open Education Regional Conference where they conducted a workshop and presented a keynote about the LiQ project alongside our partner, professor and OE author Dave Dillon.

their
In addition to the new Teaching Quarantine page, we continued to maintain the rest of the LiQ site. This involved posting stories and submissions to our main archive, Art in Quarantine, and Words in Quarantine. We have also received many submissions from teens in high school through our collaboration with covid9teen, a site dedicated to the stories and experiences of teens during the pandemic. As the quarantine seems to be coming to a close, it is interesting to read submissions in which people reflect on the past year and express hopes for the future as the vaccine rollout continues. Be sure to check out the archive at liqproject.org/archive and to submit your own quarantine story at liqproject.org/submit-your-story.
STUDENT RESEARCHERS


47 | Center for Spatial and Textual Analysis (CESTA) at Stanford University
Figure 3: The Teaching Quarantinehomepage(below) invites educators to share how they are incorporating the pandemic into
pedagogy. The logos were created by our wonderfulgraphicdesigner, Alana Mermin-Bunnell. You can visit this page atliqproject.org/ teaching
LIFE IN QUARANTINE
Figure4:AscreenshotfromtheTeachers portionofthepage(above)illustrates how LiQ and its stories can become valuable classroom resources for Sociology students.
Alana Mermin-Bunnell
cesta.stanford.edu | 48
Hannah Walton Ariana Davarpanah
CESTA RESEARCH ANTHOLOGY 2021
Figure4:TeammemberAlanaMermin-BunnellinterviewedStanfordProfessorGlennFajardo,amongothers,aspartofLiQ’snew Teaching Quarantine initiative.
MODERNIST ARCHIVES
PUBLISHING PROJECT
Project
Description
Alice Staveley, Senior Lecturer of English
The Modernist Archives Publishing Project (modernistarchives. com) is a critical digital archive of early 20th-century publishing history. With rich metadata, the site displays, curates, and describes documents that contribute to the “life cycle” of a book. It uncovers the often invisible industry actors—editors, illustrators, reviewers, printers—who bring works into the public eye. The collection contains thousands of images from archives and special collections relating in the first instance to Virginia and Leonard Woolf’s Hogarth Press—letters, dust jackets, financial records, paper samples, illustrations, sketches, production sheets, and other “ephemera”—but is actively expanding into other presses, with the long term goal of building the infrastructure currently lacking in book historical studies to engage a comprehensive comparative landscape of 20thcentury book publishing.

Our newly digitized materials are presented with peer-reviewed summaries, biographies, bibliographical information, and other scholarly materials. A major project within MAPP, but not yet ingested into the operating system, is a large-scale transcription and data analysis project detailing all sales and purchasing records of the Hogarth Press, the first comprehensive quantitative and cultural historical project on the totality of a press’s sales history in modernist studies.

Making Sense of Missing Metadata

Malia Maxwell
For this project, I worked with Dr. Alice Staveley to assign metadata to folders of archived correspondence and materials from the Hogarth Press. We assigned dates, addresses, content descriptions, tags for related people and works, and recorded this information in spreadsheets. I worked remotely with scans of my materials, which are in the University of Reading’s Special Collections. The folders contained letters to printers and bookbinders, estimates for producing books, order forms for the books, letters requesting permission to excerpt from published books, along with many other types of correspondence and a few miscellaneous items. Most of the files I processed pertained to works published by Virginia Woolf, one of the founders of the Hogarth Press. My first and largest task was to process the Woolf folders that had images of their contents uploaded. I assigned metadata to the folders for A Room of One’s Own, Orlando: A Biography, The Voyage Out, “On Being Ill”, The Captain’s Death Bed, Night and Day, and Flush: A Biography, before moving onto other authors’ files—those of G. S. Dutt, C. L. R. James, Ray Strachey, and Viola Tree.
The items I was working with were not entirely uniform: some were typed, others hand-written, some in English, others in French or German. Items missing information presented some challenges. Some letters from the Hogarth Press were simply signed “Manager,” or not signed at all. For several of these, I was able to use a working list of Hogarth Press employees, which had been created for MAPP internal use, to identify the Hogarth Press Manager in the year a letter was written. Some letters were missing dates, and these I could not recover. For items not easily classified as correspondence—like sheets from order books, promotional materials, lists of publishing contacts, etc.—I consulted Dr. Staveley and Helena Clarkson (Special Collections, University of Reading) to determine how best to label them for the MAPP archive.
My spreadsheets will be reviewed and proofed, and then their information—along with the items they describe—will be uploaded to the MAPP website for public access.
This research is crucial to highlighting the processes that produce these specific texts and the Hogarth Press’ operations in general. Scholars can use the MAPP archive to support their own research, but this archive unravels the mysteries behind producing books for the general population as well.
In turn, this gives people new ways to understand books not as the culmination of just one person’s effort, but rather as the product of several parties’ collaboration. Moreover, for those who like to spend hours poring over historical letters and records, the MAPP research and archives are like a key to a time machine. To explore MAPP for yourself, visit modernistarchives.com.
49 | Center for Spatial and Textual Analysis (CESTA) at Stanford University
cesta.stanford.edu | 50
STUDENT RESEARCHER
Malia Maxwell
Figure1:MetadataforThe Captain’s Deathbed by VirginiaWoolf
Figure2:ThehomepageoftheModernistArchivesPublishingProject
CISTERN
Project Description
Adrien Zakar, Assistant Professor of History (University of Toronto), and Merve Tekgürler, PhD candidate in HistoryCISTERN is building a database and a virtual research space that bring together a wide range of geographical books, atlases, land descriptions, and maps in Turkish, Arabic, and English produced between the 15th and early 20th centuries. Initially rare artifacts, these objects gradually became part of everyday life, reflecting the rise of territorialized states, intensifying militarization, and sweeping capitalization of Middle Eastern economies. That Islamic geographers were instrumental in the transmission of classical spatial knowledge, such as Ptolemy’s Optics, to the European Renaissance is well known. Subsequent knowledge production, however, remains overlooked. Our database and virtual space will enable researchers to dive into this material, exploring the undercurrents of politics, economy, and culture from the perspective of objects such as atlases, compendiums, and maps. The searchable database incorporates existing bibliographical repositories, and is housed in a virtual space that has the basic architecture of a cistern, a calm underground space sustaining a bustling city. It includes an exhibit hall and a reading room where the database can be searched and visualized. The project aims to generate new research questions while offering an immersive environment in which to conduct research, engage with heritage, and focus one’s attention.
Decolonizing Western Catalogues of the Middle East
Keoni RodriguezMy contributions focused on two main tasks: expanding the English-language database and assisting with grant writing by analysing the project methodologies of other scholars working in geography and the Digital Humanities. The grant writing was especially fulfilling because of our project’s interest in the ways that scholars in both fields have applied their respective methodologies to decolonial analysis.
Working in Excel, I expanded the English compilation data of works on geography of the Middle East to a couple hundred works, with notes on different editions, areas described, genre, medium, and any additional information that would help viewers understand a work’s audience and goal. The entries I processed reveal the significant range of ways (from military histories to religious pilgrimages to travel accounts) in which Western, English-speaking people encountered the Middle East and sought to capture the geographic, historical, and social realities on the ground. The works in question were primarily pulled from online databases and concerned with things that had been written pre-World War II, but otherwise the range of source dates typically spans from the early 19th century to the mid 20th century. We will use this dataset in conjunction with existing datasets in Persian, Arabic, and Turkish.
In addition, by conducting basic analyses of other existing work, we were able to create connections between the Middle East and other studies of decolonial geography. For example, because my focus is in the Pacific, we explored how methodologies used in studies of cartography and geography in Hawai‘i might apply in the Middle East.

Developing a Searchable Database and Virtual Gallery Space
 Umar Patel
During spring and summer 2021, I was very fortunate to work alongside Adrien and Merve and contribute to the development of a data extraction mechanism that involves the application of Natural Language Processing (NLP) techniques to Turkish Geographical directories, a display of that information in the form of a searchable database on a Jekyll website, and the creation of a 3D virtual gallery and research space that showcases elements of Early Modern Ottoman geographical works (Figure 1). Through this work, I practiced NLP and 3D modeling techniques that interest and are useful to me as a Computer Science and Archaeology double major.
My database work primarily involved two large Turkish-language texts that present authors and their corresponding works. With Merve, I used the NLP tool regex to first extract author names and then book titles using patterns we observed in the text. We gathered additional metadata by extracting information from both the work title sequence and its corresponding post-processed author tag. Later, we applied what we learned from earlier data extraction to pull information on works with anonymous authors (including books, maps, and atlases).
51 | Center for Spatial and Textual Analysis (CESTA) at Stanford University
cesta.stanford.edu | 52
Figure1:ThisJamboardscreenshotshowsourdraftoftheCISTERNVRspace.Thediagramillustrateshowthegallery andresearchspacewouldrelateinformationspatiallyandconceptually.Fromhere,webeganbuildingthe3Dvirtual space in Unity.
We stored all this information in carefully constructed data structures with the intention of eventually uploading them to a site.


The second major part of my internship involved working with Unity to create our virtual CISTERN, which would house some Ottoman and Turkish geographical works in a gallery and provide a research space with multiple user interfaces (Figure 2). I augmented the virtual space in a number of ways, beginning with the development of a script that allows the user to teleport to different parts of the space by stepping on top of certain platforms. This provides easy access to a wide array of rooms and spaces (Figure 3). The platforms will play a significant role in the expansion of the space to include specific author and theme showrooms. I also introduced a checkpoint system that allows users to keep track of the parts of the virtual museum they have visited.

Finally, I experimented with modeling 3D objects for placement in the gallery (Figure 4). This is an evolving and highly interactive space that can house a variety of contributions and facilitate collaborative research.


53 | Center for Spatial and Textual Analysis (CESTA) at Stanford University
CISTERN
Figure 2: Users can enter the virtual world through a staircase(top),whichleads down to the main gallery (bottom)Thentheycanwalk through and observe various works on either wall.
Umar Patel
STUDENT RESEARCHERS
cesta.stanford.edu | 54
Keoni Rodriguez
Figure3:Abirds-eyeviewofthespaceshowshowthevariouscomponentsconnecttoeachother.Partofmyworkthisterm involvedcompletingthelooptobringthegalleryfullcircle.Thecreationofhalls,corridors,andentrywaysaddsaesthetic value.
CESTA RESEARCH ANTHOLOGY 2021
Figure4: IusedAgisoft Metashape software to model a Rehal, which can appear with and without (pictured)aQur’an,the Holy Book of Islam. This typeofmodelingwillallow us to add 3D objects to the virtual exhibit.
OTTOMAN EPIRUS
Project Description
 Ali Yaycioglu, Associate Professor of History
Mapping Ottoman Epirus seeks to better understand how the Ottoman Empire operated through big data, spatial and network analysis, visualization, and other digital methods. Our focus is Epirus, a region in modern-day Western Greece and Southern Albania, during the late 18th and early 19th centuries. This particular area offers exciting insight into the Ottoman Empire because it was a strategic junction on the Adriatic coasts, connecting Europe and the Ottoman lands.
Mapping Travel Across the Ottoman Empire


Emir Kirdan
Mapping Ottoman Epirus investigates the complicated political and economic systems that operated in the Ottoman Empire from the 14th century to the end of War World One in 1918. The Ottoman Empire—which controlled vast territories in Southeast Europe, the Middle East, Asia Minor, and the Balkans—was structured in a way that invites questions about how the different ethnic groups, economic and political institutions, and rich cultural structures coalesced into a transcontinental empire whose shape continues to influence the modern states in these regions.
Working as a team consisting of many researchers and historians, we aimed to approach these questions through big data, spatial and network analysis, visualization, and various other digital methods.
For the last few years, the project has focused on Epirus in the late eighteenth and early nineteenth centuries—a region in southeastern Europe, now shared between Western Greece and Southern Albania. This past year we started to work to extend the scope of the project by adding other regions controlled by the Ottoman Empire. With our project “The Geospatial Network Model of the Ottoman World”, we created a digital map, featuring cities and other administrative divisions, that charts time cost and financial expense associated with different types of travel in the Ottoman Empire. For the first part of the project, the team translated the names of the administrative units on the “Ottoman Routes Map” (Figure 1) into English and matched these administrative units with their modern locations. We used Google Maps, Google Earth, and Wikipedia locations to understand where the Ottoman cities of the past are situated now. For those that no longer exist, we used archives in Turkish and English to obtain more information. After collecting all the coordinates of the cities displayed on the map, we georeferenced the historical map using ArcGIS software to convert raster data (image) to vector data (coordinated map), ultimately transforming a historical map into one with accurate GPS coordinates.
STUDENT RESEARCHER
 Emir Kirdan
MAPPING
55 | Center for Spatial and Textual Analysis (CESTA) at Stanford University
cesta.stanford.edu | 56
Figure 1: The “Ottoman Routes Map”, an eighteenth-century map of routes across the Ottoman Empire held in the Ottoman ImperialArchives,Istanbul,wasthekeysourceofdataforourgeospatialnetworkmodel.
Figure 2. We prepared this data table to gather the modern coordinates of the administrative units mentioned on the map.
Figure3.Adetailfromthe“OttomanRoutesMap”, showinghowmuchinformationisencodedinthissingle historical document.
OPENGULF:
HISTORICAL TEXTS AS DATA
Project
Description
Nora Barakat, Assistant Professor of HistoryOpenGulf (opengulf.github.io) is a transdisciplinary, multiinstitutional research group analyzing historical texts produced in the Arabian Peninsula, Iran and Iraq from the early nineteenth century to the present. The various projects associated with OpenGulf publish open historical datasets, corpora and digital exhibitions with the aim of opening the field of Gulf Studies to digital historical exploration, analysis and interpretation in the service of open research and pedagogy. Currently, OpenGulf includes six projects with students, faculty and staff at eight institutions actively contributing content including handwritten text analysis of Arabic, English and Ottoman Turkish texts, interdisciplinary analysis of data from phone books from the city of Abu Dhabi from the 1970s-2000s, and close and distant readings of an expansive British gazetteer of the region that includes mapping over 20,000 unique named locations. During the 2020-2021 academic year, CESTA interns worked on the Historical Texts as Data project of OpenGulf, which follows a general three-step workflow: preparing historical texts in various media formats and languages for digital analysis; extracting and annotating names of people and places in those texts to create reusable structured data; and creating and publishing visualizations and narratives derived from those datasets.

Better Training Sets, Better Research
Moe KhalilMy work with OpenGulf has consisted of several distinct yet interrelated projects. Most of my research has used Transkribus, a platform that provides language-independent, AIpowered handwritten text recognition to translate texts from digitized image format to searchable, computationallytractable text. Unfortunately, due to the limited Arabic training sets in Transkribus, the existing Arabic text recognition was often incorrect. Furthermore, all available Arabic models had been trained on old newspapers or printed editions, which usually do not include the diacritics and punctuation found in larger literary texts. These training sets were useful as base models, but we needed to include new domains of texts in order to retrain the model.

increased prevalence of literary texts allowed us to increase the accuracy(CERValidation)inrelationtothetestdata (CERTrain),therebymakingthemodeloperatebetter with materials from Lorimer.
Initially, we focused on printed texts that were not available in text form. For example, we first used an 1882 gazetteer of Baghdad, Basra, and Najd written by Al-Haydari. This text included numerous place names and geographical descriptions that would be valuable for the larger scope of the project. Throughout much of my time with OpenGulf I worked on training a model through Transkribus in order to be able to recognize and transcribe such text, and was eventually able to bring the error rate of the model down to around 1.7%—a great improvement.
After this success, we decided to train the model to recognize purely handwritten texts. To accomplish this, we transcribed several handwritten texts from various sources, including a set of accounting letters and a travel journal. In the future, we plan to create a more comprehensive data set that can be used as the starting point for an Arabic handwritten text recognition model in Transkribus.

57 | Center for Spatial and Textual Analysis (CESTA) at Stanford University
cesta.stanford.edu | 58
Figure1:ThisscreenshotfromTranskribusshowsthe changeinaccuracyinArabictextrecognitionfollowing ourexpansionofthetrainingdataset.The
Figure 2: This handwritten Arabic letter from April 1925 is one of many sourced from the collection of the Bahraini merchant Muhammad al-Ajjaji, held in the Juma bin Majid library in Dubai, United Arab Emirates. The light blue text boxes visible in the image are automatically generated through Transkribus’s layout analysis algorithm.
Computing Lorimer
As part of my research for OpenGulf: Historical Texts as Data Project, I consulted with field experts Prof. Nora Barakat and Prof. David Wrisley to compile questions related to the Gazetteer of the Persian Gulf, Oman, and Central Arabia (henceforth, Lorimer) that could focus my research. Ultimately, the primary questions guiding my research centered on whether or not words in a corpus can be mapped onto regions as we know them, or if they create clusters that are other than geographical, and whether we can analyze them to predict the common themes of the chapters they’re found in.

Initially, it was difficult to read through each text and categorizeit based on predicted geographic location. As a solution, I first began by writing a Python script to generate a spreadsheet of top-n words appearing within each text. Then, I analyzed the results and removed common stop words such as articles and basic adjectives. In our group, we pondered whether to remove distance words, such as “miles” and “feet.” On the one hand, these could help us estimate the size of the region being described. On the other, these were largely function words that blocked more important and meaning-bearing words from being displayed. Though the initial attempt gave us a good amount of information to work with, we realized that we still had to manually cluster chapters based on their top words. Thus, I adapted and deployed a tf-idf-based model on the text, hoping to visualize the distribution of texts in a more legible manner.
Term frequency-inverse document frequency, or tf-idf, is a score that showcases the significance of a word within its document in a corpus. Essentially, if a word appears more in a specific document, then the tf-idf score increases. Conversely, if a word appears just as frequently throughout the corpus, then the td-idf score decreases. In my model, I used a form of tf-idf imported from sklearn. feature_extraction.text, which generates a matrix from counting word occurrences per document. Then, I apply weights within this matrix as described above: words that appeared frequently within a document but not throughout the corpus received higher scores.
I then utilized k-means clustering, in which we cluster our texts into n clusters. In short, the algorithm assigns each text to a cluster with the closest centroid, then recomputes the cluster centroid as the mean of all the texts in the cluster. Since there were over 800 documents, I tested both n = 10 and n = 20, and using multidimensional scaling, mapped the texts into a 2D grid where texts were represented as points color-coded based on their respective clusters. However, we found that this visualization was difficult to read, so I explored other clustering/visualization algorithms, such as hierarchical document clustering. Future work will include developing visualizations that are easier to read and experimentation with other types of models.
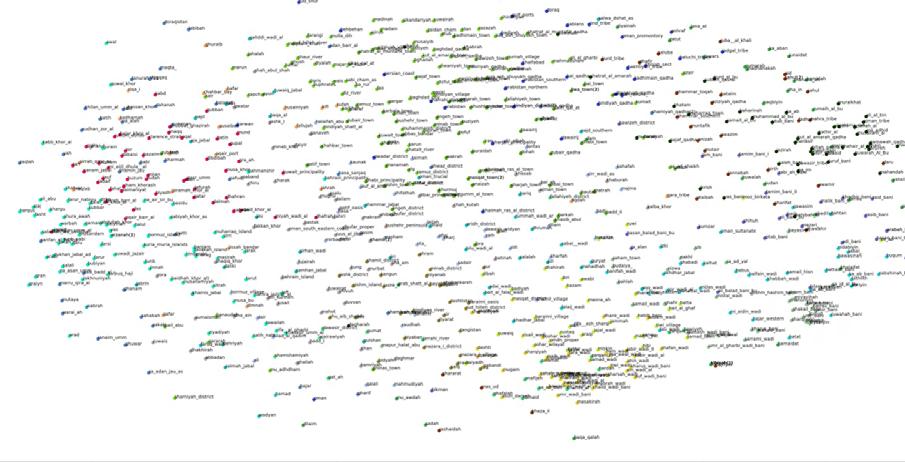


STUDENT RESEARCHERS
59 | Center for Spatial and Textual Analysis (CESTA) at Stanford University
Danny Tse
OPENGULF: HISTORICAL TEXTS AS DATA
Figure3:Exampleofapagefrom a chapter in Lorimer that serves as our research material.
Danny Tse
cesta.stanford.edu | 60 CESTA RESEARCH ANTHOLOGY 2021
Moe Khalil
ORAL HISTORY
TEXT ANALYSIS PROJECT
Project Description
Estelle Freedman, Professor of History, and Natalie Marine-Street, Oral History Program Manager (Stanford Historical Society)The Oral History Text Analysis Project (OHTAP) is developing an original methodology for data mining the rich but untapped collections of digitized transcripts of women’s oral histories housed in university libraries and other collections across the United States. OHTAP has created a database of 2700 transcripts from diverse regions and groups and developed a subcorpus extraction tool called Winnow. The current study asks whether and how the interviewed women named, remembered, and interpreted forms of sexual violence. Our project combines quantitative and qualitative analysis to understand which women spoke about sexual violence; what language narrators used to describe assault, abuse, and harassment; how responses to violence changed over time and across groups; and what historical contexts enabled resistance and activism concerning sexual violence.

Winnow-ing Metadata
 Jade Lintott
My work this year was on two main aspects of the Oral History Text Analysis Project. First, I uploaded onto the project’s GitHub (github.com/ohtap) a non-technical user guide that features in-depth directions for installing and using our corpus search tool Winnow, which, because it is hosted on the user’s machine, can be difficult to use without specialized technical knowledge (Figure 1).

My second task was to visualize the data in the project’s corpus. I worked with Prof. Estelle Freedman to conceptualize the best way to display the mass of data we had collected on the oral histories—such as the speaker’s race and birth cohort, the interview date, etc.—and then created charts representing how these attributes relate to the sexual violence the speakers reported (Figures 2-4).

Additionally, I wrote code that other research assistants can use to merge human coding of the interviews with their metadata. This code streamlined the integration of various information, thus making analysis easier. Finally, I helped clean the data in a way that made it much easier to extract and analyze.


61 | Center for Spatial and Textual Analysis (CESTA) at Stanford University
cesta.stanford.edu | 62 STUDENT RESEARCHER
Figure1:ScreenshotofwheretofindWinnowanditsinstallationanduserguide.
Jade Lintott
Figures 2-4: These three charts provide examples of the data analysis I conducted on the interviews in our oral history corpus.
POETIC
MEDIA LAB
Project Description
Amir Eshel, Professor of Comparative Literature; Jens Pohlmann, Research Associate (ZeMKI); and Gilad Shiram, PhD Student in GermanThe Poetic Media Lab is a Digital Humanities research and design group. We design and build creative platforms and products that promote new ways of conducting research, teaching, and learning in the 21st century. Our interdisciplinary lab includes faculty, staff, graduate, and undergraduate students from the humanities, computer science, and the School of Education. We are currently supporting seven new projects, including a study of internet discourse on free speech and a comparison of German-Hebrew translations of Goethe’s Faust across historical contexts.
Free Speech and the Digital Public Sphere
 Uma Phatak
In January 2021, most social media companies blocked former president Donald Trump from their platforms after he used them to incite the storming of the U.S. Capitol through inflammatory rhetoric. In the wake of this shocking incident, experts and politicians started talking about a relevant and controversial piece of U.S. internet speech legislation: Section 230. Section 230 of the Communications Decency Act of 1996 states that internet providers or companies cannot be held liable for illegal content shared via their platforms. In the context of the storming of the Capitol, it absolves social media companies of responsibility for individuals using their platforms to willingly spread misinformation and disorder throughout the country. After what happened in January, we had to ask: Is this leniency toward internet services fair?
This was my guiding question for my work with the Poetic Media Lab on the Free Speech in the Digital Public Sphere project. The goal of our project was to analyze public discourse on Section 230 in the space of U.S. technology blogs. Most reputable internet policy blogs are currently run either by experts in the field of internet policy or by highly knowledgeable interested parties. By studying the discourse around Section 230 in this subsection of the Internet, we sought to gain a better understanding of particularly informed opinions on Section 230. Ultimately, we plan to compare U.S. sentiments to German opinions about a similar internet speech law recently passed in Germany, “NetzDG”, and consider more broadly global approaches to moderating internet speech.
My first task was to assist in acquiring data for a list of nearly 150 U.S. technology blogs. I investigated the funding source and owner of each blog to gauge the background of who was writing about Section 230. These blogs formed the corpus on which we used our web scraping tools. From the 150 blogs analyzed, we found that 42 of them had blog posts mentioning Section 230 with a total of 1,100 unique posts (Figure 1).

After compiling these into a dataset, I wrote a script in Python to run an existing web scraping tool called Trafilatura on each post and parse relevant information, i.e. the source of the post (blog), the date it was posted, and the specific context in which it mentioned Section 230. With a CSV of this information, I found that out of the 42 blogs, most had an average of 3 posts mentioning Section 230, with some notable outliers having hundreds of posts about it (Figure 2).

63 | Center for Spatial and Textual Analysis (CESTA) at Stanford University
cesta.stanford.edu | 64
Figure 2: After using keyword extraction on the corpus (i.e. the collection of blog posts) to figure out which ones mentioned Section 230, I ran a web scraping tool on each unique blog URL and catalogued the results in this Excel spreadsheet.
Figure 1: Sample posts discussingSection230from the top 5 US technology blogsthatfrequently mentioned the law. Pictured clockwise from top left: Technology & Marketing Law Blog, Techdirt, New Media and Technology Law Blog, Benton Institute, and arsTechnica.
Figure 3: This plot shows thenumberofblogposts mentioning Section 230 per month from July 2003 to February 2019. The number posts discussing it has increased through time, suggestingrisinglevelsof interest and/or controversy.
I also confirmed the prediction that the volume of internet conversations on Section 230 would increase through time, peaking in the last year of our parameters (2019).

In the future, we will use natural language processing tools to analyze the types of opinions in these blog posts for a more nuanced picture of U.S. discourse on Section 230 (Figure 3).
The Hidden Secrets of Translation
Yonatan (Jonathan) Laderman

My project investigates how translations of the same literary work may vary across decades. I compared two different Hebrew translations of Faust by Johann Wolfgang von Goethe, one from 1951 by Yaakov Cohen and the other from 2006 by Prof. Nitza Ben Ari of Tel Aviv University. I chose these two translations for their temporal separation as well as for the difference in their contexts: One dates close to the establishment of the state of Israel (1948) while the other is from only fifteen years ago.

Early in cross-reading Cohen’s and Ben Arti’s translations I encountered significant differences in word choice. The most interesting divergence was the nature of words indicating the work’s cultural possession. In Ben Ari’s translation, national indicators such as “Germany” are apparent, as Goethe originally used them, while Cohen avoided contextualizing the play as occurring in Germany and originally shown to a German audience (Figure 4).
Cohen’s tendency to remove reminders of Faust being inherently German is complemented by his “Jewishization” of various words in the play. For example, while Goethe writes in the Dedication that “his heart’s whispers are transformed to music, like that of an aiolic harp” (line 28), Cohen translates the instrument as “David’s violin” instead. Although “David’s violin” is a synonym for harp, it immediately lends the description an additional Jewish valence. Another occurrence of Cohen using Jewish words, and specifically Jewish religious symbols, as substitutions for Goethe’s original diction appears in line 39 of the opening scene in the Theater.
In the original text, the Manager says that “the posters are, the boards are struck.” Ben Ari translates this line as “the stage is correct” and “the boards are in place,” but Cohen renders it “the Mezuzhot are set.” [“Mezuzhot” is the plural form of “Mezuzah.”] These two examples show how Cohen would modify words from Goethe’s work to embed Jewish sentiment in the text.
A deeper comparative study between Ben Ari’s and Cohen’s versions is needed to posit an explanation for the radical differences between their translations, and specifically to address why Cohen significantly changes Goethe’s written word in favor of Jewish sentiment. One possibility is that his changes are part of a broader effort to foster cultural solidarity with the newly formed Jewish state of Israel (established three years prior to the publication of his translation). By “Jewishizing” Faust, Cohen may have hoped to instill a sense of meaning among the Jewish audience, a sense that they were participants in a play of their own during the critical years of Israel’s foundation—that they too were undertaking a project that could bestow upon them the eternity of the Poet in Faust.


STUDENT RESEARCHERS

65 | Center for Spatial and Textual Analysis (CESTA) at Stanford University
POETIC MEDIA LAB
Figure 4: These annotations highlightthekeydifference in the two translations of the openingsceneofFaust.Top left: Ben Ari in 2006 translates more directly the Director’s question about the prospective popularity of the play “in Germany”. Top right: Cohen in his 1951 translation avoided thisexplicitnamingofGermany by translating the phrase as “in our country.” Bottom right: The original German text by Goethe with “in deutschen Landen” in line 36 underlined.
Figure6: Thefirstpageofanevenearlier translation of Goethe’s play into Hebrew, by Ze’ev Jabotinsky.
Yonatan Laderman
Uma Phatak cesta.stanford.edu | 66
Figure5:Thecoverof Cohen’s 1951 translation of Faust.
CESTA RESEARCH ANTHOLOGY 2021
PANIC AND PANDEMIC
IN EARLY MODERN EUROPE
Project DescriptionThis project examines discourses on epidemic disease against the history of outbreaks in early modern Europe, with case studies on Germany, England, and France. Using online databases, we analyze metadata of early modern publications for themes related to epidemic disease and compare these occurrences with historical reports of plague outbreaks. We also bring this data together with additional indices such as persecution (witch-hunting, antisemitism, and religious strife) and climatological variation. For example, in our German case studies, data streams on outbreaks are combined with structural data on the relative centrality of German cities, allowing us to model the impact of centrality on epidemic disease as well as the discourses which preserve its historical traces. Such models will allow the visualization, examination, and testing of different hypotheses about the role of environmental and social stress in the dynamics of panic and persecution.
Early Modern England

Karin Kutlay
Using Palladio, we explored whether network analysis would successfully label books from the same plague as similar (e.g. the Great Plagues of London or Marseille) to produce nominal network relations. We also wondered if it would reveal other harder-to-detect patterns.

We first cleaned the data by manually translating the titles—some of them 250 words long!— into contemporary English. We removed stop words (using the NLTK library in Python), excised foreign quotations, and wrote code to extract every relevant word from the title and match it with the year the book was published. We used the results to create a robust network graph that displays the numerous associations between title words and years (Figure 1). A surprising result of our analysis was the revelation of year groupings beyond those traditionally recognized in the scholarship. For example, years normally seen as distinct in relation to the plague, such as 1626, 1637, and 1644, turned out to be more closely related than years normally grouped together, such as 1721 and 1722 (Figures 2-3).
Figure2:Azoomed-inimageof“TheEyeoftheAbyss”networkfrom Figure1.We’vecolor-codedfourdifferentclustersofyears:blueisfor 1721;pinkisfor1722;thethreegreendotsdenotefromlefttorightthe years 1637, 1626, and 1644; the six orange dots denote 1580, 1595, 1598, 1610, 1619 and 1638. The size of a node corresponds to the total number ofwordsusedinthatyear’stitles,allowingforrepetition.

This network analysis has raised new questions about the nature of the relationships between different years that future researchers on the project can pursue. For instance, does the appearance of Oxford and Cambridge in two different two-year groups (1626 and 1644; 1626 and 1637) point to them being plague epicenters in those years? And a methodological question: What do the off-center words (those used uniquely in a given year) suggest about the limitations of network analysis?

Laura Stokes, Associate Professor of History cesta.stanford.edu | 68
67 | Center for Spatial and Textual Analysis (CESTA) at Stanford University
Figure3:Anevenmorezoomed-inviewofthe 1644,1637,1626clustershowingthespecific words linking these three years
Figure1:Agraphresultingfromournetworkanalysisofeachyearofplague (darkgray)andspecificwordsdrawnfromthetitlesofbookspublishedthat year(lightgray).Duetoitsdistinctiveshapeandthenatureofitscontent, we called this zoomed-out visualization of all our data “The Eye of the Abyss.”
I began my work on the English portion of the Panic and Pandemic project in early 2021 by registering every book in the databases “Early English Books Online” and “Eighteenth Century Collections Online” which contained the word “plague” or its variants in its title. I compiled the 578 matches in a spreadsheet and assigned genres and subgenres to each text for easy filtering and future access in OpenRefine. In order to ensure research flexibility, our team opted for network analysis as our primary methodology.
Modern France
Cat Fergesen
In 2021, my primary focus on the Panic and Pandemic project was to create a shape model of the relationship between mental health and the collective experience of epidemic based on the pandemic for which we have the most abundant recorded evidence, i.e. COVID-19. This model will be of use in guiding analyses of the phenomenon of “panic” in periods of pandemic in early modern France.
I began by collecting and compiling how frequently mental health-related keywords appeared in materials published during COVID-19. I then visualized the changing frequency of these keywords in the context of different stages of the pandemic to better understand which period(s) of a pandemic elicit the strongest emotional responses. To keep the region and language consistent for the early modern aspect of this project, I limited my COVID mental health analysis to France. I gathered data primarily from Le Figaro, a French daily media publication available online and equipped with an advanced search tool. Using Javascript, I extracted the 16,577 articles published between January 1st, 2020 and March 7th, 2021 that were tagged with the keywords “COVID-19,” “coronavirus,” or “épidemie.” I then wrote a tool in Python (get_text.py) that extracted the article content from the links. I wrote a secondary tool (get_data.py) that accesses the text of each article to check for select mental health-related keywords (Figure 4). The get_data.py tool outputs a CSV file in which keywords appearing in articles are listed together with their dates of publication. I used this data to produce a graph which revealed that the peaks in frequency of mental-health keywords correlated with periods of confinement enacted by the French government (Figure 5).
I also set the changing frequency of mental health-related keywords against trends in COVID-19 related deaths from January 2020 to February 2021. Although death rates may have played a role in the mental health of France’s residents, I found that during this timeframe the frequency of mental health-related keywords in Le Figaro correlated more closely with periods of confinement. For example, after the second confinement ended in December, the frequency of keywords decreased to nearly the level of the non-confinement period from May to October, even as death rates remained steady (Figure 6).


This result may mean that the more promising approach to analyzing the data from early modern France will be to track the appearance of mental health-related keywords in published materials alongside government quarantines, mandates, and other restrictions on daily life, rather than death counts.

STUDENT RESEARCHERS

69 | Center for Spatial and Textual Analysis (CESTA) at Stanford University
PANIC AND PANDEMIC
Figure 4: A list of mental health-related keywords targeted by the get_data.py tool I wrote to analyze Le Figaro publications during the COVID-19 pandemic.
Cat Fergesen
cesta.stanford.edu | 70
Karin Kutlay
Figure 6: A graph showingthenumberof electronically-recorded COVID-19 related deaths from January 2020 to February 2021. Compare this to the graph in Figure 5 to see how the frequency of mental healthrelated keywords tracks government-enacted confinement periods more closely than death rates.
CESTA RESEARCH ANTHOLOGY 2021
Figure 5: The graph I created revealed how the frequency of mental health-related keywords tracked the enactment of confinement policies by the French government during the pandemic.

