
URBAN PLANNING PORTFOLIO
University of Cincinnati Design, Architecture, Art, & Planning


Table of Contents | 1 INTRODUCTION 2 About Me 3 Resume SOUTH CUMMINSVILLE & MILLVALE 5 Neighborhood Analysis 11 Residential Typology 13 Neighborhood Impact GREEN IMPACTS OUR EMOTIONS 16 Thematic Sketches 17 Thematic Infographic 18 Thematic Map OVER-THE-RHINE 20 Research 21 Site Analysis ANALYSIS MAPPING 24 Illustrator 25 AutoCAD 26 GIS 27 Hand-Drawn EXTRA WORKS 29 Compositions 30 Writing Sample The Commons - South Cumminsville JoyfulSketch-UC ImageabilityMap-UC
About


Me | 2 Hello, I am a 2nd year student at the University of Cincinnati. My major is Urban Planning & my minor is Environmental Studies. My enjoyments in life come from traveling, playing instruments such as the piano, photography, designing, and interacting with the natural environment. My interest in urban planning came from my travels to Europe and how differently cities are laid out and planned in different places with various backgrounds. Phone Number (513)-417-9901 Email morri2sg@mail.uc.edu LinkedIn linkedin.com/in/sageamorrison Address 238 Klotter Avenue Cincinnati, Ohio 45219 Seville,Espana
SAGE MORRISON |
(513)417-9901
morri2sg@mail.uc.edu linkedin.com/in/sageamorrison
238 Klotter Avenue
Cincinnati, Ohio 45219
EDUCATION
University of Cincinnati Cincinnati, Ohio
College of Design, Architecture, Art & Planning Bachelor of Urban Planning Environmental Studies Minor Class of 2026
3.73 GPA
Lebanon High School Lebanon, Ohio Class of 2020
4.20 GPA
AWARDS College
College of Design, Architecture, Art & Planning Fall 2021 Dean’s List - Present
High School
National Honors Society - 2 Years Academic Hall of Fame & Scholar Athlete Award
Community
Otterbien Senior Life:Opening Minds Through Art
Working with the elderly on artwork projects - 1 Year
INTERESTS
Environmental issues, sustainability and urban design.
WORK EXPERIENCE
Starbucks
Lebanon, Ohio & Cincinnati, Ohio
August 2020 - Current Part-time Barista
Getting to know my customers on a personal level whilst creating hand-crafted beverages for them that they wouldn’t be able to get as personalized anywhere else.
Panera Bread
Mason, Ohio
January 2018 - September 2018 Part-time Trainer
Teaching new hires how to perform tasks required for a welcoming environment for our guests.
Irons Fruit Farm
Lebanon, Ohio
September 2016 - August 2018 Seasonal Store Clerk
Selling fall pastries, watching over the fruit fields, pumpkin patches when in season and helping with the preparation of bakery items.
SKILLS & EFFICIENCY
Language Spanish
Adobe Creative Cloud
Photoshop, InDesign & Illustrator
Microsoft Office Suites Word, Excel, & PowerPoint
Additional
ArcGIS Pro Mapping
Sketchup Pro
3
South Cumminsville
Millvale |
4
VISUAL SENSORY MAP


Individual Effort
1ST IMPRESSIONS
When my group 1st walked along the streets of South Cumminsville and Millvale, our impression of it was that it felt run-down, not very social and very much industrial. Not many people were outside because there was nothing to do besides a park that didn’t have much and felt unsafe, as well as Mr. Gene’s that is famous in the neighborhood but is unfortunately only operating during the summer. Although our 1st impressions weren’t super positive, we came to realize these neighborhoods are very community based from all the colorful murals that line the network between the neighborhoods.
5
| Neighborhood Analysis
GroupEffort:Sage,Kyra&Nasir
IMAGEABILITY
My group created our final imageability map for South Cumminsville and Millvale by1st making one of our own maps and then combining elements we all agreed upon in the end product. As you can see below, we started out with all major roads but ultimately decided it was best to represent the neighborhoods as connected by the major road Beekman Street. We changed I-74 from being yellow to brown to represent pollution from the highway. Lastly, we decided to use watercolor in our map to show just how blended the districts are.


6
| Neighborhood Analysis GroupEffort:Sage,Kyra&Nasir
TheCommons
EXISTING CONDITIONS
Vacant Lots

Mill Creek

Community Based
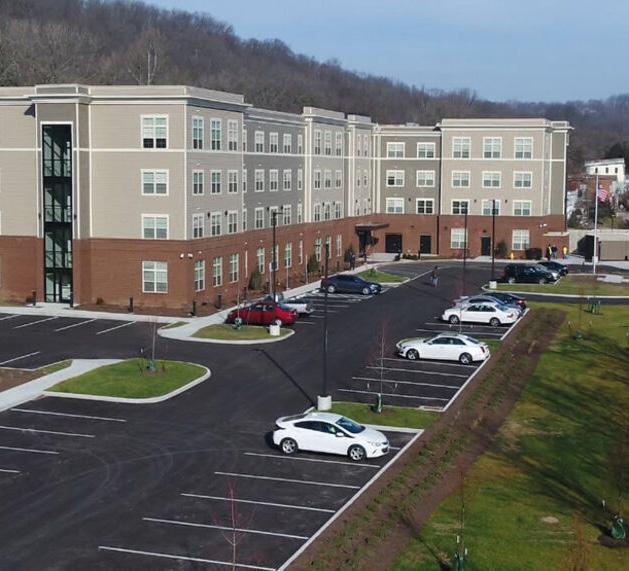
These neighborhoods are places that have been forgotten, yet through strong community and perseverance have gotten this far on their own. They haven’t been given the resources and opportunities others have but, they never stop pushing. Change is beginning, but it won’t happen overnight. The Commons is a new building that appeared in 2021 that offers 80 low-income housing to veterans and disabled people. It is the nicest building in South Cumminsville and shines light on what is to come in the future. Vacant lots are around every corner you go which need to be turned into helpful uses for the community. The Mill Creek stretches between the two neighborhoods, as well as others surrounding it and has been polluted for quite some time. Although these neighborhoods don’t have much, they’re extremely community oriented and hope for a brighter future that allows more funding.

7 | Neighborhood Analysis
WEAKNESSES
OPPORTUNITIES

SWOT ANALYSIS
When you think of an enjoyable neighborhood filled with all your basic needs and amenities, surrounded by a community, what do you picture? South Cumminsville and Millvale combined has great potential. Currently, its known as the “forgotten neighborhood,” but this can and will change with time. Change for the better has already begun with places such as “The Commons” built in 2021. This leads us to believe
there is room for growth. A SWOT Analysis was created that covers the Strengths, Weaknesses, Opportunities, & Threats in these neighborhoods.


THREATS

7 8 | Neighborhood AnalysisSTRENGTHS
TIMELINE


South Cumminsville wasn’t always its name, it began as Cumminsville and was apart of Northside above it. The two neighborhoods have always been extremely industrial and not much but that. In 1974, Interstate 74 divided the neighborhood from Northside, thus completely separating the characteristic feels of both places when visited. Northside was given more resources and has thrived, while South Cumminsville and Millvale were seen to be left in the dust, you could even say, “forgotten.”

In more recent years, the Commons at South Cumminsville was built and has started to show that change is slowly working its way in for the better.


9 1860 1873 1962 1970 2004 2013 2014 2007-2016 1955 1904-1910 1870-1890 1937 1875 1905 1920 1935 1950 1965 1980 1995 2010 Present Factories moved to Cumminsville; stimulated housing development for workers & began industrialization CUMMINSVILLE SOUTH CUMMINSVILLE & MILLVALE The Flood of 1937 flooded Cumminsville & destroyed many homes, displacing everyone who lived there First public housing in Cincinnati in a dozen years happened in Millvale Community Center was built Webers Cafe closes after 122 years Wayne Playfield Rennovation occurs The Commons was built The Great Recession Demolishing of houses in South Cumminsville Interstate 74 divided Cumminsville, creating the two separate neighborhoods of Northside & South Cumminsville Mr. Gene’s Hot Dog House was built Cumminsville ‘Murder Zone’ Cumminsville annexed into Cincinnati 1890 South Cumminsville community projects began like murals on Beekman Street 2008 2021 1974 | Neighborhood Analysis
Group Effort: Sage & Kyra
Single-Family Two-Family Mixed-Use Manufacturing Heavy Industry Light Industry Commercial Vacant Transportation Education Public Services Public Utilities Parks & Recreation Agricultural Office Government Services Institutional
LAND USE
As seen from the land use map, South Cumminsville and Millvale are separate but share many of the same uses and ultimately have the same feeling when entering both. The majority of the land use in place is housing (single-family & two-family), manufacturing, industrial (heavy & light), vacancy and transportation. This tells us that these neighborhoods are mostly for housing and industrial work. There aren’t many amenities or parks and recreation at play and adding such things could spark change.

| Neighborhood Analysis 10 Miles 0.07 00.30.450.6 0.15
SKETCHUP MODEL

RESIDENTIAL ASPECT
The specific area is focused around the improvements being made in the community. For too long, South Cumminsville and Millvale have been left behind and forgotten to where it became run down with little to no investment. Recently in 2021, this has changed. The Commons at South Cumminsville is a great start to the changes needed in these two neighborhoods, exactly why it was chosen to be modeled. It aided the community with 80 low-income housing opportunities for disabled people and service veterans. Much of South Cumminsville and Millvale is residential and is a place where generations of families live. There has not been a lot of help given to the community like other neighborhoods have. Creating more places like The Commons in the future years will bring forth life and make it come out of being the once forgotten neighborhood. This is only the beginning.
AFTER RENDERING
| Residential Typology 11
CROSS SECTIONS


ELEVATION | Residential Typology 12
CURRENT PROPOSALS
WAYNEFIELD PARK


| Neighborhood Impact
13 ELEVATED TRAILACCESS RAILWAY
CONNECTION


The neighborhoods along the Mill Creek overtime have forgotten just how important it is. The Mill Creek ables us to CONNECT each neighborhood. It is extremely important to find a way in doing this. In doing so, people from all around may visit the existing neighborhoods and bring attention to the more forgotten ones. Creating a walkable and bikeable trail elevated above the Mill Creek will allow this to happen, as well as bring many other benefits along with it. The Proposal shows where the elevated trail will go in South Cumminsville and Millvale with a bolded black arrow path. Two specific spots focused on were Waynefield Park and the un-used railway in the neighborhood. Not much is at the park and adding an entrance to the trail would be beneficial. Having a breakaway spot that goes onto the railway would be an interesting use of activity for all ages and would give insight to the neighborhoods past.
MILL CREEK TRAIL

| Neighborhood Impact
14 ADDITIONS TO TRAIL HISTORY OF THE MILL CREEK The Mill Creek stream in southwest Ohio. It flows 28.4 miles (45.7 km)[1] southwest and south from its headwaters in Liberty Township of Butler County through central Hamilton County and the heart of Cincinnati into the Ohio River just west of downtown. The section of Interstate 75 through Cincinnati known as the Mill Creek Expressway. The Mill Creek Valley is remnant of the Deep Stage Ohio River from the days of the Last Glacial Maximum. The stream, with its water power and valley, were important to the development of Cincinnati. Then, for a time, the steep hillsides that surround the creek limited expansion and gave impetus to the free growth of surrounding communities that were over that barrier. Finally, inclined planes solved the problem, before highways and automobiles eliminated it.
Green Impacts Our
Emotions |
15
EMOTION SKETCHES
What makes you have an enjoyable time walking through a college campus? Many have said its from the natural environment that surrounds them on their daily commute to classes. Here are 3 emotions being JOYFUL, COLD, & STRESSED. As you can see, places with lots of greenery influence a students emotions positively, while places with little to no greenery as well as other factors like vehicles and construction influence emotions negatively. In the sketches, people’s body languages were observed in different locations to see how their emotions were impacted based on the amount of greenery surrounding.


| Thematic Sketches 16
Joyful Emotion Cold Emotion Stressed Emotion
INFOGRAPHIC


Pulling together the aspects of nature, represented by a tree going through seasons, to create an infographic that shows where our emotions are better and worse. Places like Sigma Sigma Commons that has hammocking intertwined with lots of trees brings joy to students, places that are purposefully designed for only walking to classes but still have natural elements surrounding the paths bring calmness, places like Dabney that have little or unkept greenery bring a sense of coldness and places that are filled only with construction bring stress.


| Thematic Infographic 17
CompletedInfographic
THEMATIC MAP


“Green Influences Our Emotions” was a thematic approach to seeing how much the green on campus impacts our emotions compared to other resulting factors. Using watercolor on the map to represent the different emotions along pathways throughout the UC Campus. In the end, there was discovery that by adding more green (trees, bushes, grass, flowers, etc.) to campus, a student’s college experience will be impacted greatly by increasing positive emotions in an enjoyable and healthy environment that will also help nature flourish.


| Thematic Map 18
Over-the-Rhine |
19 PROJECT IN PROCESS...
RESTAURANTS GROCERY STORES FARMER’S MARKETS
FOOD DESERT?
Given the topic of Ecology, we look deeper into Over-the-Rhine and its surrounding neighborhoods abundance of healthy and fresh food. Mapped out are all the restaurants (healthy vs. un-healthy), grocery stores and farmer’s markets to begin analyzing what truly is happening in OTR and how accessible those amenities are to the streetcar. OTR is the place to go for a night out, but it isn’t necessarily all healthy. Many places are bar and grill type places or fast food and when the restaurants are healthier, they’re only accommodating to the wealthier folk. There are many grocery stores in OTR, but only one that is large being the Kroger-on-the-Rhine so more could always be added. As for Farmer’s Markets, OTR is known for its Findlay Market open throughout the week offering local businesses and loads of fresh foods. This is the only Farmer’s market in the area though. Overall, more healthy options need to be added to OTR and especially surrounding neighborhoods with all income ranges in mind.


| Research Farmers Market Streetcar Route Street Building Neighborhood Boundaries Streetcar Stop Streetcar Route Street Building Neighborhood Boundaries Streetcar Stop Grocery Store Healthy Restaurant Un-healthy Restaurant Streetcar Route Street Building Neighborhood Boundaries Streetcar Stop
0 250 500 m 0 250 500 m 0 250 500 m
20
GOOD URBANISM
GOOD VS. BAD URBANISM

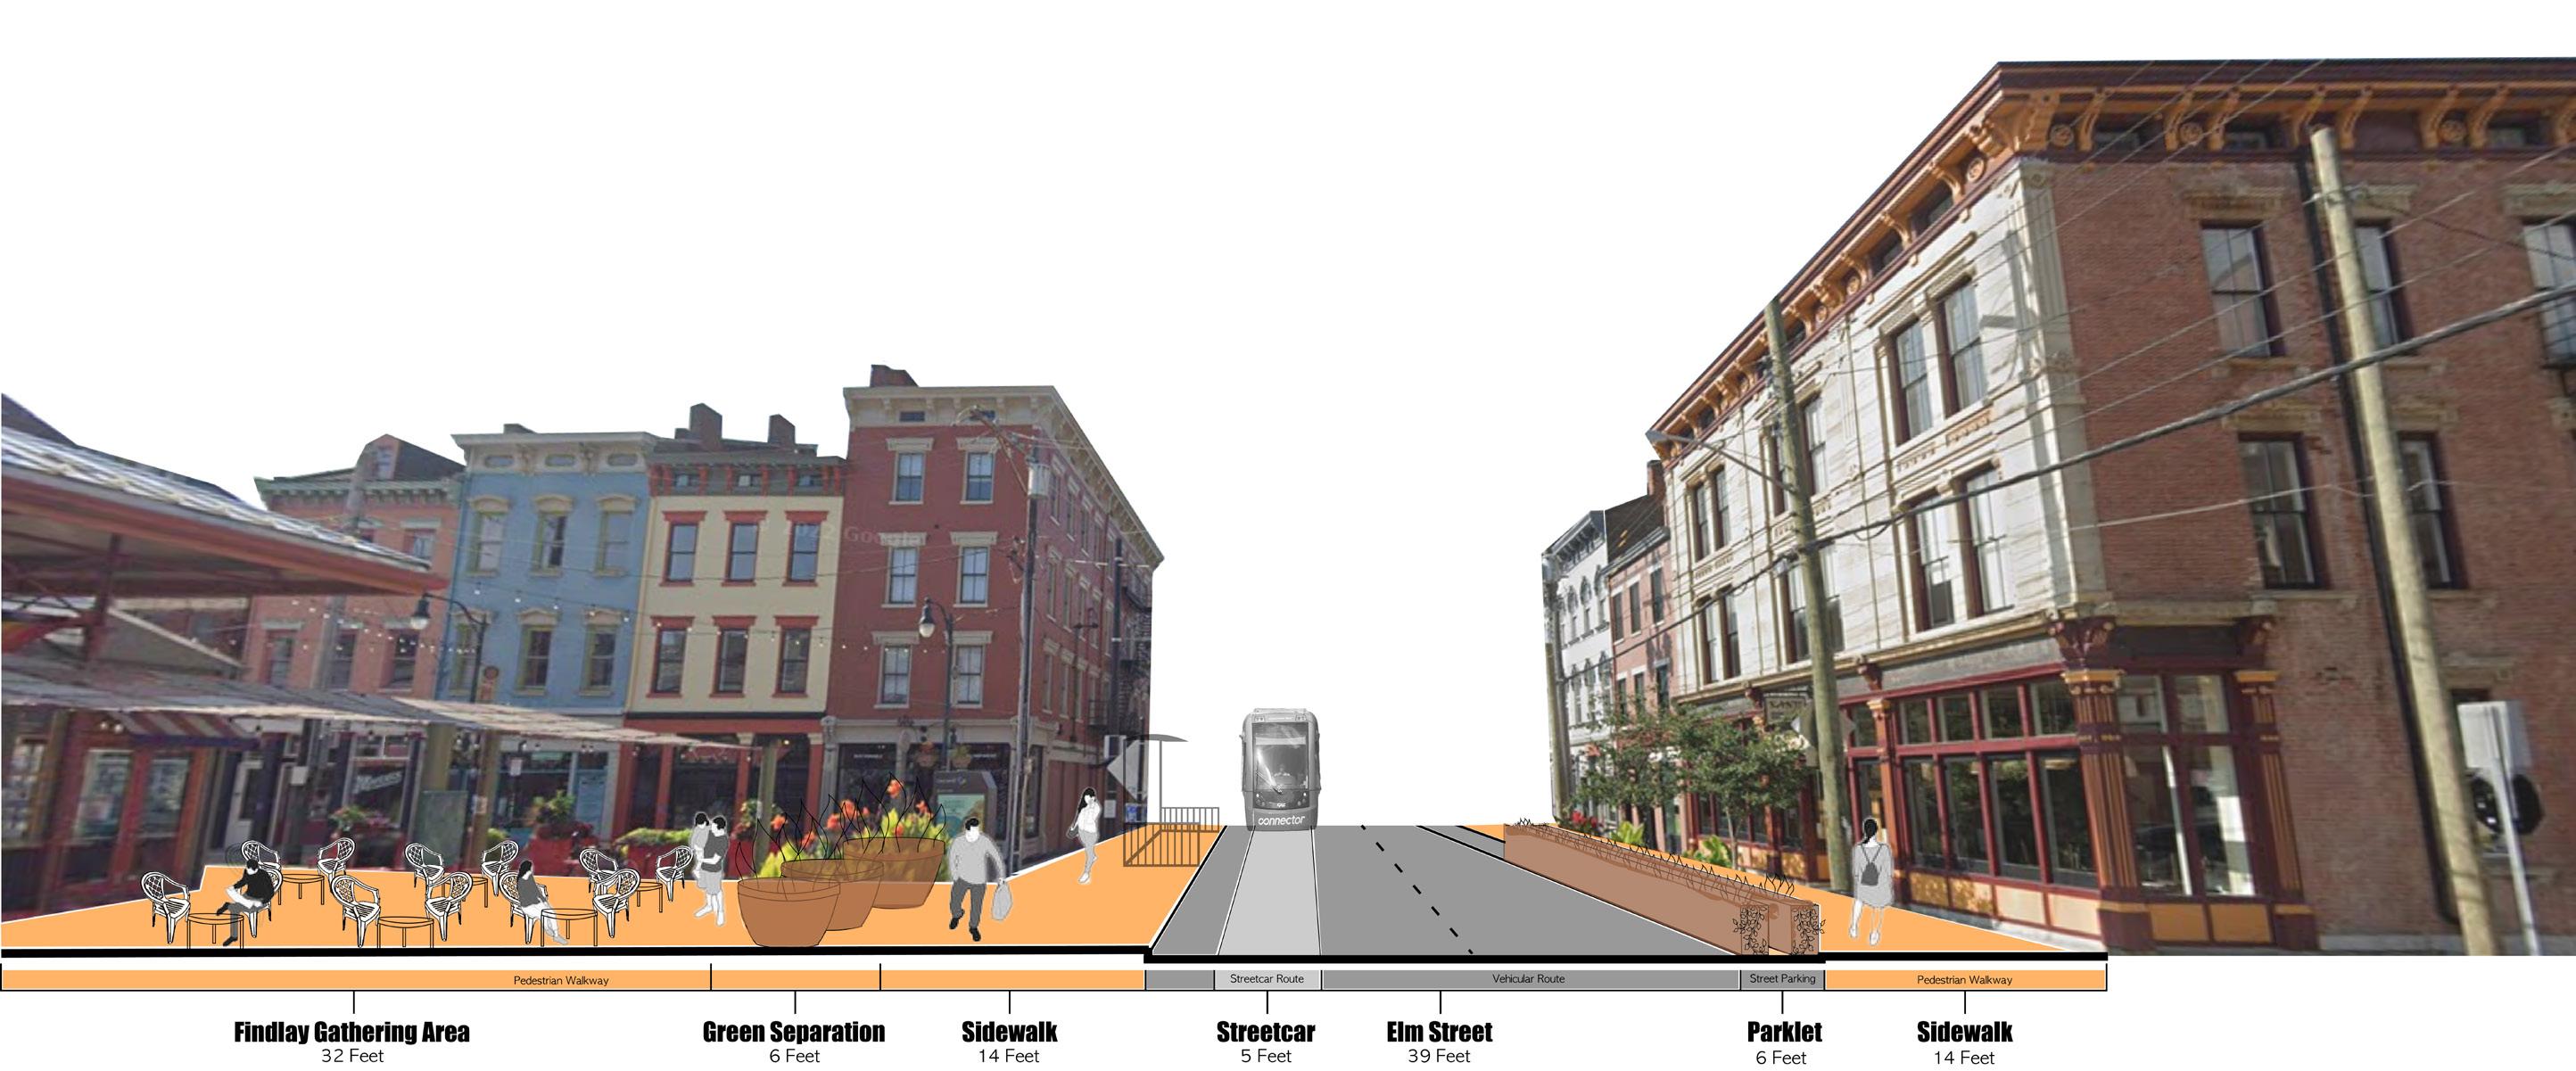
Good Urbanism is represented by a place being created for the pedestrian. Things like gathering spots, greenery, public transportation, local businesses, a lack of places for vehicles and much more can be associated with this.
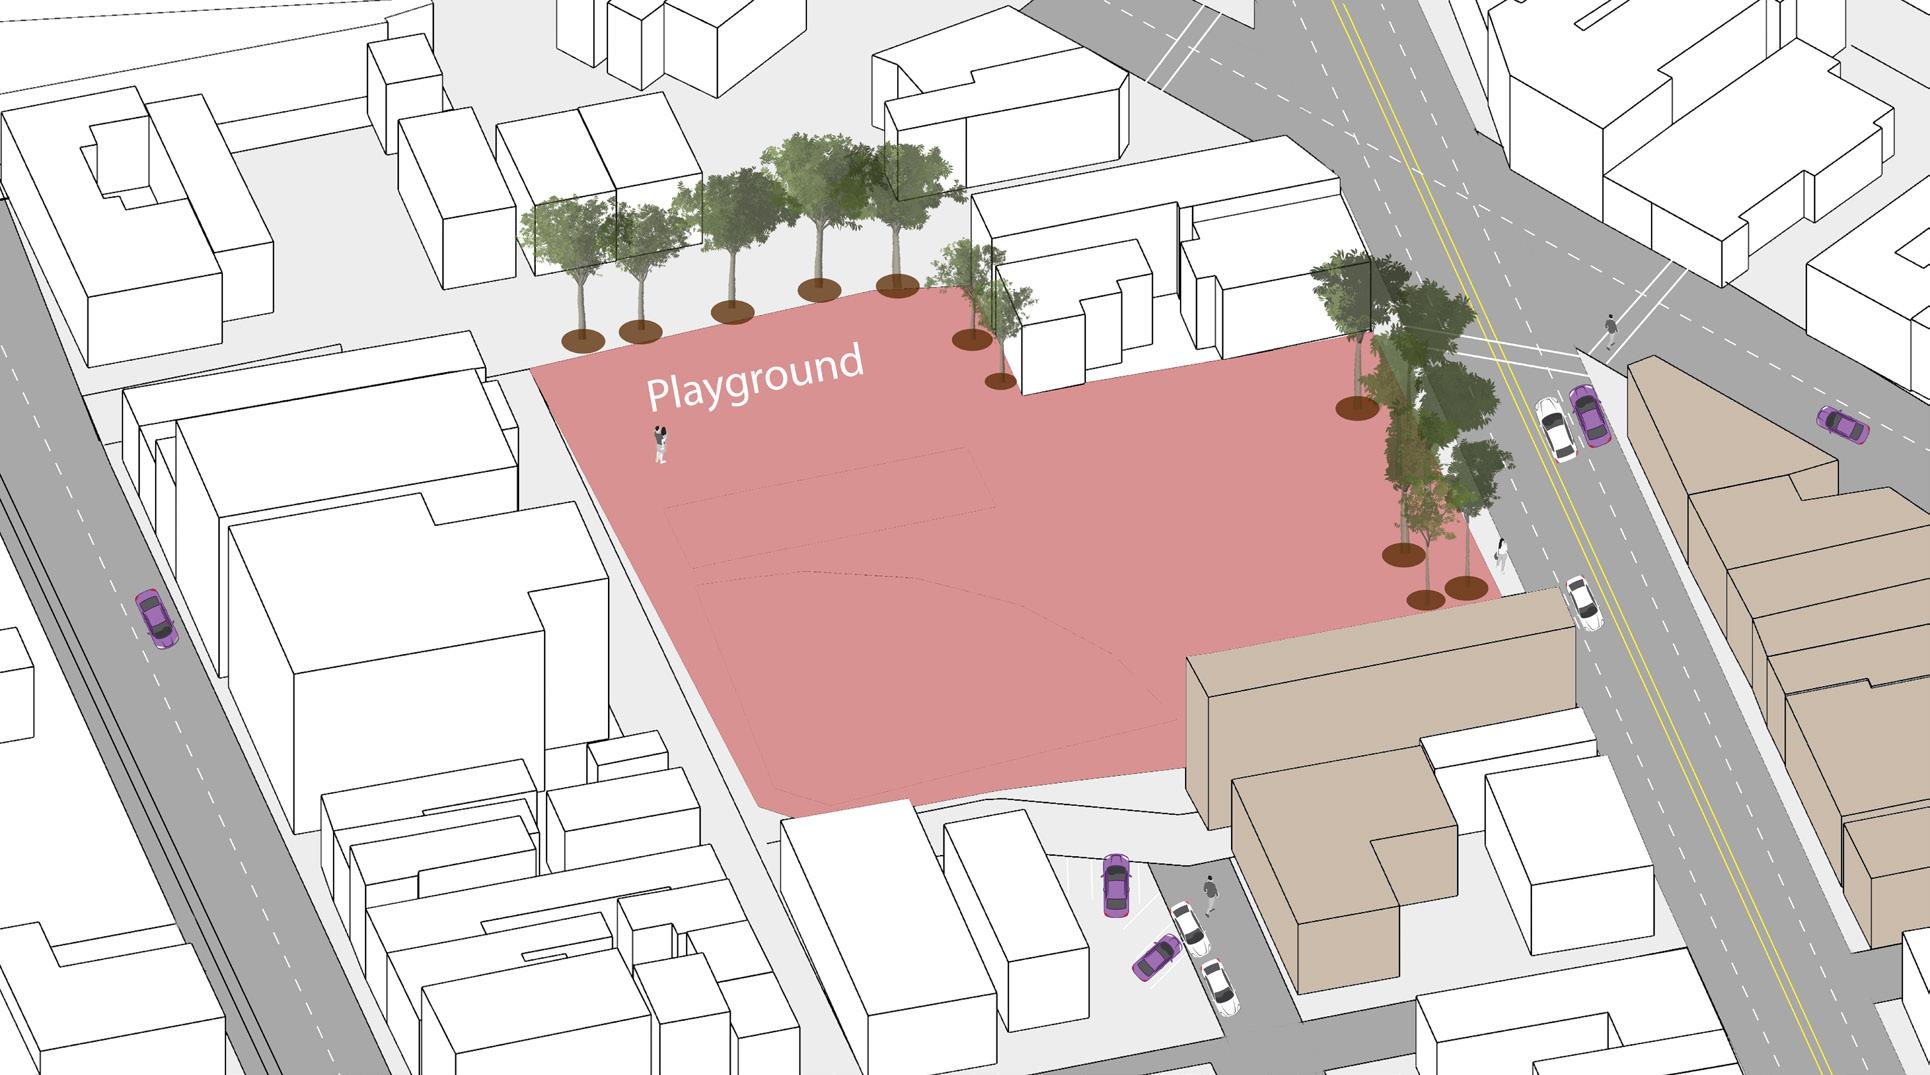
Bad Urbanism is represented by a place being vehicle oriented, vacant lots, a lack of greenery, a feeling of unsafety, unkept roadways & sidewalks, damaged buildings and more. As planners, we must find ways to create a safe environment thats walkable and allows access to the many things we need on a daily basis.

BAD URBANISM
| Site Analysis
21 Republic Street SidewalkSidewalkParking Lot 20 Feet33 Feet 7 Feet7 Feet Pedestrian WalkwayParking Pedestrian WalkwayStreet Parking


| Site Analysis 22
Analysis Mapping |
23
NORTHSIDE DISTRICTS
In the Understanding the Urban Environment class we looked more in depth on districts and what they actually represent and how they should be identified based on a place. In Northside, there were distinct locations that brought about how I categorized its districts.

UC CAMPUS IMAGEABILITY
UC CAMPUS IMAGEABILITY
LEGEND
LEGEND
District Node
Pathway
Landmark
District Node Pathway
Landmark Edge
UC IMAGEABILITY
Imageability maps provide us with insight to 5 major elements being, 1. Districts 2. Nodes 3. Pathways 4. Landmarks 5. Edges. Using Illustrator to create a map like this allows for quicker work than it would have taken to hand-draw it. Another useful tip was being able to change the opacity in a district so other important features will still be highlighted.

Sage Morrison AcademicLeisure AthleticResidential
Vehicular Pedestrian | Illustrator
Sage Morrison AcademicLeisure AthleticResidential
Edge Vehicular Pedestrian 24
UC CAMPUS
These two maps are the inverts of each other and highlight distinct things on both. 1. Buildings 2. Pathways. This gave insight for the future if there is ever a need to highlight certain aspects of a place in different ways.
| AutoCAD
25
UC CAMPUS

Throughout my time in DAAP, GIS has always been a huge help when finding data and creating maps for projects. You simply just have to download a layer and add it. GIS will follow me wherever I go.


| GIS
26
UC IMAGEABILITY
Another Imageability map, but this time it’s hand-drawn. I chose to show this map because it was one of the first maps I made my freshman year. Creating maps digitally is a lot easier but sometimes you can’t be as creative and flexible with it. Doing things, at least at the beginning, with a pen or pencil and paper brings a greater understanding to what you’re doing. It makes you think more.

| Hand-Drawn
27
Extra Works
| 28
1ST ASSIGNMENT
One of our first tasks was to show how well you can present your drawing abilities to display multiple different and unique designs whilst incorporating a structure of patterns and textures into your artwork. By incorporating the UC into mine, it creates it to be a pattern flowing through it that tells a story.

| Compositions 29
MOHAWK AREA PLAN ANALYSIS
Since the start of the 21st century, the city of Cincinnati has been trying to revitalize its Over-the-Rhine urban core in the historic sense. After finalizing its comprehensive plan in 2002, the area of Mohawk was defined and goals for its area came into place. In 2018, a local historic district within Mohawk was brought about. Geographically speaking, the Mohawk area is narrow, almost like a hallway, that lies north of Overthe-Rhine and West End, south of CUF (the communities of Clifton Heights, University Heights, and Fairview), as well as Mount Auburn. Demographically speaking, the Mohawk area is quite small in size and is split halfway between multiple census tracts, making them overlap and thus gathering accurate data is laborious. Economically speaking, development in the Mohawk district has been led through incentives by Tax Increment Financing (TIF) and Opportunity Zones. These help to give financial support to infrastructure improvements and projects. Planning for improvements and projects focused on neighborhood benefits. Roadways, parking, lighting, sidewalks, and vacant buildings. Being established in 1792, a majority of its built environment dates back to the mid-late 1800's during industrialization. This resulted in the architectural styles of Greek Revival, Italianate, Second Empire, and Rundbogenstil that are still present today. The Mohawk area is described to be a Historic Brewery District with residential and commercial mixed-use land, as well as having industrial aspects. More and more plans for this area have been drawn up and comprised into the Mohawk Area Plan, so it is safe to say that the city is not starting from square one. The main priorities for this area plan are committed on revitalizing this historic neighborhood in ways as
of serving as a guide for decisions relating to the physical development of Mohawk's community. The visions for the Mohawk Area Plan are: 1. To develop Mohawk into a safe, assessable, and greatly connected neighborhood community (Connectivity), 2. Create a prosperous business district that provides revitalizing the neighborhoods historic elements (Economic Development), 3. Create a safe and attractable built environment for the experience of those who come to and live in the area (General Improvements), 4. Provide diverse housing for all levels of income (Housing), 5. Create an area open to ideas and collaborative thoughts to solve problems that arise (Big Ideas and Challenges).
When summarizing the Mohawk Area Plan, consideration of the amount of community involvement must be considered for how well the planning process played out in the end. To make improvements to a city or neighborhood, there must be community ideas brought into place. The people who live in the area call it their home and must have their own desires put above planners who are trying to implement change. Working together to create a beautifully planned outcome takes time and motivation, but with the right tactics and people, life will be brought to an area. The planning process consisted of community involvement meetings, as well as public outreach, spanning between 2016 all the way until 2019 when the approval of the plan came from the Cincinnati City Council. The Community, the City of Cincinnati, NonProfits, and Non-Governmental Organizations all joined together to make this a reality. Here’s how they did it.
| Writing Sample
30
