
WELCOME TO THE WATERSHED ALLIANCE STREAM MONITORING PROGRAM!
Watershed Alliance (WA) is an education program led by Lake Champlain Sea Grant. Watershed Alliance provides support for basin-wide science across the Lake Champlain watershed educational community, specifically in water quality monitoring for k-12 students and their teachers. The primary objective of WA is to increase awareness and knowledge of watershed issues in youth across the Lake Champlain basin.
Our program takes a watershed approach to improving water quality. So, what is a watershed?
As defined by NOAA, a watershed is a land area that channels rainfall and snowmelt to creeks, streams, and rivers, and eventually to outflow points such as reservoirs, bays, and the ocean.
The mission of Lake Champlain Sea Grant is to develop and share science-based knowledge to benefit the environment and economies of the Lake Champlain basin. Our audience includes business, state, and local leaders and the communities they serve.
This handbook was designed to support Watershed Alliance’s Stream Monitoring and Stewardship Program. It provides background information on water quality monitoring in an educational context and directions on how to lead a stream monitoring program. The Stream Monitoring and Stewardship Program is divided into the following series: classroom introduction, field science inquiry, and stewardship and community outreach. Although the time commitment for each component varies depending upon your specific program objectives, all are integral to the overall success of the program.
Watershed Alliance: A Program of Lake Champlain Sea Grant, UVM Extension, SUNY-Plattsburgh, and the Lake Champlain Research Institute with additional funding support from the Lake Champlain Basin Program and NEIWPCC.
SUNY Plattsburgh
Lake Champlain Research Institute 101 Broad Street, Plattsburgh, NY 12901 watershed@plattsburgh.edu
University of Vermont
Rubenstein Ecosystem Science Laboratory 3 College Street, Burlington, VT 05401 Watershed.Alliance@uvm.edu
GUIDE TO USE THIS HANDBOOK
Water is a nonrenewable resource, a delicate and critical link between all living and nonliving things. This handbook is meant to guide teachers, students, and volunteers through the stream monitoring and stewardship program facilitated by Lake Champlain Sea Grant’s Watershed Alliance program.
Words that appear in bold and blue are defined in the glossary at the back of this handbook.
In the back of this handbook and online you will find a list of supplemental materials such as datasheets, equipment lists, pre- and post-assessments and much more. Additionally, any further supporting documents can be found on the Stream Monitoring and Stewardship webpage go.uvm.edu/seagrantstreammonitoring
We’d love to see photos of your work – share with us on social media: @LakeChamplainSeaGrant
ACKNOWLEDGEMENTS
DEVELOPED BY:
Ashley Eaton, University of Vermont — Lake Champlain Sea Grant
Caroline McKelvey, University of Vermont — Lake Champlain Sea Grant
Nate Trachte, State University of New York at Plattsburgh — Lake Champlain Sea Grant
Kris Stepenuck, University of Vermont — Lake Champlain Sea Grant
Marisa Immordino, University of Vermont — Lake Champlain Sea Grant
Kate Warner, University of Vermont — Lake Champlain Sea Grant
CONTRIBUTORS AND/OR EDITORS:
Erin De Vries
Don Fox
Jurij Homziak
Mark Malchoff
Marley Myers
Catrin Noel
Bethany Sargent
Elissa Schuett
Amelia Tarren
Julianna White
INTRODUCTION:
WATER QUALITY IN THE LAKE CHAMPLAIN WATERSHED
INTRODUCTION TO WATERSHEDS
A watershed is an area of land where all of the water drains into a specific water body, such as a stream, river, or lake. Watersheds can also be referred to as basins. Larger watersheds are made up of numerous smaller watersheds, which are called sub-watersheds. Watersheds are separated from one another by rises in land elevation. Everyone lives in a watershed! When it rains or snow melts anywhere in the Lake Champlain Watershed, that rain or snowmelt begins a downhill journey toward Lake Champlain. Our watershed is home to mountains, valleys, streams, cities, people, plants, and animals. The one thing that connects them all is water.
1

THE LAKE CHAMPLAIN WATERSHED
Outside of the Great Lakes, Lake Champlain is one of the largest freshwater bodies in the United States and is a highly valued international resource. The Lake Champlain basin encompasses 8,234 square miles (21,326.0 square kilometers) of mountains, forests, streams, farmlands, and communities which all drain into Lake Champlain. The lake is 120 miles long (193.1 kilometers), 400 feet (121.9 meters) at its deepest point and 12 miles (19.3 kilometers) across at its widest point (Lake Champlain Basin Program). It flows from Whitehall, New York north between Vermont and New York, and across the U.S./ Canadian border to its outlet at the Richelieu River in Quebec, Canada. From there, the water joins the St. Lawrence River, which eventually drains into the Atlantic Ocean at the Gulf of St. Lawrence.
According to the Lake Champlain Atlas the population of the basin is approximately 580,000 people who live in the U.S. portion of the basin: 70% live in Vermont and 30% live in New York (Lake Champlain Basin Program, 2021). About 25,000 people live in the Quebec portion. Approximately 145,000 people, or about 24% of the basin population, depend on Lake Champlain for drinking water (State of Lake Report, 2021).
FIGURE
INTRODUCTION:
WATER QUALITY IN THE LAKE CHAMPLAIN WATERSHED

WATER QUALITY
Additionally, there are 11 major sub-watersheds/ tributaries that empty into Lake Champlain. See map on page 4.
Lake Champlain’s shoreline is 587 miles long. The lake is centered within a watershed that is 19 times larger than the lake itself, creating a ratio of 19 parts land to 1 part water. This high watershed-to-lake area ratio, 3-4 times larger than the Great Lakes, represents the drastic impact land use management has on Lake Champlain’s watershed. Many people who live in the Lake Champlain watershed are dependent on the lake for jobs, recreation, and quality of life. People from around the world visit the lake and basin to enjoy its cultural and military history, abundant biological resources, and opportunities for recreation.
In Vermont, the Vermont Agency of Natural Resources Watershed Management Division – Monitoring, Assessment and Planning Program is the governing body responsible for monitoring and assessing these waterways, providing support and guidance to volunteer monitoring groups, providing grants and technical support for nonpoint source pollution management, implementing regulatory programs, preparing watershed plans for the major sub-basins, and developing strategies for bringing waters into compliance with water quality standards. In New York, the New York State Department of Environmental Protection Division of Water is responsible for these same types of management, support and funding activities and opportunities.
Every two years, all states and federally-recognized tribes are required to report impaired waters (water that fails to meet state or tribal water quality standards) to the U.S. Environmental Protection Agency. For impaired waterways the Clean Water Act requires a Total Maximum Daily Load (TDML) to be determined to address and regulate water quality impairments. A TMDL is sometimes referred to as a “pollution diet.” It dictates the amount of a given pollutant that can enter a body of water without negatively impacting water quality. Each TMDL is supported by an implementation plan that defines actions and steps people can take to achieve necessary reductions in pollutant inputs to the impaired water body. Vermont water quality reports, standards, and fact sheets can be found at the following website: www.vtwaterquality.org Water quality reports, standards and educational information about New York’s water resources can be found at: www.dec.ny.gov/chemical/8459.html.
Major Tributaries Graphic Credit : Lake Champlain Basin Program
INTRODUCTION:
WATER QUALITY IN THE
LAKE CHAMPLAIN WATERSHED
GEOLOGY OF THE LAKE CHAMPLAIN WATERSHED
Over earth’s history, the Lake Champlain watershed has transitioned through multiple geological formations that influenced the natural environment present in modern day Vermont and New York. Today, the Green Mountains and Adirondack Mountains create the eastern and western boundaries of the lake’s watershed, but the process that formed these mountain ranges happened over geologic time scales. Approximately 1 billion years ago during the supercontinent, Pangea, the Grenville orogeny occurred forming the Adirondack mountains.


INTRODUCTION:
WATER QUALITY IN THE LAKE CHAMPLAIN WATERSHED
turned the once freshwater lake into the Champlain Sea. Many marine fossils have been found in ancient lake beds from organisms such as blue mussels, Atlantic cod, and seals. The most notable of the findings was the skeletal remains of a beluga whale in Charlotte, VT in 1849. These fossils provide evidence that a sea once occupied the Champlain valley. This sea also did not last as the ocean outlet was severed by a buildup of glacial debris and the salt water became diluted over time creating a new freshwater ecosystem, which we know today as Lake Champlain.
WATERSHED ASSOCIATIONS
There are numerous organizations involved in the conservation, management, and advocacy of watersheds in Vermont and in the Lake Champlain basin of New York. The Lake Champlain Basin Program maintains a list of watershed associations categorized by the basin in which they are located


Charlo e Whale
White Beluga Whale skeleton discovered in Charlo e 1849
INTRODUCTION TO STREAM MONITORING
Stream monitoring is a systematic way to assess a waterway’s ecological integrity and understand how humans may have impacted it in the past and how our actions on the land continue to influence water quality today. Through monitoring, we can compare the current state of the study area to that of water quality standards and therefore make predictions about the surrounding watershed’s health. Knowing this, we can design solutions to water quality issues and advocate for better water quality management practices in and around the stream. Furthermore, water monitoring and engagement in stewardship projects allows students to make connections between humans’ actions and the health of the environment, which helps to foster future generations of environmental stewards.
Watershed Education and Water Quality Monitoring
Topics and types of hands-on activities and associated classroom subjects that are addressed when students participate in stream monitoring.
Adapted from: M.T. Denecour, “Interactive Lake Ecology”
INTRODUCTION TO STREAM MONITORING
THE WATERSHED ALLIANCE STREAM MONITORING AND STEWARDSHIP PROGRAM
The health of a stream or stream system can be analyzed by looking at its physical, biological, and chemical characteristics. WA’s Stream Monitoring and Stewardship Program (SMSP) targets each of these components and breaks them into separate stations during the field monitoring experience. However, WA recommends that these components then be analyzed together, as each piece is interconnected and plays an important role in telling a stream’s story. Aquatic chemistry is complex and is influenced by many factors. The simplified concept map below (Figure 2) may help in understanding these relationships in an aquatic environment. The rectangles represent watershed inputs into a river or stream, while the circles represent chemical parameters we measure to determine water quality.
2
Fertilizers, Pesticides, Detergents, Sewage, Animal Waste
increase increase growth of decomposition increases
(Riverwatch Manual, 2022)
photosynthesis of algae increases
increases relates to decomposition decreases increase growth of
FIGURE
INTRODUCTION TO STREAM MONITORING
Below is a table that depicts each parameter that is measured in Watershed Alliance’s Stream Monitoring and Stewardship Program.
Physical Parameters
Surrounding Land Uses
Canopy Cover
Turbidity
Velocity
Embeddedness
Habitat Assessment
Biological Parameters
Benthic Macroinvertebrates (BMI)
Chemical Parameters
Dissolved Oxygen
Phosphorus
pH
Conductivity
Temperature
Monitoring the physical characteristics of a stream can provide a context for evaluating chemical and biological parameters. It can be a simple way of evaluating a stream’s health if time and resources are limited. Evaluating chemical indicators provides a “snapshot” of the stream at a specific moment in time. Results from one sample may be affected by ongoing events such as a heavy rainfall or a sewage leak. As such, it is useful to monitor chemical parameters on a set schedule over time to establish baseline conditions for the stream. This can allow changes to be tracked over the long-term. Finally, biological indicators or living organisms are dependent upon the chemical and physical conditions in the stream over their lifespan. Monitoring biological communities can be another cost-effective way of evaluating a stream’s health as they can give us the opportunity to look at the health of the stream at one point in time that represents its health over a longer span of time.
INTRODUCTION TO STREAM MONITORING
WATER QUALITY
DEPENDS UPON
Chemical Variables:
Nutrients, Alkalinity, pH, DO, Temperature, Organics, Solubilities, Absorption, Hardness, Turbidity
Habitat Structure:
Riparian Vegetation, Width/Depth, Bank Stability, Channel Morphology, Gradient, Instream Cover, Canopy, Substrate, Current, Sinuosity, Siltation
Biotic Factors:
Disease, Parasitism, Feeding, Predation, Competition, Reproduction
Flow Regime:
Ground Water, Land Use, Velocity, High/Low Extremes, Precipitation & Runoff
Energy Source:
Sunlight, Nutrients, Seasonal Cycles, Organic Matter Inputs, 1° and 2° Production
INTRODUCTION TO STREAM MONITORING
PROGRAM TIERS - DATASHEETS
LEARNING OBJECTIVES
Students will be able to:
Lesson 1 - Watershed Model
• Define the concept of a watershed.
• Explain connections between land use and water quality.
Lesson 2 - Making of a Healthy Stream
• Understand and identify the characteristics of a healthy northeastern stream.
• Measure chemical, physical, and biological parameters to assess stream health.
Lesson 3 - Stream Monitoring
• Use scientific methods to collect data on the physical, chemical, and biological stream monitoring parameters.
• Interpret physical, chemical, and biological assessment results and relate them to surrounding land use.
Lesson 4 - Data Analysis and Interpretation
• Understand that aquatic organisms need specific environmental conditions to survive and that stream systems are dynamic and constantly changing
Lesson 5 - Stewardship
• Use data and their local knowledge to design an appropriate stewardship project to improve water quality of their stream reach.
INTRODUCTION TO STREAM MONITORING
VERMONT STANDARDS TABLE
Standard
NGSS Earth’s Systems
4-ESS2-1
Make observations and/ or measurements to provide evidence of the effects of weathering or the rate of erosion by water, ice, wind, or vegetation
ELA/Literacy W.4.8
Recall relevant information from experiences or gather relevant information from print and digital sources; take notes and categorize information, and provide a list of sources. (4-ESS2-1)
Math MP.2
Reason abstractly and quantitatively. (4-ESS2-1)
Ecosystems: Interactions, Energy, and Dynamics
MS-LS2-1
Analyze and interpret data to provide evidence for the effects of resource availability on organisms and populations of organisms in an ecosystem.
MS-LS2-4
Construct an argument supported by empirical evidence that changes to physical or biological components of an ecosystem affect populations.
Ecosystems: Interactions, Energy, and Dynamics
HS-LS2-2.
Use mathematical representations to support and revise explanations based on evidence about factors affecting biodiversity and populations in ecosystems of different scales.
and/or
HS-LS2-6.
Evaluate the claims, evidence, and reasoning that the complex interactions in ecosystems maintain relatively consistent numbers and types of organisms in stable conditions, but changing conditions may result in a new ecosystem.
Earth and Human Activity
HS-ESS3-1
Construct an explanation based on evidence for how the availability of natural resources, occurrence of natural hazards, and changes in climate have influenced human activity
Earth’s Systems
HS-ESS2-5
Plan and conduct an investigation of the properties of water and its effects on Earth materials and surface processes.
RST.6-8.7
Integrate quantitative or technical information expressed in words in a text with a version of that information expressed visually (e.g., in a flowchart, diagram, model, graph, or table).
(MS-LS2-1)
HS-.8.F.B.5
Describe qualitatively the functional relationship between two quantities by analyzing a graph (e.g., where the function is increasing or decreasing, linear or nonlinear). Sketch a graph that exhibits the qualitative features of a function that has been described verbally.
WHST.9-12.7
Conduct short as well as more sustained research projects to answer a question (including a self-generated question) or solve a problem; narrow or broaden the inquiry when appropriate; synthesize multiple sources on the subject, demonstrating understanding of the subject under investigation. (HS-ESS2-5)
HSN.Q.A.3
Choose a level of accuracy appropriate to limitations on measurement when reporting quantities. (HS-ESS2-5)
RST.11-12.1
Cite specific textual evidence to support analysis of science and technical texts, attending to important distinctions the author makes and to any gaps or inconsistencies in the account. (HS-ESS3-1) WHST.9-12.2
Write informative/ explanatory texts, including the narration of historical events, scientific procedures/ experiments, or technical processes. (HS-ESS3-1)
MP.2
Reason abstractly and quantitatively. (HS-ESS3-1)
INTRODUCTION TO STREAM MONITORING
NEW YORK STATE STANDARDS
Standard
NYS SLS 3-LS4-3.
Construct an argument with evidence that in a particular habitat some organisms can survive well, some survive less well, and some cannot survive at all.
3-LS4-4.
Make a claim about the merit of a solution to a problem caused when the environment changes and the types of plants and animals that live there may change
2_ESS2_1.
Design a solution to prevent or slow wind or water from changing the shape of the lan
MS-LS2-4.
Construct an argument supported by empirical evidence that changes to physical or biological components of an ecosystem affect populations.
MS-LS2-5.
Evaluate competing design solutions for maintaining biodiversity and protecting ecosystem stability.
MS-ESS3-3.
Apply scientific principles to design a method for monitoring and minimizing a human impact on the environment.
ESS2_4.
The water cycle
GUIDING QUESTIONS
HS-LS2-7.
Design, evaluate, and refine a solution for reducing the impacts of human activities on the environment and biodiversity.
HS-ESS3-4.
Evaluate or refine a technological solution that reduces impacts of human activities on natural systems.
HS-LS2-2.
Use mathematical representations to support and revise explanations based on evidence about factors affecting biodiversity and populations in ecosystems of different scales.
Answering what, where, when, and how to monitor is essential to have a meaningful and successful monitoring program. Your stream study objective could be to increase students’ overall awareness of the physical, chemical, and biological aspects of the stream, to have them develop basic monitoring skills, or to have them answer specific questions about the stream.
Sample Questions:
• Does this stream meet Vermont or New York (as appropriate) water quality standards?
• Does this stream provide wildlife habitat (e.g., BMI’s, birds, fish)?
• Is this stream negatively impacted by human development (e.g., leaking septic systems, erosion from construction, discharge from industry, farm runoff, removal of streamside buffers)?
• What sorts of benthic macroinvertebrates are found in this stream? Is the benthic macroinvertebrate community healthy in this stream?
• Advanced: Have stream buffer plantings been effective in reducing erosion and providing flood water storage?
INTRODUCTION TO STREAM MONITORING
MONITORING LIMITATIONS
It is important to remember the scope and limitations of projects when planning your monitoring program and analyzing the data. In particular, stream conditions are ephemeral. While one may find elevated levels of phosphorus one minute, levels may be normal the next. It is difficult to make inferences about the water quality of a stream without long-term, consistent data.
Some ways to increase the usefulness of your data:
• From year to year, always monitor at the same spot in the stream. This will provide a baseline for analysis of long-term trends.
• If you have time, try scheduling your monitoring over an extended period of weeks or months. If possible, monitor both at a series of times when your stream is at base flow to understand its background condition, and also in varying weather conditions. This may help to illustrate pollution from runoff sources.
• Try to monitor at the same time of day each time you monitor.
• If you are monitoring dissolved oxygen, morning is best, as dissolved oxygen levels will be lowest just after sunrise, allowing you to observe the lowest level of the day.
SITE LOCATIONS
The site location you select for your monitoring program will depend on your goals. When selecting a site you will want to visit the site and research the local watersheds land use and potential pollutants. For example, if you are mostly interested in monitoring impacts of road salt or impervious surfaces, you will want to select a monitoring site that is close to a road, parking area, or storm drain. A sampling site is 200 feet in length. You can use natural features such as a log or bend in the stream to mark the start and end of the stream reach. Be sure that your site location has safe and easy access for students, staff, and volunteers. More safety considerations are described in Lesson 3: Stream Monitoring.
To find stream locations in Vermont, you can use the Vermont Natural Resources Atlas and in New York you can use the DEC info Locator
WATERSHED ALLIANCE STREAM MONITORING PRE- AND POST-ASSESSMENT
NAME:
SCHOOL: PLEASE CHOOSE ONE: ❍ PRE-ASSESSMENT
FOR THE FOLLOWING QUESTIONS PLEASE CIRCLE THE BEST ANSWER:
1. What is a watershed?
a. A piece of equipment used for stream monitoring
b. Another name for precipitation or rainfall
c. An area of land where all of the water drains into a specific water body, such as a stream, river, or lake
d. A very small body of water
CIRCLE THE RESPONSE BELOW THAT BEST FITS HOW YOU FEEL:
2. I feel confident sharing what I know about watershed health with my friends and family. ❍ Strongly Agree ❍ Agree ❍ Not sure
Disagree ❍ Strongly Disagree
3. I want to change my behavior and things I do at home in order to take care of my watershed.
Strongly Agree
Agree
Not sure
Disagree
Strongly Disagree
INDICATE YOUR LEVEL OF AGREEMENT OR DISAGREEMENT WITH THE FOLLOWING STATEMENTS.
4. The stream or river is a place: Strongly Agree Somewhat Agree Neither Agree not Disagree Somewhat Disagree Strongly Disagree to connect with nature.
to watch animals and birds.
where people can find nature.
where water is an important part of the community.
where people have access to rivers.
where people come to fish.
where people have access to nature.
to canoe and boat.
to have fun in nature.
to learn about nature.
to enjoy nature’s beauty.
to grow food.
WATERSHED ALLIANCE STREAM MONITORING PRE- AND POST-ASSESSMENT
FOR THE FOLLOWING QUESTIONS, PLEASE FILL IN THE BLANKS:
5. List 2-3 water quality challenges that Lake Champlain is currently facing?
6. What action(s) can you take to improve water quality in the Lake Champlain watershed?
(optional)
7. Please describe how you will complete the action(s) you listed above (e.g., at your home, with your family, or in your classroom, etc.):
LESSON 1: WATERSHED MODEL — WHAT IS A WATERSHED?
INTRODUCTION
Watershed Alliance uses an interactive tabletop watershed model, produced by EnviroScape, to introduce the concept of a watershed. This demonstration has two parts: How Water Pollution Occurs and Preventing Water Pollution, both of which provide an introduction to the importance of watersheds. Students will then be able to apply this knowledge during the Stream Monitoring activities.
TIME REQUIRED
1 hour (45 min part 1 & 15 min part 2)
PREPARATION
• Make sure pollutant containers are filled
• Fill up spray bottle with water
• Plug and fill the lake with clean water
• Grab a rag or paper towels to help with cleanup
LEARNING OBJECTIVES (STUDENTS WILL)
• Define the concept of a watershed.
• Explain connections between land use and water quality.
ACTIVITY INTRODUCTION
First, discuss the water cycle (evaporation, condensation, precipitation and percolation) and explain how water is a finite source. The water cycle is literally recycling the water we have. Then, ask what is a watershed? A watershed is an area or region drained by a river, river system, or other body of water. Watershed boundaries are defined by the shape of the land (topography). This means that watersheds are like bathtubs. Imagine that the bathtub is the watershed, and the drain is the river or lake. Any water that falls inside the tub (watershed) will eventually go down the drain (river or lake) carrying dirt and soap with it. The high sides of the tub (like mountains and hills) keep the water from ending up on the floor (or in other watersheds). Furthermore, watersheds are nested within one another. T hese are called sub-watersheds. For example: the Lake Champlain watershed is a subwatershed within the St. Lawrence River watershed and eventually the Atlantic Ocean watershed.


LESSON 1: WATERSHED MODEL — WHAT IS A WATERSHED?
Next, highlight the different land uses on the Watershed Model (see table of examples below). Explain that each of these different land uses can introduce different pollutants to the landscape. During this set-up phase of the lesson, use the “questions to ask” section in the table below. Get specific, and try to link this model to the sub-watershed you are in or to the Lake Champlain watershed in general. Take the time to point out and briefly touch on each of the following land uses before transitioning to Part 1: How Water Pollution Occurs.
EXAMPLES OF DIFFERENT LAND USES
Watershed Model Land Uses Questions to Ask Teaching Notes
• What might this farm be growing/raising?
Farm
Factory/Industrial Plant
Mountaintop
Neighborhood
Construction Zone
Wastewater Treatment Plant
• Are there any farms here (in this town)?
• Are there any factories like this in your town? Are they located near water?
• Name the mountain.
• What does it look like? Are there trees, just dirt, mining etc?
• Are the lawns mowed? What is the length of the grass?
• Do these families have pets?
• What would you like to be built here?
• What does it look like is happening?
• What does a wastewater treatment plant do?
Lake and Streams
• What is the name of the lake and stream?
• Farming as a profession is very common in the school sites visited; most of the time students will be able to name a farm (or make one up).
• Discuss the importance of local farms.
• Allow students to create their own factory.
• Draw connections between outdoor recreational experiences and the model.
• Address the importance of roots and vegetation in the context of erosion.
• Treat this like an urban area, meaning that the people of the town most likely live in this complex.
• Students can get very creative; construction can lead to many different things - a stadium, a new office, new housing, etc.
• Explain how a wastewater treatment plant releases newly-cleaned water back into the environment with minimal negative impact.
• Highlight that there is never any “new” water - water is simply recycled and reused
• It’s good to have students thinking of a body of water that is close to them personally and physically.
LESSON 1: WATERSHED MODEL — WHAT IS A WATERSHED PART
1: HOW WATER POLLUTION OCCURS
1. Ask participants to describe what they think of when they hear the word pollution?
• Pollution is the introduction of harmful materials into the environment. These harmful materials are called pollutants. Pollutants can be natural, such as volcanic ash. They can also be created by human activity, such as trash or runoff produced by factories. Pollutants damage the quality of air, water, and land.
2. Explain that pollutants can be categorized into two different sources of pollution: point and nonpoint source pollution.
• Point source pollution is a pollution source that can be traced back to a specific starting point such as a pipe or drain. Knowing the starting point allows for an easier time identifying and controlling the pollution before it enters waterways.Point source pollution has been regulated by the federal government since 1972 with the passage of the Clean Water Act (although there are non-compliance issues)
• Nonpoint source pollution is a source of pollution that is impossible to measure where it specifically came from as it has come from numerous sources from across the landscape. Nonpoint source pollution flows into surface water bodies in stormwater runoff. Nonpoint source is the major source of pollution in Lake Champlain. Although it is such a large problem, it is largely unregulated, and pollution prevention (best management practices) is voluntary.
Examples of Point Source Pollution
Industrial Plant (discharge pipe)
Examples of Nonpoint Source Pollution
Small unregulated farm (erosion, fertilizers and pesticides, herbicides, manure)
Wastewater Treatment Plant pipe and combined sewer overflows Residential area (pet waste, septic systems, household chemicals, lawn/garden fertilizers, and pesticides)
Manure from a Concentrated Animal Feeding Operation (CAFO), which are farms where hundreds to thousands of animals are raised in a confined area
Forest (erosion)
Roads (salt, automotive pollutants, grease from cars)
Streambanks/lakeshore (erosion)
LESSON 1: WATERSHED MODEL — WHAT IS A WATERSHED PART 1: HOW WATER
POLLUTION OCCURS
3. Show the participants the different props that will be used on the model to demonstrate different forms of nutrient pollution. Nutrient pollution is the process where too many nutrients, mainly nitrogen and phosphorus, are added to bodies of water and can act like fertilizer, causing excessive growth of algae.
• soil/erosion – cinnamon
• fertilizers – rainbow sprinkles
• pesticides - oregano
• gas/oil – soy sauce
• salt – salt shaker
• manure – chocolate sprinkles
4. Next, move from one Land Use Site to the next. At each site, have the participants name the different forms of nutrient pollution that may be found. Give students hints if they are stuck, but try to have them come up with the answers themselves.
5. Students who answer correctly may put the nutrient pollutant on the model themselves.
It may be in everyone’s best interest to give them specific directions on how much to use (ex. shake bottle twice)
6. Pass the spray bottle to each student and allow them to spray water on the model to simulate a rain event. Have students make observations about what happens to the pollutants when water is introduced to the landscape.
Give a specific number of sprays allowed per person.
At the end, the facilitator can dump the remaining water from the spray bottle directly onto the model to simulate a more severe storm event. Ask participants to explain where the water from the spray bottle goes? What happens to the pollutants? Ask if they know what this is called? This is runoff
• Runoff is defined as excess water draining away from land or buildings. The overflow of water that drains off of your driveway is an example of runoff.
LESSON 1: WATERSHED MODEL — WHAT IS A WATERSHED
PART 1: HOW WATER POLLUTION OCCURS
7. Walk through each Land Use Site and discuss how nutrient pollution from each site enters the watershed (see explanations below).
Land Use Sites
Construction Zone
Residential Lawns
Runoff Explanation
• No vegetation or silt fencing to hold soil
• Discuss trees and root systems
• If too many pesticides and/or fertilizers are applied they may runoff and not be absorbed by plants, especially if applied right before a rainstorm.
• Shorter grass has a less-developed root system and thus cannot absorb as much water as the root systems in longer grass can. That is why grass is recommended to be a minimum of 3 inches in height.
Roads and Parking Lots
Streambanks and Lakeshore
Forest Clearing
Crops
• Impervious surfaces do not allow stormwater runoff to infiltrate the ground. This allows pollutants to be carried in stormwater runoff directly to storm drains.
• Runoff entering waterways from parking lots and roads tend to be warmer than water that has filtered through the soil to enter waterways.
• Impervious surfaces also allow stormwater runoff to enter waterways more quickly than normal. This increases the chance of erosion on streambanks.
• Lack of vegetation and associated root systems, create a less stable soil environment leading to erosion.
• Lack of vegetation, heavy equipment, and steep slopes are factors that accelerate erosion processes. Plowed fields consist of disturbed soils that are vulnerable to erosion.
• If too much pesticides and/or fertilizers are used, these chemicals may not be absorbed by plants. Excess chemicals on crop fields eventually accumulate as runoff.
8. Review and summarize
It is important to keep in mind that some nutrients are essential for life such as phosphorus and nitrogen. A balance of phosphorus and nitrogen for example are necessary for plant growth, but when their levels are too high, they become pollutants. For example, excess phosphorus and nitrogen in water bodies results in eutrophication. When excessive nutrients enter a body of water, frequently due to runoff from the land, it can cause a dense growth of plant life and death of animal life from lack of oxygen. Therefore, it is key to reduce the amount of pollutants that enter our waterways.
LESSON 1: WATERSHED MODEL — WHAT IS A WATERSHED PART 2: PREVENTING WATER POLLUTION
Prep Work: Clean/prepare model for Part 2. Note: This includes draining the lake, wiping off grime from the model and refilling the lake with clean water.
1. Introduce the phrase Best Management Practices (BMPs)
• BMPs are systems, activities and structures that can minimize nonpoint source pollution.
• BMPs can be site and pollutant specific; therefore a single BMP may not be effective with all pollutants found at a single location.
2. Give students examples of BMPs. Explain how they will be displayed on the Watershed Model. These are mentioned in parentheses below.
• Fences (fences and barriers): separate animals from water sources
• Berms (made out of clay or foam): prevent soil erosion and minimize stormwater runoff to waterways
• Grass strips (felt strips): reduce soil erosion
• Wetlands (felt strip or sponges): collect and store extra water during large storms
• Manure containment bins: reduce the amount of fecal matter that enters waterways
• Properly maintain vehicles and farm equipment: reduce oil and gas spills
• Proper salting of roads
3. Have students build and place BMPs on Watershed Model in different locations
• Guide the discussion using BMP examples in the table below
• Lastly, use the spray bottle on the Watershed model. Have students observe how these BMP practices reduced the amount of pollutants that entered the local stream and/or river.
LESSON 1: WATERSHED MODEL — WHAT IS A WATERSHED
PART 2: PREVENTING WATER POLLUTION
Watershed Model Sites
Construction Site
Lakeshore and Streambanks
BMP on model
Surround site with grass strips or fencing
Further explanation
• Silt fencing (piece of synthetic fencing placed around construction site and staked in on the outside of the material so that any erosion is caught in the fence and cannot rip the fencing off the posts)
• Straw bales
Wetlands or berms
Farm Area Wetlands or berms
Driveways and Highways Grass strips or berms
Lawns and Golf Courses
Use pesticides & herbicides sparingly
• Reforestation (plant more trees)
• Other BMPs include selective cutting, erosion controls on logging roads.
• Crop-rotations, cover-crops, rotational grazing are all good agricultural practices.
• For crops, BMPs include appropriate use of fertilizers and pesticides (seasonal placement of fertilizers - not in the spring when the snow melts and there is rainfall, or when the ground is frozen), plant cover crops, rotate crops
• Other BMPs include fencing cows out of the stream; however, it requires farmers to provide an alternative water source and shaded area, which can be costly.
• Other BMPs include permeable surfaces, good motorist habits including preventing oil leaks, recycling used oil.
• Other BMPs include using alternative fertilizers like compost or leave grass clippings on lawns. Do not dispose of grass clippings or leaves down storm drains or in streams.
• Have soil tested to find out exactly what grass needs.
• Choose plants that are suited to the climate of your area to save on water, fertilizers, and pesticides.
Household Activities Be a smart shopper - read labels, buy the least toxic products that are biodegradable and recyclable whenever possible.
Household Waste Clean up after your pets and use less water.
Household Landscaping
Reduce the use or eliminate the use of fertilizers and herbicides. Plant native plants that increase bank stability if located near a water body.
• Use household chemicals properly; never burn or bury leftover chemicals.
• Never flush chemicals down the drain or pour into storm drains.
• Check with local solid waste managers for proper disposal of household chemicals.
• This prevents it from going into local rivers and streams.
• Plant ground cover in your yard to prevent erosion.
LESSON 1: WATERSHED MODEL — WHAT IS A WATERSHED PART 2: PREVENTING WATER POLLUTION
CONCLUSION
Wrap up the lesson by highlighting key terms (ex. watershed, nonpoint & point source pollution, erosion and runoff). Have students explain the connections between land use and watershed health. Lastly, have students highlight a couple of BMPs they learned to help improve water quality and stream health.
CLEAN UP
In classroom
• Have the students help you remove/clean/dry the tiny pieces from the watershed model and return them to their proper places.
• Empty out the bottom side of the model, which is likely filled with water, into a sink, bucket or outside on the grass.
• Wash, wipe down, and dry the model as best as possible while in the classroom.
• Place the model back in the carrying container for proper transportation.
Back at the Watershed Alliance Office
• Bring the model back to the office.
• Remove the watershed model and fully clean it with a hose (might have to scrub it).
• Wipe down with a towel.
• Leave the model out to air dry on the counter. This prevents mold and mildew from building up and reduces the smell.
• Contact your supervisor at this point to inform them of the state of the cleaning procedures so that once the gear is dried, it is put away properly.

LESSON 1: WATERSHED MODEL — WHAT IS A WATERSHED
PART 2: PREVENTING WATER POLLUTION
BONUS INFORMATION
Type of Pollution
Nutrients
Toxic Substances
Invisible Components of Runoff Explanation
• Manure (animal and human waste) and fertilizers may contribute excess nutrients (phosphorus and nitrogen) to the ecosystem resulting in eutrophication of waterbodies. This can lead to cyanobacteria (sometimes called harmful algae) blooms, which then leads to hypoxia.
• Toxins are poisonous substances (e.g., oil, pesticides, and metals) and are harmful to animals and humans.
• Some toxins bioaccumulate (e.g., PCBs, mercury) and this has led to fish consumption advisories in many areas (including Lake Champlain). PCBs are a group of man-made organic chemicals consisting of carbon, hydrogen and chlorine atoms that may cause cancer.
• While some bacteria play important roles in ecosystem functioning, some types of bacteria can cause diseases such as dysentery and typhoid fever in humans.
• Sometimes harmful strains of bacteria can infect shellfish, which in turn can make consumers, such as humans, sick.
Bacteria
Soil
Salt
• E. coli is a type of bacteria that is needed for proper digestion and therefore is common in the guts of warm-blooded animals. As most strains of E. coli are not harmful to humans, it is used as an indicator of fecal contamination of surface waters, as its presence indicates potential fecal contamination of that waterbody, and signifies greater potential for the presence of pathogens or strains of harmful bacteria.
• The Vermont and New York state standard for recreational waters is 235 E. coli/100 ml water.
• Erosion contributes excess sediment to water bodies which may affect recreational use of water, cause flooding, kill fish, destroy habitat, and disrupt fish reproduction habits.
• Erosion of soil may also increase eutrophication due to phosphorus attached to soil particles.
• At high concentrations, salt can be fatal to some aquatic animals. Salt can also change the way the water mixes and lead to the formation of salty pockets near the bottom of lakes, creating biological dead zones.
LESSON 2: THE MAKINGS OF A HEALTHY STREAM
INTRODUCTION
This lesson includes a short PowerPoint presentation, hands-on activities, and an introduction to stream monitoring equipment to prepare students for the stream site visit.
This lesson serves as an opportunity to introduce variables the students will assess during stream monitoring. The presentation addresses the following questions: What are we looking for during stream monitoring? What are the signs of a healthy stream? How are we going to measure stream conditions in a scientific way?
TIME REQUIRED
45 minutes - 1 hour
LEARNING OBJECTIVES (STUDENTS WILL)
• Understand and identify the characteristics of a healthy northeastern stream.
• Measure chemical, physical, and biological parameters to assess stream health.
MATERIALS
• Blank piece of unlined paper for each student
• Drawing implements (e.g., pencil, colored pencils, crayons, pens)
• Makings of a Healthy Stream Powerpoint Makings of a Healthy Stream
Location: Google Drive › Educator Quick Links › SMSP › Makings of a Healthy Stream OR Direct link at go.uvm.edu/seagrantstreammonitoring
• Makings of a Healthy Stream Lesson Guide NY Makings of a healthy stream Lesson Guide
Location: Google Drive › Educator Quick Links › SMSP › Makings of a Healthy Stream OR Direct link at go.uvm.edu/seagrantstreammonitoring
• A Kahoot “game controller” (e.g., phone, tablet) for each student or group of students
• Sample of the gear to be used during steam monitoring, i.e. kick net, turbidity tube, etc. (Optional)
• Backup flash drive with the Powerpoint on it
ACTIVITY INTRODUCTION
As students enter the room you should be logged into the watershd@uvm.edu Kahoot account and have the Makings of a Healthy Stream Kahoot booted up and projected. Students should get out one game controller per table (chromebook, cellphone, etc.), enter the game pin (visible once you boot up the kahoot), and then set their game controller aside and have their blank sheet of paper and drawing supplies in front of them. Once folks have all entered the game pin you can “start” the Kahoot which will reveal the first slide of the Powerpoint. If you will not be running the Kahoot trivia session, have a copy of the Powerpoint on a flash drive.
Use the Powerpoint presentation (embedded in the beginning of the Kahoot, also available via the online resources page) to introduce students to the three stations of the Watershed Alliance stream monitoring program: physical, chemical, and biological. To begin, instruct students to draw a birds-eye view of a stream,
LESSON 2: THE MAKINGS OF A HEALTHY STREAM
starting with the meandering streambanks. To do this, they should orient a blank sheet of paper longways (landscape) and draw two parallel lines that weave up and down from left to right on their page.

Instruct students to draw in the components of a healthy stream that you will mention as you give the presentation (example above). They can make bulleted notes, draw in elements discussed or use other creative means to document the characteristics of a healthy stream. Each time a new idea or characteristic of a healthy stream is discussed, that idea should be represented on their “stream notes” drawing. Let them know that you will play a round of Kahoot trivia at the end, and they will be able to use their stream drawing and notes to help them.
POWERPOINT
Encourage students to ask questions as you share the PowerPoint slides with them. You should be familiar with the Powerpoint and the ensuing Kahoot trivia and know where to place particular emphasis throughout the slideshow so as to inform the subsequent trivia game. There are speaker notes in the Powerpoint and an associated notes document that breaks down each slide with talking points. When a given monitoring technique arises in conversation, instructors can have that piece of equipment ready to give a brief overview of how the equipment works and what it measures. Be sure to always link the general concepts of watershed health, stream monitoring, and highlight the links between ecosystem and human health.
KAHOOT
Carry out the Kahoot trivia session once the slideshow is complete. Students can work individually or in groups using the stream notes drawings they created during your presentation. Note: the Kahoot can also be created as a challenge with a unique link for a class to complete after the fact as a follow up assignment. For access to the “Makings of a Healthy Stream” Kahoot please contact Watershed Alliance Leadership and they can create an individualized link to share with a given class or provide you with access to the account to run it live.
FIGURE 3
LESSON 3: STREAM MONITORING
INTRODUCTION
This lesson covers how to conduct the stream monitoring field experience. This lesson is divided into three stations: physical, biological and chemical. Each of these is 1 station of the stream monitoring program. If your stream site is located on your school campus, you may choose to conduct stream assessments at regular intervals and to compile your datasets so that you can compare stream conditions over time.
TIME REQUIRED
Ranges from 1.5-3 hours at stream site. This does NOT include travel time to the stream site.
Notes on timing – Typically, each station is about 30-45 minutes. However, this depends on teacher availability, age of the students. and availability of Watershed Alliance staff. Here are some time estimates for each tier:
• Tier 1 - 1.5 hours (20-30 minute rotation at each station)
• Tier 2 - 2 hours (30-40 minute rotation at each station)
• Tier 3 - 2.5-3 hours (45 minute - 1 hour rotation at each station)
Additionally, in order to adjust to a shorter program time period (say 1-1.5 hours), content from lesson 1 or 2 must be covered by Watershed Alliance staff, or a teacher, BEFORE the stream monitoring field experience. That way students can focus on gathering data during the field experience since content was covered ahead of time.
PREP WORK:
• It is suggested that students complete Lesson 1 & 2 before beginning Lesson 3.
• Create three student groups prior to arriving at the stream site (students will rotate through three stations)
• Print and copy data sheets (based on age level)
• Review sampling safety tips below
LEARNING OBJECTIVES (STUDENTS WILL BE ABLE TO)
• Use scientific methods to collect data on the physical, chemical, and biological stream monitoring parameters.
• Interpret physical, chemical, and biological assessment results and relate them to surrounding land use.
EQUIPMENT
In each of the following sections the equipment needed for each station will be outlined. If partnering with Watershed Alliance, there is no need to purchase these materials. During the program our staff will bring all necessary equipment. Equipment can also be borrowed from either the SUNY or UVM Watershed Alliance programs.
LESSON 3: STREAM MONITORING

FRAMEWORK OF STREAM MONITORING ACTIVITY
At the stream before breaking into the three different groups, spend 5-10 minutes introducing the program and reviewing your guiding question and learning objectives. Do a quick refresher about what they have already learned in previous lessons, and discuss the learning objectives of the Stream Monitoring lesson (outlined directly above). Lastly, review the major safety precautions (see Sampling Safety Tips below).
Next, you can send the student groups to their first monitoring station (i.e., chemical, biological or physical). Make sure there is an adult at each station before sending students to those locations. Each station should take approximately 20-40 minutes to complete depending on the age of the students and the allotted program time. During each station, have students record the necessary information on their data sheets.
At the end, gather all the students in a group for a quick debrief. Ask students a few questions about the health of the stream (e.g., does this stream have a diverse community of BMI, how embedded is the stream, what data could you share with someone to justify your opinion on the health of the stream?), have them justify their response with some of the data they just collected. At the end of the field visit, it is important to safely store the data sheets so you can discuss the results once back in the classroom. For younger student groups, the teacher may opt to collect all the data packets. We recommend that Watershed Educators or volunteers keep their own datasheet at their station (in the event that papers are lost or damaged in transit).
LESSON 3: STREAM MONITORING
AQUATIC INVASIVE SPECIES
Aquatic invasive species (AIS) are organisms that are new to an ecosystem that is outside of the organism’s natural range (pre-European settlement) and causes harm to the environment, economy, or human health. Invasives quickly learn to efficiently exploit the ecosystem that they have been newly introduced to. They often have a competitive advantage. For example, they don’t have predators from their native range present. This negatively impacts the native species that are not adapted to handle the invasive. A major problem that has contributed to the spread of AIS is our human practices of moving boats, trailers, and recreational equipment from one body of water to another.
Invasives can get stuck on equipment (boat props, trailers, fishing line, anchor, etc) when people use aquatic vehicles (boats, kayaks and paddleboards) and don’t properly clean, drain and dry all of their equipment that comes into contact with the water. Additionally, invasives can be accidentally transported in the early stages of their life (when we can’t see them with the naked eye) in bilges, motors or livewells. They are sucked in as we move our equipment through the water, or scooped up when we add fish to our livewells, allowing them to be transported to new locations. This transport of invasives to a new body of water.
An easy way to stop these hitchhikers is to thoroughly wash down the boat, trailer, and all recreational equipment that comes into contact with the water vehicle after use which is where the importance of raising awareness surrounding AIS comes into play. In the case of stream monitoring, it is important to use fresh water (from a hose or sink) to wash down any materials that have been in contact with stream water before using them at another site. Materials that should be washed down include a kick net, turbidity tube, and plastic trays used to identify benthic macroinvertebrates. According to the VT DEC, these invasives are high priority for spread prevention in Vermont watersheds (UVM Extension, n.d.):
• Water chestnut
• Eurasian watermilfoil
• Zebra mussels
• Hydrilla
• Starry stonewort
• Curly-leaf pondweed
• Variable leaf watermilfoil

• Spiny waterflea
• Fishhook waterflea
• Asian clam
• Rusty crayfish
• Alewife
• Round goby
• Quagga mussel

Photo Credit: Invasive Species Centre
LESSON 3: STREAM MONITORING
CLEANING BOOTS AND WADERS
As watershed educators and stewards, properly cleaning our equipment to limit the spread of invasive species is critical to the integrity of Watershed Alliance. In our Stream Monitoring and Stewardship Program, we frequently use boots and waders to enter the stream. Boots and waders are one of the most common vectors for transporting invasive species from waterbody to waterbody. Since the core of the Stream Monitoring and Stewardship Program involves going from stream to stream, we have to be very meticulous about how we clean our boots and waders between stream monitoring outings.
While none of the boots and waders have felt soles, it is possible that either you (one of our watershed educators) or our students/teachers/volunteers may have boots or waders with felt soles. Felt soles are used for traction, but pose a bigger challenge for cleaning for invasives, and were actually banned in the state of Vermont from 2011 to 2016 for fear of invasive species transport (specifically, Didymo aka “rock snot” and New Zealand mud snail). While it turned out that Didymo was just a native nuisance species, and felt-soled boots are now again legal in the state of Vermont, it is still crucial to take the proper precautions.
INSTRUCTIONS FOR DISINFECTING RUBBER SOLED BOOTS AND WADERS
1. First and foremost, always check, clean, and dry your gear.
a. Inspect for invasives
b. Clean off any and all mud and plant material
c. Drain water at the site
2. Scrub all equipment with tap water and a stiff vegetable brush to ensure that any bound soil or plant materials or any other organisms are dislodged.

3. Back at the office (NOT at the stream), spray all equipment with a mild soap solution (1 Tbsp per gallon of water)
4. Once you soak in mild soap then you you have three options
a. Rinse and dry OR
b. Freeze for 6-8 hours OR
c. Dry completely.
INSTRUCTIONS FOR DISINFECTING FELT SOLED BOOTS AND WADERS
1. Soak gear in a 5% soap solution (1 cup per gallon of water) or 5% salt solution (2 cups per 2.5 cups per gallon) for 30+ minutes; rinse with tap water after soaking.
2. Freeze gear for 6-8 hours or until completely frozen (the Rubenstein lab has a walk-in freezer). Dry gear until it is completely dry, preferably in direct sunlight
(Adapted from the River Alliance of Wisconsin)
LESSON 3: STREAM MONITORING
SAMPLING SAFETY TIPS
To ensure impacts on natural resources are kept to a minimum and that students enjoy a safe, positive learning experience, please review the following safety guidelines with your class before going to the field site. Once at the field site, we ask teachers or chaperones to manage students’ behaviors rather than having Watershed Educators play this role. The Watershed Alliance educators will also be attuned to students’ safety; however, their primary role is to educate your students in methods for monitoring chemical, physical and biological stream health, not to manage behaviors.
Closely manage your group in the field
• Set distinct boundaries for the group, and keep all group members within sight and hearing distance (be aware that the noise of the stream may affect this).
• Keep a first aid kit with you and accessible at all times.
• Maintain a student to adult ratio of at least 8:1.
• Make sure you and all chaperones are aware of any severe student allergies (e.g., bee stings) and know how to respond in case of an allergic reaction.
Be aware of potential field hazards
• Never sample during a thunderstorm and beware of the risk for flash floods. Check the forecast and be aware of quickly changing conditions.
• Do not let students, teachers, staff or volunteers go in water above their knees.
• Wear appropriate clothing and footwear at all times (close-toed shoes).
• Visit the site prior to bringing your students, and identify potential hazards such as high water, slippery rocks, poison ivy, and steep banks. Discuss these hazards with your students before the field trip and what precautions they need to take to avoid them.
• Scout the area for any dangerous debris such as broken glass, wire, or other sharp objects; remove, flag and/or avoid as needed.
Follow safety guidelines for handling chemicals
• Wear proper personal protection (goggles and gloves) when using chemical Hach test kits.
• Dispose of used chemicals in an environmentally-sound manner (do not dump).
• Avoid opening reagent packets under windy conditions as the chemicals can get blown onto skin or into eyes.
• Be sure to wash hands thoroughly after handling chemicals.
Limit your site impact
• Respect living organisms by caring for them gently.
• Make sure to add water to the sorting bucket or ice-cube tray before placing organisms into it, and keep in the shade, so that the organisms collected can be immediately placed in the cool water.
• Stay off of unstable and easily eroded streambanks.
• Sweep the area for any items the group may have left behind before leaving the sampling site.
• Thoroughly clean kick nets, sorting trays, boots, and gloves.
HOW TO BE
OUTSIDE RESPONSIBLY
The Stream Monitoring Program will ask you to venture outside and explore natural spaces. The following selection of Leave No Trace™ principles will help you minimize your impact on the outdoors.

Travel on durable surfaces.
Dispose of waste properly. Leave what you find.
Respect wildlife. Be considerate of others.
If you do not understand any of these principles, make sure to visit LNT.org to learn more before venturing outside.
STATION 1: PHYSICAL
ASSESSMENT
INTRODUCTION
Monitoring the physical conditions in and along a stream (riparian habitat) – from streambed composition to stream flow (velocity) to riparian vegetation – can be an effective way to evaluate a stream’s health. An example of a healthy versus unhealthy riparian area is found in Figure … Measuring such characteristics is simple, inexpensive, requires few supplies and little time. Most physical parameters can be assessed from the streambank and don’t require getting into the water. Some, like velocity, are measured in the water.
MONITORING OVERVIEW/GUIDING QUESTIONS
This section summarizes how to prepare for and carry out physical assessments at a suitable stream site. Guiding questions for your students might include:
• If your data consistently indicate good water quality, what can you and your students do to maintain it?
• If your data indicate worsening conditions, what can you and your students do to investigate land and water uses that might negatively impact the stream and address what you can change?
Instructions are provided below for completing each assessment using the physical assessment field data sheets.
EQUIPMENT:
• Set of supporting laminated documents for Physical Station
• Grade Level Appropriate Data Sheets: select the dataset tier 1, 2, or 3
• Tape measure
• Stopwatch
• Tennis or ping pong ball
• Turbidity tube
• Suggested 1-2 pair of boots or waders
STATION 1: PHYSICAL ASSESSMENT
STREAM HABITAT ASSESSMENT DATA SHEET — TIERS 1-3
Tier 1 (Elementary School - 4th & 5th) - Basic Stream Habitat Assessment
Determine the proper Points Value for each of the six sections on the datasheet by checking the correct box and filling that number into the correct Points Given section. The six sections include the following parameters:
Parameter
Streambed Composition (bottom type)
Definition
Large sediment types (cobbles and gravels) support a wider variety of organisms than smaller sediment types (sands and silts).
Streambank Stability (erosion) Streambanks that are actively eroding generally have degraded (broken down) habitats when compared to stable streams.
Speed (Velocity)
Depth of Deepest Pool
Riparian Vegetation (types of plants present)
Riparian Vegetation Zone Width (width of streambank to help control runoff and erosion)
Fast streams mix air into the water, which results in higher DO levels. High dissolved oxygen (DO) levels support a healthy, diverse aquatic community.
Shallow streams have warmer water, which results in lower DO levels. High dissolved oxygen (DO) levels support a healthy, diverse aquatic community.
The root systems of plants growing along streambanks help hold soil in place and reduce the amount of erosion that is likely to occur.
A vegetative zone serves as a buffer to pollutants entering the stream from runoff and helps control erosion. It is measured from the stream edge and beyond (on either side of the stream bank).
Add up the total points for all 6 sections and then determine the Stream Habitat Quality Score for Tier 1 found at the bottom of the page (excellent, good, fair, or poor habitat quality).
Tier 2 (Middle School - 6-8th) - Intermediate Stream Habitat Assessment
Determine the proper Points Value for each of the six sections by checking the correct box and filling that number into the correct Points Given section. The six sections include the same as Tier 1 with the addition of the following parameter.
Additional Parameter
Streambed Cover
Definition
A wide variety and/or abundance of submerged structures (i.e. logs, large rocks) in the stream supports good aquatic habitat. Additionally, it is a great hiding place for fish.
Add up the Total Score for all six sections and then determine the Stream Habitat Quality Score for Tier 2 found at the bottom of the page (excellent, good, fair or poor habitat quality).
STATION 1: PHYSICAL ASSESSMENT
Tier 3 (High School - 9-12th and College) - Advanced Stream Habitat Assessment
Determine the proper points for each of the sections by checking the correct box and filling that number into the correct Score for at the bottom of each section. The six sections include the following parameters:
Parameter
Substrate (bottom type)
Fish Cover (hiding places)
Stream Shape and Human Alterations
Stream Forests and Wetlands (riparian area) & Erosion
Depth and Velocity
Riffles/Runs (areas where current is fast/turbulent, surface may be broken)
Sub Parameter
Size, Smothering (smothered by sand/silt?) and Silting (silts and clays distributed throughout the stream?)
see figure below for different examples of cover types
Curviness or Sinuosity of Stream Channel (bends in stream) and How Natural is the Site?
Riparian Width (wide versus narrow), Land Use, Bank Erosion and Stream Shading
Deepest pool and flow types
Riffles/Runs, Riffle/Run Substrates (size of substrates)
Add up the Total Score for all six sections and then determine the Stream Habitat Quality Score for Tier 3 found at the bottom of the page (excellent, good, fair or poor habitat quality).

STATION 1: PHYSICAL ASSESSMENT
PHYSICAL PARAMETERS DATASHEET – ALL TIERS
All students should assess the following Physical Parameters at their stream site. This activity will allow them to record features and conditions of their site, improve their observation skills, and help them understand how physical conditions in and along a stream affect chemical and biological conditions in the stream.
Surrounding Land Uses
The condition of the landscape around the stream and the human activities that take place within it can have a significant effect on stream health and water quality. In many cases, the results of a physical assessment of the stream can help to shed light on the health of this landscape (see Figure 4 below).
4

Canopy Cover
This is a measure of the shading of the stream, expressed as a percentage. Stand in the middle of the stream and raise your arms until your hands point to the top of the vegetation along each streambank. If both of your arms are straight up, there is 100% canopy cover. If not, estimate the angle of coverage based on the angle of your arms as a percentage of 180 degrees (start at ground level and move up towards the sky).
FIGURE
STATION 1: PHYSICAL ASSESSMENT
Turbidity
Turbidity is a measure of water clarity or, conversely, of the tiny materials suspended in water. Such suspended materials may be soil particles, algae, plankton, microbes, and other substances. Higher turbidity increases water temperatures because suspended particles absorb more heat from the sun. This, in turn, reduces the concentration of dissolved oxygen (DO) because warm water holds less DO than cold water. High turbidity also reduces the light needed for photosynthesis, and the suspended materials can clog the gills of fish and other aquatic organisms. If these particles settle, they can blanket the streambed, which increases embeddedness and smothers fish eggs and benthic macroinvertebrates.
Equipment: transparency tube (example image to the right)
1. Enter the stream at your sampling spot, moving slowly and smoothly so as not to stir up sediment.
2. Make sure that the release valve on the transparency tube is closed. Point the turbidity tube upstream so the water flows directly into the tube. Fill the tube to the top mark.
3. Work together to obtain a reading with one person serving as the Looker and the other as the Valve Manager. Note - have the Valve Manager practice opening and closing the valve before you complete this assessment.
Conduct either 4a. or 4b. below.

4a. Looker: Look down the tube at the secchi disk on the bottom. If you cannot see the secchi disk, ask your Valve Manager to get ready to release water until you can see just barely the black and white of the secchi disk. Valve Manager: Open the valve slowly to release water from the tube at the bottom until the Looker can just see the secchi disk at the bottom. Close the valve precisely at this point. Record the height of the water column in the tube as centimeters.
4b. Looker: Look down the tube at the secchi disk on the bottom. If you can see the secchi disk, record the height of the water column in the tube as centimeters. (The Valve Manager is not needed.)
5. Use the Transparency Conversion Chart to convert centimeters to Nephelometric Turbidity Units (NTUs) located in the appendix 4 and record on the datasheet.
Turbidity: 0 – 50 NTUs (no impact), 51 – 150 NTUs (possible impacts), > 150 NTUs (impacted) Turbidity levels not to exceed 10 NTU in cold water fish habitat as an annual average under dry weather base-flow conditions (VT DEC, 2022).
STATION 1: PHYSICAL ASSESSMENT
Embeddedness
Embeddedness refers to the extent to which rocks (gravel, cobble, and boulders) are surrounded by, covered, or sunken into the silt, sand, or mud of the stream bottom. Many benthic macroinvertebrates live in the spaces between particles on the streambed. When sediment settles between particles, these spaces are reduced or eliminated, and embeddedness increases.
1. Pick up 10 random rocks from the streambed. The bottom of the rock will usually be lighter in color than the rest, and there is often a “bathtub ring” that separates this lighter region below from the darker region above. The lighter part of the rock was embedded in sediment.
2. Estimate the percentage that each of the 10 rocks was embedded, record these percentages, and average the results of the ten rocks.


STATION 1: PHYSICAL ASSESSMENT
Current Velocity
This is a fun activity for all ages! And it measures an important condition of streams: the rate at which water flows along. Velocity affects sediment deposition, dissolved oxygen levels, the transport of food particles for aquatic organisms, the flushing of pollutants, and other factors. Velocity changes dramatically along a stream and correspondingly affects the physical, chemical, and biological conditions there. Velocity is measured as distance traveled in meters divided by time traveled (meters/second).
Equipment: tape measure for 10 meters, float (a ping pong or tennis ball), timer to record seconds, pen or pencil, data sheet, and clipboard
1. Choose one 10-meter section of the stream that reflects the general flow patterns of that stream section.
2. Measure 10 meters along the stream by standing in the stream and holding the measuring tape above the water between two people. Mark the upstream end (“Start”) and the downstream end (“Stop”).
3. Choose 5 people to perform this test. Read the following descriptions of each role and position them as in the diagram below.
Float Releaser: Stand upstream of the Starter facing one of the banks. Hold the float 3/4 submerged in the water in front of you. Avoid placing the float in the “eddy” caused by your legs. Release the float.
Timer: Stand on the bank with a stopwatch and start/stop the clock when those instructions are heard.
Starter: Stand at upstream marker (0 meters). When the float reaches the 0-meter mark, say “START!” The Timer starts the clock and measures the number of seconds the float takes to travel the 10 meters.
Stopper: Stand downstream of the Starter at marker 10 meters. When the float reaches your mark, say “STOP!”
Float Catcher: Stands downstream of the Stopper and grabs the float when it travels past the Stopper.

Do the float test again and record the results from the first and second test on the field sheet, then average the two times. Complete the velocity formula.
Velocity = meters/second (Velocity Example = 10 meters/20 seconds = 0.5m/s)
STATION 2: BIOLOGICAL ASSESSMENT
INTRODUCTION
Stream organisms are often studied to generate information on stream health and water quality. While certain communities, such as fish and aquatic plants, are valuable ecological indicators, one community of aquatic organisms – benthic macroinvertebrates – is an especially useful indicator in a stream system.
Macroinvertebrates are organisms without backbones (vertebrae) that are small, yet big enough to see without magnification. Aquatic macroinvertebrates include insects, snails, worms, and crayfish. In the flowing water of a stream, most macroinvertebrates must attach to or hide under objects on the streambed to resist the pull of the current. Because they inhabit the “benthos” (streambed), they are called benthic macroinvertebrates (BMIs).
BMIS ARE EXCELLENT INDICATORS OF STREAM HEALTH AND WATER QUALITY FOR A NUMBER OF REASONS:
• They are easy to collect with inexpensive equipment that can be used repeatedly.
• Many are sensitive to changes in the physical, chemical, and/or biological conditions of the stream.
• Because they are small and can’t move around easily in the current, they can’t travel far to escape pollution events.
• They are critical components of the stream’s food web and are the base of many food chains (see Figure on next page).
• They are ubiquitous, meaning they are found in streams worldwide.
Types of BMI:
• Arthropods - insects, crayfish
• Mollusks - clams, snails
• Annelids - segmented worms
• Nematodes - roundworms
• Platyhelminthes - flatworms
Major
Groups of Insects
• Mayflies - Ephemeroptera
• Caddisflies - Trichoptera
• Stoneflies - Plecoptera
• Midges - Diptera
• Beetles - Coleoptera
• Damselflies - Odonata (Zygoptera)
• Dragonflies - Odonata (Anisoptera)
OPTIONAL RESOURCE - DOWNLOAD THE POCKETMAROS APPLICATION
PocketMacros is a handy visual guide designed to help identify and learn about aquatic macroinvertebrates. The app includes a field guide section, an interactive identification key, and flashcard practice modes. This companion app to Macroinvertebrates.org: The Atlas of Common Freshwater Macroinvertebrates of Eastern North America is funded by the National Science Foundation and aims to support watershed stewardship, water quality biomonitoring, environmental education, and recreational fishing.
STATION 2: BIOLOGICAL ASSESSMENT
WHAT AND HOW DO THEY EAT?
Macroinvertabrates may be categorized by their feeding groups - the type of food they eat and the manner in which food is obtained/collected.
Shredder: Feeds on coarse, dead organic matter (leaves, grasses, algae, and rooted aquatic plants), breaking it into finer material that is released in their feces. Shredders include stonefly nymphs, caddisfly larvae, cranefly larvae.
Collector: Feeds on fine, dead organic matter, including that produced by the shredders. Filtering collector: Filters particles out of flowing current. Examples include blackfly larvae and netbuilding caddisflies.
Gathering collector: Gathers matter while crawling along the river bottom. Gatherers include mayfly nymphs, adult beetles, midge larvae.
Grazer: Grazes on algae growing on rocks in the streambed or on vegetation. Grazers include snails and water pennies.
Predator: Feeds on other invertebrates or small fish. Mouth parts are specially adapted to feed on prey. Dragonflies and damselflies have scoop-like lower jaws, the jaws of hellgrammites (dobsonflies) are pincher-like, and water strider’s mouth parts are spear-like. Also includes beetle adults and larvae.
POLLUTION TOLERANCE INDEX

BMIs have different levels of tolerance for low water quality. Certain taxa or groups of organisms are known to be more or less tolerant of polluted conditions of a stream. The presence or absence of these organisms can be used to evaluate the level of pollution or human disturbance of a stream. This analysis breaks stream invertebrates into 4 groups, and the presence or absence of these organisms can be used to calculate a “Pollution Tolerance Index” for a stream. Examples of the different groups and taxa can be found in Figure 5
FIGURE 5
STATION 2: BIOLOGICAL ASSESSMENT
MACROINVERTEBRATE IDENTIFICATION KEY

STATION 2: BIOLOGICAL ASSESSMENT
In general, high BMI diversity, including types of BMIs that are sensitive to pollution and degraded physical conditions, indicates a healthy stream. Below are some examples of different habitat parameters that impact different taxa of BMIs.
HABITAT PARAMETERS FOR SELECTED MACROINVERTEBRATES*
pH Ranges for Selected Macroinvertebrates (pH ranges 1-6 and 10-14 are unsuitable for most organisms)
Mayfly
Stonefly
Caddisfly
Snails
Clams
Mussels
Temperature Ranges for Selected Macroinvertebrates
Mayfly
Stonefly
Caddisfly
Water Penny
Water Beetle
Water Strider
Dragonfly
Minimum Dissolved Oxygen Levels for Selected Macroinvertebrates
TAXA
Stonefly
Water Penny
Caddisfly
Some Mayfly
Dragonfly
True Bugs
Damselfly
Mosquito
Midge
Pouch Snail
Rat-tailed Maggot
* The values provided are preferred ranges for most species of these groups of organisms.
STATION 2: BIOLOGICAL ASSESSMENT
STUDENT FIELDWORK ACTIVITIES AND EQUIPMENT
There are three versions, or tiers, of the Biological Assessment. Please review each tier and choose the one that is appropriate for your students based on their grade and their level of experience with BMI work. Each tier will be facilitated with the corresponding field sheet. Outside of the field sheet, all tiers require the same equipment.
EQUIPMENT:
• ice cube tray
• flat trays
• 5 gallon bucket(s)
• hand lenses
• forceps
• spoons
• d-net or kicknet
MONITORING GUIDELINES
This section summarizes how to prepare for and carry out BMI assessments at a suitable stream site. We encourage you to conduct BMI assessments at regular intervals and to compile your datasets so that you can compare stream conditions over time. Ask your students - Do conditions stay the same? If your data consistently indicates good water quality, what can you and your students do to maintain it? If your data indicate worsening conditions, you and your students can begin to investigate land and water uses that might negatively impact the stream.
Regularly completed assessments that are compiled into a database form the foundation of a stream monitoring program. Your regular assessments can help you monitor your stream’s health, design stewardship activities to improve water quality, and measure the effectiveness of your efforts.
• Macroinvertebrate Identification Key
• Pollution Tolerance Index (PTI)
• BMI dichotomous key (river/stream side)
• Pencil
• Set of supporting laminated documents for Biological Station

STATION 2: BIOLOGICAL ASSESSMENT
SELECTING A BMI SAMPLING SITE
1. Find a riparian area that provides your students with good access to the stream. It should be big enough to allow all students to work comfortably and to move around safely.
2. Find a long riffle that can accommodate 3 replicate samples, or several riffles in the same region of the stream. A riffle is a shallow area with a gravelly or rocky bottom and turbulent (choppy) water. If the stream is healthy and water quality is good, a diverse community of benthic macroinvertebrates (BMIs) will be present in the riffles of the stream. Some of these BMIs are sensitive to pollution and physical degradation, some are moderately sensitive, and some are tolerant of poor conditions.
3. Look for a riffle that has cobbles on the streambed. Cobbles are rocks that are 5 to 25 centimeters (about 2 to 10 inches) in diameter. Ideal sampling sites consist of cobbles sitting on top of pebbles. Avoid streambed materials dominated by rocks larger than 50 centimeters (about 20 inches) in diameter.
4. The water at your sampling site should be knee-deep or shallower. Sample in the main channel, unless the water is too deep. Avoid areas along the margins that may be dry during low flows.
5. Avoid currents that are so fast that students must strain to stay upright while standing in them.
6. Avoid bridges and other large human-made structural features. If unavoidable, sample at least 50 meters (about 54 yards) upstream of a bridge or 200 meters (about 218 yards) or more downstream of a bridge.

STATION 2: BIOLOGICAL ASSESSMENT
BENTHIC SAMPLING TECHNIQUES
Using a kick net - All Tiers
The kick net is 1 meter long and made of 500 to 600 micron mesh. You may also choose to use a d-net style tool, but the following steps should remain similar. Your goal is to disturb 1 square meter upstream of the net to dislodge benthic macroinvertebrates that live there and allow the current to carry them into the net that is being held by one or two students a meter or so downstream.
Please note: use the procedure below to collect BMIs from 3 sampling spots in your riffle. Combine all BMIs caught to create one aggregate collection.
Teaching tip: In the event you have limited time, or find a particularly exciting sample that you would like to share with the entire class, you can save a tray of macroinvertebrates for subsequent groups. If you choose to do this, ensure this sample does not repeatedly get counted on your data sheets.
2 or 3 students in a group can manage the net and collect the sample, as follows:
• With the kick net in hand, the Net Holder(s) and Kicker(s) enter downstream of your first sample spot, then walk upstream to the first sampling spot. (If you wade in upstream and walk down, every step you take disturbs the streambed and greatly reduces the accuracy of your results. See photo below.)
• Net Holder(s) – Stand behind the net and brace both handles of the kick net in the water at a 45-degree angle pointing downstream. (In a fast current, it’s much better to have two Net Holders, if using a d-net style tool only one holder is needed.)
• Kicker – When the kick net is in position, another person should step in front of it and kick, roll, and otherwise disturb the rocks with their feet to dislodge BMIs living there. This person MUST have stiff, closed-toe shoes or boots so as not to damage their toes. Rocks can also be picked up by hand and rubbed clean, allowing anything on them that is rubbed off to float downstream into the net.
Kicker: In your mind, draw a 1-square-meter space upstream of your net; this is the area you need to disturb to dislodge the BMIs that live there and allow them to float into the net you have positioned downstream. Kick and roll the rocks in this square meter area. Pick up rocks and rub all of the debris off them upstream of the net so the current carries all material that is dislodged into the net. If the streambed has soft substrate (like gravel or sand), dig down into the substrate with the toe of your boot to dislodge organisms that live within it.
STATION 2: BIOLOGICAL ASSESSMENT
When you are finished disturbing the streambed in the 1 square meter upstream of your net, remove the net carefully from the water so as not to lose any organisms, as follows:
• Net Holder(s): Grab the top of the net handles.
• Kicker: Grab the bottom of the net handles and the bottom edge of the net.
• Together, lift the net out of the water by scooping it forward, into the current. Bring the two handles together and roll the net around them, being careful not to let any crawling organisms escape from the edges of the net.


Scan the QR code to watch a video on how to use a kicknet and d-net to sample BMIs.
Photo Credit: ADK & Ausable River Association
STATION 2: BIOLOGICAL ASSESSMENT
TRANSFERRING YOUR SAMPLE INTO A 5-GALLON BUCKET AND FLAT PANS
• Put the bottom of your rolled up net and the ends of the handles into the bucket so that the handles are vertical. Pour water down the net to rinse all materials on the net into the bucket. If necessary, pick any clinging organisms from the net by hand or with tweezers and put them in the bucket.
• Look through the material in the bucket and immediately return any fish, amphibians, or reptiles to the stream.
• Carefully remove large pieces of debris (leaves, twigs, and rocks) from the sample. While holding the debris over the bucket, use forceps, and your hands to pick, rub, and rinse them to remove any attached organisms. When you are satisfied that the debris pieces are clean, discard them back into the stream.
• Carefully pour the contents of the bucket into your flat trays to be identified.
Note: If using a D-net you can transfer the contents of your net directly to a flat plan by turning the net inside out and rinsing it with a small amount of water already in the pan that has been collected from the stream. Still be sure to pick any clinging organisms from the net by hand or with tweezers.
SORTING AND IDENTIFYING BMI’S – ALL TIERS (ESPECIALLY TIERS 2 AND 3)
• Use plastic spoons to move BMIs from your flat pans to different slots of an ice tray each filled with water. Complete a rough sorting by physical features such as
• Similar-looking into different cubes of the ice tray.
• Overall body shape (e.g. worm-like, segmented, round).
• Presence or absence of jointed legs (which are different from prolegs; see below).
• Presence or absence and location of prolegs, which are stubby, soft leg-like structures (they can be at the end of the abdomen, on each abdominal segment, below the head, etc.).
• Presence or absence of antennae.
• Presence or absence and location of gills
• Presence or absence of “tails.”
• Unusual appendages.
• A clearly visible head capsule.
• Type of movement (e.g., swimming, crawling). Color and pattern (to some extent).


The figure above shows two different BMI’s with different body types, understanding the differing body parts may help you identify the distinguishing features of the various organisms.
STATION 2: BIOLOGICAL ASSESSMENT
BASIC BMI ASSESSMENT DIRECTIONS
1. First, visually identify BMIs using the Macroinvertebrate Identification Dichotomous Key.
2. This tier stops short of quantifying results. Instead students should read the prompts under “interpreting your results” on the data sheet and decide which condition most closely matches their sample
INTERMEDIATE BMI ASSESSMENT DIRECTIONS
1. First, visually identify BMIs using the Macroinvertebrate Identification Dichotomous Key.
2. Once you have visually identified different BMI’s, count and record the number you find on the data sheet titled Pollution Tolerance Index (PTI).
3. Next, once all BMI’s have been counted and recorded, calculate the Pollution Tolerance Index Rating for that body of water. To do this, notice that there are different species of BMIs divided into 4 different groups: Group 1 - Intolerant, Group 2 - Moderately Intolerant, Group 3 - Fairly Tolerant, and Group 4 - Very Tolerant. Under each of those columns is a “# of Taxa.” Record the number of Taxa for each column/group in the blank spot below each column.
4. Friendly reminder that Taxa = the number of different BMI’s in each pollution tolerant group NOT the individual number of organisms.
5. Next, multiply the # of Taxa by the weighting factors for each column. Lastly, add the final index values for each group in the black box at the bottom. That index rating can be contextualized using the box with different score ranges (excellent, good, fair or poor).
ADVANCED BMI ASSESSMENT DIRECTIONS
1. First, visually identify BMIs using the Macroinvertebrate Identification Key.
2. Next, for each BMI that you collect, check the box next to its name.
3. Then, count (or estimate) the number of individuals of this kind and enter the number in the “total count” space.
4. Lastly, circle the abundance code (Rare, Common or Dominant) for that BMI using the Abundance Code at the bottom of the sheet.
5. On the second page of the document, calculate the index value for each group. These instructions are detailed further on the data sheet.

STATION 3: CHEMICAL ASSESSMENT
INTRODUCTION
The water chemistry of a stream system plays an important role in determining the health, abundance, and diversity of aquatic life found within it. By measuring chemical parameters, it becomes possible to ascertain how suitable the water is for aquatic life or whether it is an adequate drinking supply.
Furthermore, by collecting stream samples we can make inferences about the watershed’s surrounding land use, determine whether those land uses are harmful or beneficial to the environment, and locate where better management practices could be implemented. Therefore, we encourage the implementation of a stream chemistry unit at your local stream and will provide the materials and resources to make that possible.
It is important to note that stream environment conditions can dramatically change over months, weeks, and even over the course of a single day. Therefore, monitoring a stream site frequently and at regular intervals will ensure that average stream conditions can be quantified and that the data can be comparable over time. Please keep this in mind when planning your stream chemistry unit. Regularly completed assessments that are compiled into a database form the foundation of a stream monitoring program. Your regular assessments can help you monitor your stream’s health, design stewardship activities to improve water quality, and measure the effectiveness of your efforts. This section describes how to prepare for and carry out chemical monitoring at a suitable stream or stream site.
STUDENT FIELDWORK ACTIVITIES
This chapter provides different water quality chemical assessments to target different student ability levels. Please review each of the tiers below and select the appropriate data sheet that is right for your students.
LaMotte Kits (Tier 1)
The basic water chemistry assessment uses LaMotte low-cost water quality test kits (dissolved oxygen, phosphate, and pH). These kits provide “healthy ranges” of the chemical parameter in a stream in parts per million (ppm), which is the same as mg/L. LaMotte kits are recommended for younger students because the methods for data collection are relatively simple, and the chemicals aren’t hazardous to human health. They are also biodegradable and can be disposed of directly down a drain at school.
Vernier Water Quality Probes and Hach Kit (Tier 2 & 3)
Students use water quality probes and an ipad to assess water chemistry. It uses a combination of Vernier probes (dissolved oxygen, pH and conductivity) in addition to a Hach phosphate kit. Hach water chemistry test kits provide results in milligrams per liter (mg/L), which is the same as ppm. Students must wear safety glasses and gloves, and waste must be disposed of in an environmentally-friendly manner when using the Hach phosphate kit.
For upper level students (high school or older), have them prepare a scientific report of their findings. In this report, students must pose a question, create a hypothesis, and test their hypothesis. If students are younger than high school age and at this level, they can write a simple report rather than creating a genuine scientific report.
STATION 3: CHEMICAL ASSESSMENT
If a teacher or organization is borrowing Watershed Alliance stream monitoring equipment, then a Hach dissolved oxygen and phosphorus kit plus a thermometer and pH strips will replace all probes and ipads.
EQUIPMENT AND MATERIALS
This is a list of all the chemical test kits and equipment used during the Watershed Alliance stream monitoring program. Equipment can be borrowed from either UVM or SUNY-Plattsburgh Watershed Alliance programs.
Tier 1 - Lamotte Kits
Recommended: Elementary School
• Tier 1 Datasheets
• Set of supporting documents
• LaMotte Water Chemistry Kit
• Dissolved Oxygen
• Phosphate
• pH
Tier 2 - Digital Probes or Hach Kit Recommended: Middle School
• Tier 2 Datasheets
• Vernier DO Probe (mg/L)
• Vernier Conductivity Probe (microSiemens (uS/cm)
• Vernier pH Probe
• Hach phosphate kit (mg/L)
• Ipad
• Set of supporting laminated documents for information and probes/ipads
Optional replacement for probes
• Hach DO (mg/L)
• pH strips
• Thermometer
All Tiers
• Safety Glasses
• Nitrile Gloves
• 1 Waste Jars (plastic with lids)
• 1-Gallon Plastic Bags
• Deionized Water
Tier 3 - Digital Probes Recommended: High School & College
• Tier 3 Datasheets
• Vernier DO Probe (mg/L)
• Vernier Conductivity Probe (microSiemens (uS/cm)
• Vernier pH Probe
• Hach phosphate kit (mg/L)
• Ipad
• Set of supporting laminated documents for information and probes/ipads
Optional replacement for probes
• Hach DO (mg/L)
• pH strips
• Thermometer
• Accuwipes
• pH Strips
• Thermometers
• Set of supporting laminated documents for Chemical Station
STATION 3: CHEMICAL ASSESSMENT
INSTRUCTIONS
Watershed Alliance collects data for four chemical parameters in the stream: dissolved oxygen, total phosphorus, conductivity, and pH (temperature is measured at this station but is technically a physical parameter).
SELECT A SAMPLE SITE:
1. Find a riparian area that provides good access to the stream for your class. It should be big enough to allow all students to work comfortably and to move around safely.
2. Locate a suitable spot for chemical data collection upstream of the physical and biological stations.
PHOSPHORUS
TEST
Phosphorus (P) is a naturally occurring element that is essential for life on earth. Phosphorus plays a structural role in deoxyribonucleic acid (DNA) and ribonucleic acid (RNA) and appears in adenosine diphosphate (ADP), and adenosine triphosphate (ATP). Phosphorus is also an abundant mineral element. Phosphorus in waterways can be found in two forms: particulate or dissolved. This station will be measuring reactive phosphorus in the form of orthophosphates (PO43-). Measuring orthophosphates in streams is a good way to estimate the amount of phosphorus available for algal and plant growth as this form of phosphorus is most readily utilized by organisms.
The method used by Watershed Alliance is the HACH pocket colorimeter is the ascorbic acid/”blue” method and is measuring PO43- referred to as “orthophosphate”.PO43- results combine both the phosphorus and the oxygen in the compound. This is the EPA approved method for monitoring orthophosphates. Note: Because the sample is not filtered, the procedure measures both dissolved and suspended orthophosphate.
Too much phosphorus can cause increased growth of algae and large aquatic plants, which can result in decreased levels of dissolved oxygen – a process called eutrophication. High levels of phosphorus can also lead to algae blooms, including cyanobacteria blooms, that produce algal toxins which can be harmful to human and animal health.
STATION 3: CHEMICAL ASSESSMENT
The major sources of phosphorus in the Lake Champlain basin include agricultural runoff, streambank erosion, internal cycling from lake sediments, and urban stormwater runoff.
Testing Notes
• Wear safety glasses and gloves when performing the phosphorus test.
• Collect water samples from the middle of the stream.
• Follow instructions in the manual for Hach Pocket II Colorimeter (located inside the kit and online). Wipe off outside of the bottle with kim wipes prior to measuring with the meter.
• Multiply the number provided on the colorimeter by 0.326 to get total phosphorus.
• Dispose of liquid waste in a plastic container labeled “PO4”.
• Dispose of solid waste (gloves and reagent packets) in a labeled plastic zip-lock bag.
• Rinse bottles and caps thoroughly with deionized water into a liquid waste jar.
• All liquid and solid waste will be disposed of at the Watershed Alliance lab following all lab safety protocols.

STATION 3: CHEMICAL ASSESSMENT
PH
pH is the measurement of hydrogen ions or acidity of the stream water. When the hydrogen ions (H+) and hydroxyl ions (-OH) are equal, the water is neutral. As the hydrogen ions increase, the water becomes more acidic, and as the hydroxyl ions increase, the water becomes more basic or alkaline. The pH is a logarithmic scale which ranges from acidic to basic or 0 to 14, with 7 being neutral. Each number represents a 10-fold change in the acidity or basicness of the water. For example, water with a pH of 5 is 10 times more acidic than water with a pH of 6. The range at which most aquatic organisms can survive is between a pH of 6.5 and 8.5 (see Figure 6 Riverwatch Manual, 2022). pH is an important indicator of chemical changes in waterways. For example, acid rain and mining processes can cause waterways to become more acidic. When waterways are acidic, they can leach heavy metals from wells and from pipes that bring water to people’s houses.
Testing Notes
Follow the instructions in the Stream Monitoring kit on how to connect the Vernier pH probe to the ipad. Or pH litmus paper can also be used as an alternative to the Vernier probe and ipad. Then, record the information on the datasheet.


pH: 6.5 – 8.5 (VT DEC, 2022)
FIGURE 6
STATION 3: CHEMICAL ASSESSMENT
DISSOLVED OXYGEN
Dissolved oxygen (DO) is the amount of oxygen present in the water. This is not the oxygen molecule that is in H2O but the oxygen that is dissolved between water molecules that is available for respiration by aquatic organisms. All aquatic organisms -- both plants and animals -- need oxygen to survive; the amount of dissolved oxygen needed to survive depends on the species. While each organism has its own DO tolerance range, generally, DO levels below 3 milligrams per liter (mg/L) are of concern and waters with levels below 1 mg/L are considered hypoxic and usually devoid of life (EPA, 2022). Oxygen can enter stream systems one of two ways: atmospheric oxygen dissolves into the waterway (e.g. precipitation or water turbulence) or through photosynthesis. Aquatic organisms like benthic macroinvertebrates are able to absorb the oxygen through structures on their bodies such as gills or skin. Streams with higher levels of dissolved oxygen are usually more diverse and have stable aquatic communities.
Extra Information: High rates of decomposition cause lower dissolved oxygen levels. Riffles and areas with “white water” will have higher concentrations of dissolved oxygen. Dissolved oxygen levels fluctuate between day and night; dissolved oxygen is the highest during the afternoon due to the process of photosynthesis, and the lowest at night when both plants and animals have been respiring, but plants have not been photosynthesizing. The lowest levels of dissolved oxygen will be measured in the early morning before the sun is up and photosynthesis begins. Dissolved oxygen is measured in parts per million (ppm) or milligrams per liter (mg/L).
Testing Notes for Vernier Probe
• Follow the instructions in the kit on how to connect the Vernier DO probe to the ipad. Then, record the information on the datasheet. Instructions for each method can be found online on the handbook webpage.
If using the Hach DO kit
• Wear safety glasses and gloves when performing the DO test.
• Collect water samples from the middle of the stream.
• Follow instructions in the manual for Hach DO (located inside the kit and online). Wipe off outside of the bottle with kim wipes prior to measuring with the meter.
• Dispose of liquid waste in a plastic container labeled “DO”.
• Dispose of solid waste (gloves and reagent packets) in a labeled plastic zip-lock bag.
• Rinse bottles and caps thoroughly with deionized water into a liquid waste jar.
Dissolved
STATION 3: CHEMICAL ASSESSMENT
CONDUCTIVITY (TIER 2 & 3)
Conductivity is a measure of the ability of water to pass an electrical current. Conductivity in water is affected by the presence of inorganic dissolved solids such as chloride, nitrate, sulfate, and phosphate anions (ions that carry a negative charge) or sodium, magnesium, calcium, iron, and aluminum cations (ions that carry a positive charge). Conductivity is useful as a general measure of stream water quality. Each stream tends to have a relatively constant range of conductivity that, once established, can be used as a baseline for comparison with regular conductivity measurements. Significant changes in conductivity could then be an indicator that a discharge or some other source of pollution has entered a stream.
A conductivity probe is used to measure the ability of the water sample to conduct electricity. The specific conductance is measured by passing a current between two electrodes (one centimeter apart) that are placed into a sample of water. The drop in voltage caused by the resistance of the water is used to calculate the conductivity per centimeter. The unit of measurement for conductivity is expressed in either microSiemens (uS/cm) or micromhos (umho/cm). MicroSiemens and micromhos are equivalent units.
Distilled water has a conductivity in the range of 0.5 to 3 µS/cm. The conductivity of rivers in the United States generally ranges from 50 to 1500 µS/cm. Studies of inland fresh waters indicate that streams supporting good mixed fisheries have a range between 150 and 500 µS/cm. Conductivity outside this range could indicate that the water is not suitable for certain species of fish or macroinvertebrates.
Testing Notes
Follow the instructions in the kit on how to connect the Vernier conductivity probe to the ipad. Then, record the information on the datasheet.
Conductivity: 150 – 500 uS/cm (microSiemens) (EPA)
Vermont – New Hampshire Upland:
Average = 84 • 25th percentile = 51 • 75th percentile = 118
Conductivity Versus Salinity
Solids can be found in nature in a dissolved form. Salts that dissolve in water break into positively and negatively charged ions. Conductivity is the ability of water to conduct an electrical current, and the dissolved ions are the conductors. Conductivity will vary with water source: ground water, water drained from agricultural fields, municipal wastewater, rainfall. Whereas, salinity is a measure of the amount of salts in the water. Because dissolved ions increase salinity as well as conductivity, the two measures are related.
STATION 3: CHEMICAL ASSESSMENT
TEMPERATURE
Temperature directly affects aquatic organisms that live in streams. Organisms that live in streams often have the same body temperature as the water and their body temperature will fluctuate as the water changes in temperature. They have adapted to live in a narrow range of temperatures. When the temperature of the water is outside an organism’s acceptable range, they can die. Urban areas or areas with high levels of stormwater runoff can cause rapid swings in stream temperatures, as water washes over warm pavement during a rainstorm. Water temperature is also connected to the metabolism, reproduction, and emergence of many stream organisms from their juvenile to their adult life stage. Temperature also impacts plants and algae at the base of the aquatic food chain, by impacting the rate of photosynthesis. Water temperature can also shift the impacts of various pollutants; as water warms it can cause pollutants to become more toxic. For example, plastics that end up in waterways can release heavy metals at warmer temperatures. Lastly, the amount of dissolved oxygen is directly connected to water temperature. Colder waters can “hold” more dissolved oxygen while warmer stream systems will have lower levels of dissolved oxygen, limiting which organisms can survive there. Temperature is measured in degrees Celsius (C) and Fahrenheit (F).
Testing Notes
Follow the instructions in the kit on how to connect any of the Vernier probes to the ipad. There is an option to test temperature on all of the probes. Or a thermometer can also be used as an alternative to the Vernier probe and ipad. Then, record the information on the datasheet. Temperature: Vermont Water Quality Standards for Rivers and Streams
Between 13°C (55°F) - 19°C (67°F)
Vermont Fish and Wildlife states optimum temperatures for the following cold water fish species:
• Brown Trout: optimum temperatures range from 12°C (53°F) to 19°C (66°F)
• Brook Trout: optimum temperatures between 13°C (55°F) to 15.5°C (60°F)
STATION 3: CHEMICAL ASSESSMENT
HINTS FOR PERFORMING CHEMICAL TESTS
• Practice, practice, practice! The more familiar you are with the tests, the easier they will be to perform, and the more accurate your results will be.
• Do not store chemical testing kits in your car, in direct sunlight, or in any extreme temperatures. The chemical reagents will degrade.
• Perform each test multiple times.
• Wear protective gloves and safety goggles. Do not wear sunglasses when reading the test results.
• Rinse testing tubes or bottles with sample water before collecting the sample.
• Rinse testing tubes and bottles with distilled water after completing each test.
• Wash your hands when you are finished.
CALCULATING BETWEEN CELSIUS AND FAHRENHEIT
Celsius to Fahrenheit Formula: (°C x 1.8) + 32 = °F
Example: 6°C = 42.8 °F (6°C x 1.8) + 32 = 42.8°F
Fahrenheit to Celsius Formula: (°F - 32) / 1.8 = °C
Example: 68°F = 20 °C (68 - 32) / 1.8 = 20°C
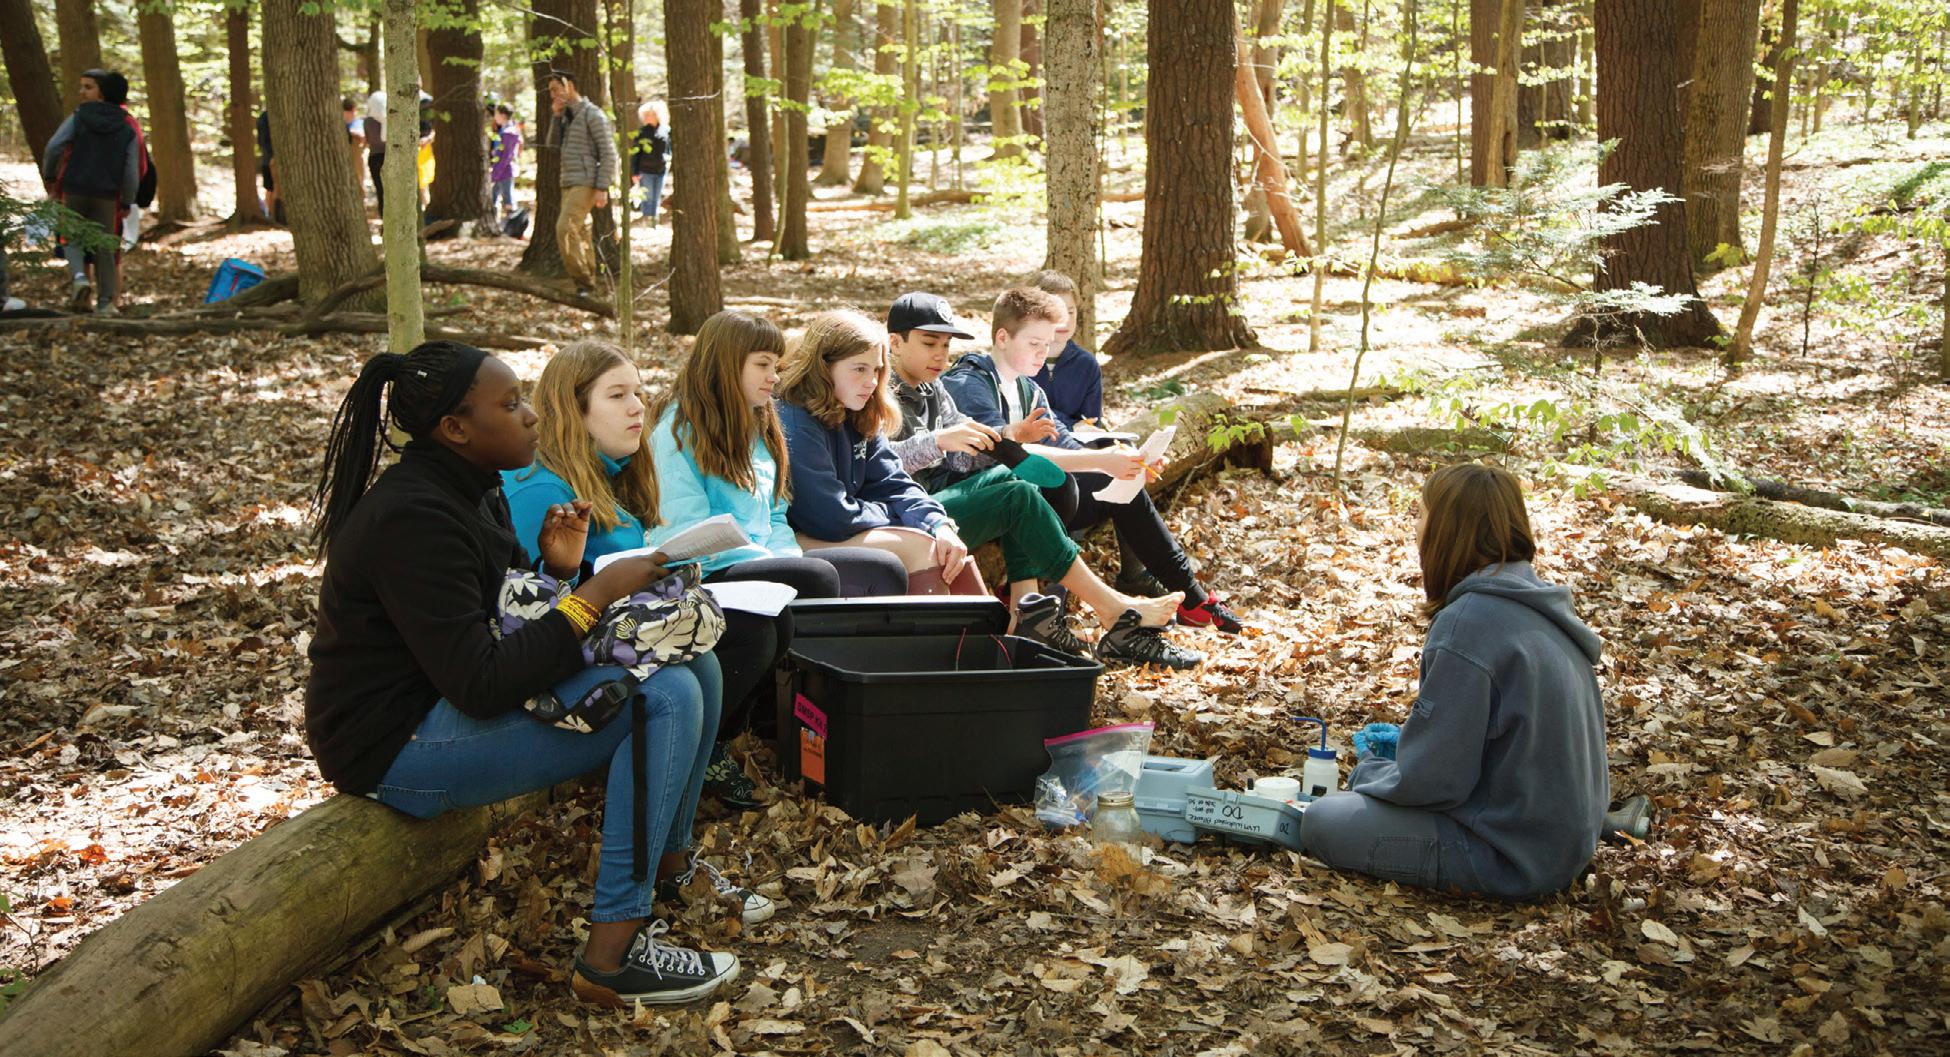
INTRODUCTION
Upon completion of the three field stations you will have a complete set of stream monitoring data. Students can now compile their data, calculate averages, and compare their results to larger datasets. The purpose of this lesson is to begin understanding and making meaning of the data they collected in the field.
LEARNING OBJECTIVES (STUDENTS WILL)
• Understand that aquatic organisms need specific environmental conditions to survive and that stream systems are dynamic and constantly changing.
STUDENT FIELDWORK ACTIVITIES AND EQUIPMENT AND MATERIALS
• Stream Health Scorecard
• Stream Health Scorecard and/OR
• Reference Site Data
• Healthy Stream Data Reference Sheet
MAKING DATA MEANINGFUL
• Stream Health Scorecard and/OR
• Reference Site Data
This lesson is designed to have students spend time reviewing the data they collected at the stream site and evaluate what their data means in relation to the stream’s water quality and overall health. Guiding questions to open the session include:
1) Ask students to share about their experience in the field. Ask a few students to share something that they learned or observed while collecting data.
2) Explain to the students that they will be looking at the data they have collected from their local stream. They will be exploring healthy ranges for each of the parameters they collected, comparing their data and determining the health of the stream they monitored.
Note: Depending on the class, they may have 1 set of data or multiple sets of data to review. The objective of this lesson is to get an average for the class for each parameter monitored and enter it into an online database, to understand their data in the context of stream health, and to develop some ideas for meaningful stewardship projects.
LESSON 4: DATA ANALYSIS AND INTERPRETATION
PART 1 : WHERE WILL OUR DATA BE GOING?
The Watershed Alliance Stream Monitoring and Stewardship program is a community science program.
1) Start by showing students 1 or 2 reports on the Watershed Alliance interactive map. Choose to show your students data from a previous class collected from a stream nearby if possible. Explain that their data are going into this database and can be viewed by other schools and scientists.
2) Show the class the Lake Champlain Basin Poster; ask them to reflect back on the start of the program and find what sub-watershed they are in.
PART 2: DATA ANALYSIS — MAKING DATA MEANINGFUL
Chemical and Benthic Directions
1) Target #: Pass out a Healthy Stream Data Reference Sheet (appendix 108) to each student or student pairs depending on the layout of the classroom. This card will be used as a touchpoint throughout the lesson to help students understand their data and the health of the stream.
2) Our Data: Fill in the table below with the information the students collected from the stream site. Note: There are teaching notes at the bottom of each column.
3) Reference Site Data (Advanced): On pages 67 and 68 you will find a compiled set of data points from the Lake Champlain Long Term Monitoring Program in the form of reference box plots. This includes 5 year’s worth of data from local rivers in the watershed. First, find the nearest stream to your testing site (example, Ausable River). Then, compare your data to this more localized dataset. Note: the full set of box plots is linked on our webpage.
4) Stream Designation: Compare your data to the Reference Site Data (Advanced) or to the Target #. If the class data is within the target number, then it is considered healthy. If it is outside of the target number, then it is considered unhealthy.

LESSON 4: DATA ANALYSIS AND INTERPRETATION
STREAM HEALTH SCORECARD
Metric Explanation Target # (from Healthy Streams Reference Sheet) Our Data Reference Site Data (Tier 2 and 3) Stream Designation Healthy or Unhealthy?
Temperature Temperature of the stream directly affects aquatic organisms that live in streams.
Dissolved Oxygen Oxygen available to animals and plants in the water to breathe.
pH How acidic or alkaline a liquid is.
Phosphorus Essential element for growth (1% of our bodies is P).
Turbidity / Transparency How clear the water is and how many small particles are in the water. This can affect the amount of sunlight entering the water.
Benthic MacroInvertebrates The invertebrates that live in the water - some can live in polluted water (leeches, worms) and some cannot (mayflies, stoneflies, caddisflies).
Conductivity Conductivity is a measure of the ability of water to pass an electrical current.
LESSON 4: DATA ANALYSIS AND INTERPRETATION
TEACHING NOTES
Metric Explanation Target # (from Healthy Streams Reference Sheet)
Start with metrics filled in.
As you go through each metric, construct an explanation with the students so they fully understand the measurement they made and results obtained. See examples above.
Have students use the healthy stream reference sheet to find the target numbers listed.
Our Data Reference Site Data Stream Designation Healthy or Unhealthy?
Have the students share their data - there will usually be 3 numbers (one from each rotation). You can chat about what an “average” is and calculate this together.
Record their average in the box for each row.
Find a stream near you. Use the provided box plots for that given stream and use it as a reference point.
Does your data line up with the target number?
If yes, put a checkmark or smiley face.
If no, put an X or a frowny face.
LESSON 4: DATA ANALYSIS AND INTERPRETATION
PHYSICAL ASSESSMENT DATA DIRECTIONS
Review each of the following parameters in order, talking points and directions are included for each below.
• General Information: Enter the class and monitor information.
• Weather: Ask a couple students to share what they recorded for current and past 48 hours for weather.
• Site Description: Ask students to turn and talk to each other to decide how they would describe the site in 1 - 2 sentences. After 1 minute, ask a couple of groups to share and record their descriptions.
• Land Use: Read off the various land use options, pausing on each one, and ask students to raise their hand if they had it checked off - if any students raise their hand, check that box on the data sheet.
• Pipes/Waste Water Treatment Facility (WWTF): Have students raise their hand if they saw pipes or a WWTF. If they raise their hand, ask them which they saw.
• Canopy Cover: Students may have varying responses, and this will require averaging. Have students share what they recorded 1 at a time, write this on the board, and then challenge the students to “average” these. If this is not appropriate for the grade/age of students, you can help by making the calculations for them and writing results on the board.
• Connections to the other stations:
• Temperature: High percentages of canopy cover shield the stream from sunlight and make the waters cooler.
• Great habitat for trout species.
• Colder water also holds more Dissolved Oxygen.
• Leaf litter can impact phosphorus levels - introducing more organic matter or conversely indicating that there is a good riparian buffer.
• Types of Benthic Macroinvertebrates - If students identified a lot of leaf litter, remind them that BMI that are in the feeding group shredders love leaf litter.
• Embeddedness: Have students share their embeddedness and create a class average (if they have not already done so).
• Velocity: Calculate velocity ➞ combine the velocity trials and divide by 2.
• Turbidity: Use the Transparency Conversion Chart to convert centimeters to Nephelometric Turbidity Units (NTUs).
• Proceed through the rest of the Physical Assessment
LESSON 4: DATA ANALYSIS AND INTERPRETATION
HABITAT PARAMETERS FOR SELECTED MACROINVERTEBRATES*
pH Ranges for Selected Macroinvertebrates (pH ranges 1-6 and 10-14 are unsuitable for most organisms
TAXA 1 2 3
Mayfly
Stonefly
Caddisfly
Snails
Clams
Mussels
Temperature Ranges for Selected Macroinvertebrates
Mayfly
Stonefly
Caddisfly
Water Penny
Water Beetle
Water Strider
Dragonfly
Minimum Dissolved Oxygen Levels for Selected Macroinvertebrates
TAXA
Stonefly
Water Penny
Caddisfly
Some Mayfly
Dragonfly
True Bugs
Damselfly
Mosquito
Midge
Pouch Snail
Rat-tailed Maggot
* The values provided are preferred ranges for most species of these groups of organisms.
LESSON 4: DATA ANALYSIS AND INTERPRETATION
REFERENCE SITE DATA
The Healthy Stream Data Reference Sheet is a great starting point to see how your stream data lines up with healthy stream ranges for the Northeast. However, streams throughout the Lake Champlain watershed can have different “normal” ranges. These differences may be the result of land use, stream order, geology, or other environmental and anthropogenic impacts. To better understand your data we’ve created some localized reference stream data to help provide more context for your dataset.
The box plots range from the last 5 years from the May through October sampling dates, data is from the Lake Champlain Long Term Monitoring Program.
Examples below include a subset of Vermont and New York sites. Download stream site data from the Stream Monitoring and Stewardship webpage.
Phosphorous


Conductivity Temperature

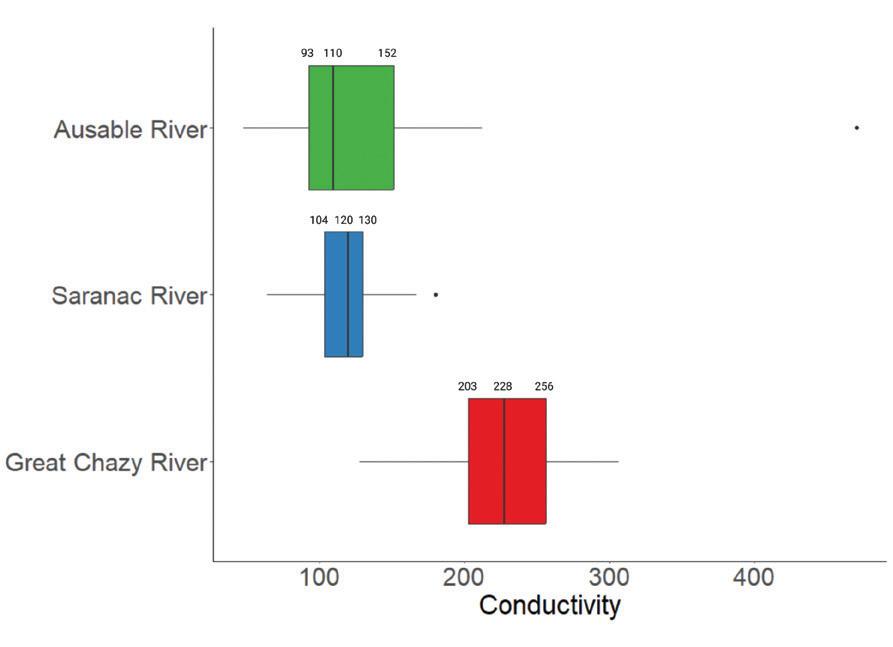


LESSON 5: STEWARDSHIP
UVM Watershed Alliance requires that all groups participating in the Stream Monitoring and Stewardship Program complete a stewardship project. We encourage groups to take action based on their scientific findings and select a project that fits their time, effort, and water quality needs. Stewardship activities and community outreach is an essential part of watershed education because it gives students the opportunity to apply information learned through the monitoring process and improve the water quality within their community.
LEARNING OBJECTIVES (STUDENTS WILL BE ABLE TO)
• Use data and their local knowledge to design and/or implement an appropriate stewardship project to improve the water quality of their stream reach.
GUIDING QUESTIONS FOR PLANNING A STEWARDSHIP PROJECT
• What are your goals and objectives?
• How much time do you have to commit to carrying out the project?
• What special equipment, tools, or other resources will you need?
• What are the potential safety concerns?
• Who can help you plan and implement your service/stewardship project?
Teaching tip: If possible this lesson can be a project based activity in which students decide on which stewardship activity they would like to focus on OR if there are constraints that do not allow for this the educator can select 1-2 project(s) from the matrix below and pose those as options to the student group.
FACILITATING A STUDENT PLANNING SESSION
The following discussion should take place before the implementation of the stewardship project. If students are helping decide what project they would like to do, the following questions can serve as a discussion guide to focus their decision making process. If you have already predetermined which project you will be doing, you should still have this discussion to allow students the opportunity to draw connections between your proposed project and their knowledge of the needs of their local stream reach. Please modify the questions below as needed.
LESSON 5: STEWARDSHIP
STUDENT DISCUSSION GUIDE (40 MINUTES)
• What sections of our stream reach and riparian area need the most support? (5 minutes)
• Which water quality parameters fall into a range that suggests impairment?
• What reasons might exist for those impairments?
• If a stream does not seem to be impaired, what reasons might that be?
• What does the land look like around the stream and how might our community help to protect stream health?
• What recommendations do you have based on what you learned from the best management practices with the Watershed Model demonstration (group 5 minutes, 10 minutes total)
• If needed, remind students of the Best Management Practices from the very first lesson - the Watershed Model demo. (PAGE X)
• What do we do about it? (what do I do, what does my school do, what does my town do? (1 recommendation each) (10 minutes)
• What are our class recommendations? (5 minutes)
• Group conclusion, next steps. (5 minutes)
LESSON 5: STEWARDSHIP
STEWARDSHIP PROJECT IDEAS
Project Tier Activity
Clean Up Storm Drains
Stencil Storm Drains
Preparation and Planning
•Work with local Public Works Department to identify storm drains.
• Find out if your town or local watershed group provides supplies (see online curriculum resources).
• Purchase or borrow supplies.
• Work with school administration and grounds crew for permission and site selection.
(working in teams of 3-4)
(working in teams of 3-4)
Aerate the Lawn
Sweep the Pavement
EASY
Vegetate Bare Areas
Plant a Stream Buffer
Plant Trees
Conduct a Site Cleanup
• Borrow or purchase a classroom set of Yard Butler Lawn Coring Aerators (e.g., one per group of 4-5 students). Any (working in teams of 3-5)
• Work with school administration and grounds crew for permission, site selection, and to make a waste disposal plan.
• Borrow or purchase a classroom set of outdoor brooms. Any (working in teams of 3-4)
• Work with school administration and grounds crew for permission and site selection.
• Determine what will be planted.
• If digging, call Dig Safe at 811.
• Obtain trees and other planting supplies (e.g., shovels, gloves).
• Identify a location for your clean up.
• Contact property owner(s) to obtain permission.
• Arrange for trash pick-up/hauling.
• Gather safety and cleaning supplies (e.g., first aid kit, water, gloves, trash bags). Any
Direct a Downspout to a Vegetated Area
• Work with school administration and grounds crew for permission and site selection.
• Obtain needed supplies to redirect the downspout.
Small groups only
LESSON 5: STEWARDSHIP
Project Tier Activity
Maintain a Rain Barrel
MODERATE
Maintain a Rain Garden
Preparation and Planning
• Identify areas where rain barrel water could be used.
• Obtain supplies to move water (e.g., hose, watering can).
• Make a schedule for regular checks of the rain barrel.
• Don’t forget to disconnect the rain barrel in winter.
• Identify which rain garden(s) you will maintain and required maintenance.
• Obtain landowner permission to engage in maintenance.
• Obtain supplies needed for maintenance (e.g., gloves, plants).
Install a Rain Barrel
Install a Dog Waste Station
DIFFICULT
Install a Rain Garden
• Work with school administration and grounds crew for permission and site selection.
• Obtain needed supplies.
• Identify a location(s) for recommended practices.
• Prepare an educational campaign message and materials.
• Present this message to selected target audience (e.g., school administration and grounds crew, town officials).
• Obtain sign, post, bags, and trash bin.
• Identify partners and funding for design and implementation of rain gardens.
• Speak with maintenance staff about plans and assistance during summer months and any required changes to landscaping, snow removal, and salting practices.
Recommended Group Size
Small groups (though regular maintenance required, so can stagger participation)
Dependent upon rain garden size
Small groups only
Small groups only
Any (though must be wellfacilitated); may require outside assistance (e.g., backhoe)
For supporting Stewardship lessons and materials, please visit the Soaking Up Stormwater Curriculum Webpage. https://www.uvm.edu/seagrant/programs/green-schools/soaking-stormwater-curricula
LESSON 5: STEWARDSHIP

GLOSSARY
Aquatic invasive species (AIS) - are organisms that are new to an ecosystem that is outside of the organism’s natural range (pre-European settlement) and causes harm to the environment, economy, or human health.
Basin (see watershed definition) - another word for a watershed.
Benthic Macroinvertebrate (BMIs) - invertebrates that live on the bottom of streams and rivers and are visible to the naked eye.
Best Management Practices (BMPs) - BMPs are systems, activities and structures that can minimize nonpoint source pollution.
Bioaccumulate - the gradual accumulation of substances, such as pesticides or other chemicals, in an organism and across trophic levels in food webs.
Canopy Cover - the proportion of the forest floor covered by a vertical projection of the tree crowns.
Condensation - when something changes from a gas to a liquid; for example, in the water cycle, water vapor condenses to form clouds.
Conductivity - a measure of the ability of water to pass an electrical current.
Consumers - an organism that eats other organisms.
Cyanobacteria - also called blue-green algae, are photosynthetic microscopic organisms found naturally in all types of water. In warm, nutrient-rich (high in phosphorus and nitrogen) environments, cyanobacteria can multiply quickly, creating blooms that can produce harmful toxins.
Discharge - the discharge of a river is the volume of water transported by it in a certain amount of time.
Dissolved Oxygen (DO) - the amount of oxygen dissolved in water. Generally, proportionately higher amounts of oxygen can be dissolved in colder waters than in warmer waters.
Embeddedness – the extent to which rocks (gravel, cobble, and boulders) are surrounded by, covered, or sunken into the silt, sand, or mud of the stream bottom.
Ephemeral - lasting for a very short time.
Erosion - the wearing away of the land surface by wind or water.
Eutrophication - excessive richness of nutrients in a lake or other body of water, frequently due to runoff from the land, which causes a dense growth of plant life and death of animal life from lack of oxygen.
GLOSSARY
Evaporation - when something changes from a liquid to a gas; for example, in the water cycle, liquid water evaporates into water vapor.
Floodplain - an area on both sides of a stream where flood waters spread out during high rains. The surface may appear dry for most of the year, but it is generally occupied by plants that are adapted to wet soils.
Fertilizer - natural or artificial substance containing the chemical elements that improve growth and productiveness of plants.
Herbicides - a substance that is toxic to plants, used to destroy unwanted vegetation.
Hypoxia - low oxygen, primarily a problem for estuaries, coastal waters, and eutrophic lakes.
Impervious Surfaces - any hard surface that prevents the absorption of water into the soil.
Nitrogen - the most abundant element in our atmosphere and is crucial to life. It is a nutrient often added to fertilizers, because it is essential to plant growth, but too much nitrogen in our waterways can contribute to algae blooms.
Nonpoint Source Pollution - a source of pollution that is impossible to measure where it specifically came from as it has come from diffuse sources from across the landscape. Nonpoint source pollution flows into surface water bodies in stormwater runoff. Today, most pollution falls into the category of nonpoint source.
Nutrient - any substance which is necessary for the growth of living things.
Nutrient Pollution - the process where too many nutrients, mainly nitrogen and phosphorus, are added to bodies of water and can act like fertilizer, causing excessive growth of algae.
PCBs (polychlorinated biphenyl) - a group of man-made organic chemicals consisting of carbon, hydrogen and chlorine atoms that may cause cancer.
Percolation - the movement of water through soil.
Pesticides - any substance used to kill, repel, or control certain forms of plant or animal life that are considered to be pests.
pH - a figure expressing the acidity or alkalinity of a solution on a logarithmic scale on which 7 is neutral, lower values are more acid and higher values more alkaline.
Phosphorus - a critical nutrient required for all life. High concentrations of phosphorus may result from poor agricultural practices, runoff from urban areas and lawns, leaking septic systems or discharges from sewage treatment plants.
GLOSSARY
Point Source Pollution - a pollution source that can be traced back to a specific starting point such as a pipe or drain. Knowing the starting point allows for an easier time identifying and controlling the pollution before it enters waterways.
Pollutants - harmful materials that are introduced to the environment. They can be natural, such as volcanic ash, or created by humans, such as trash.
Pollution - the introduction of harmful materials or chemicals into the environment.
Precipitation - water falling from clouds, common forms include rain, snow, sleet and hail.
Riparian Area - an area adjacent to and along a stream or waterbody.
Riparian Vegetation - the soil immediately adjacent to the water that is covered by growing vegetation, stable debris, or bedrock material. This helps determine the health of a stream because it can tell us a lot about the relative stability of that stream.
Runoff - excess water draining away from land or buildings. The overflow of water that drains off of your driveway is an example of runoff.
Salinity - a measure of the amount of salts in the water. Since dissolved ions increase salinity as well as conductivity, the two measures are related.
Secchi Disk - a disk with alternating black and white quadrants. It is lowered into the water until it can no longer be seen by the observer. This depth of disappearance, called the Secchi depth, is a measure of the turbidity of the water.
Stormwater runoff - the water that is generated from rain and snowmelt that flows over land or impervious surfaces, such as paved streets, parking lots, and building rooftops, and does not soak into the ground.
Streambank - the sloped areas alongside streams, creeks and rivers that connect the stream to its floodplain.
Streambed - the bottom of a stream where the substrate and sediments lay.
Streambed Composition - the assortment of sand, rocks, mud, cobble, etc that make up the floor of a stream bed.
Streambed Cover - A wide variety and/or abundance of submerged structures in the stream supports good aquatic habitat. Additionally, it is a great hiding place for fish.
GLOSSARY
Stream Channel - any long, narrow, sloping depression on land that is shaped by flowing water. It is also called a stream bed.
Stream Flow - flow of water in a stream channel, specifically considers velocity and volume.
Stream Monitoring - a systematic way to assess a waterway’s ecological integrity and understand how humans may have impacted it in the past and how our actions on the land continue to influence water quality today.
Stream Reach (run, riffle, and pool):
Pool - An area often following a rapids (riffle), which is relatively deep with slowly moving water compared to the rapids.
Run - runs are deep with fast water and little or no turbulence.
Riffle - A shallow area with a gravelly or rocky bottom and turbulent (choppy) water.
Sub-watershed - larger watersheds are made up of numerous smaller watersheds, which are then called subwatersheds or sub-basins.
Temperature - is measured as the degree of thermal energy in the water. It is an important factor to consider when assessing water quality. In addition to its own effects, temperature influences several other parameters and can alter the physical and chemical properties of water.
Topography - the study of the forms and features of land surfaces.
Total Maximum Daily Load (TMDL) - a calculation of the maximum amount of a pollutant allowed to enter a waterbody so that the waterbody will meet and continue to meet water quality standards for that particular pollutant.
Transparency - a measure of water clarity. The clearer the water is, the more transparent it is.
Turbidity - the amount of suspended particles in the water. It measures the relative clarity of a body of water by observing how light is scattered amongst suspended particles (i.e sediment, algae, organic/inorganic matter) in the water. Low turbidity indicates clearer water, whereas high turbidity indicates that the water is cloudy.
Velocity - the rate at which water flows in a stream channel.
Water Cycle - the constant movement of water in various forms throughout the earth and atmosphere.
Watershed - An area of land where all of the water drains into a specific water body, such as a stream, river, or lake.
REFERENCES
City of Vancouver. (n.d.). Water quality: Temperature, ph and dissolved oxygen. https://cityofvancouver.us/sites/default/files/fileattachments/public_works/page/18517/water_quality_ tempph_do.pdf
Cooper, Matthew & Uzarski, Donald & Burton, T.M.. (2009). Benthic Invertebrate Fauna, Wetland Ecosystems.
Environmental Protection Agency. (n.d.). Indicators: Dissolved Oxygen. https://www.epa.gov/national-aquatic-resource-surveys/indicators-dissolved-oxygen
Hoosier Riverwatch & Indiana Department of Environmental Management. (2015). Volunteer Stream Monitoring Training Manual. https://www3.nd.edu/~aseriann/Riverwatch_Monitoring_Manual.pdf
M.T. Denecour. (n.d.). Interactive Lake Ecology [Graphic] Water quality: Temperature, ph and dissolved oxygen. https://cityofvancouver.us/sites/default/files/fileattachments/public_works/page/18517/water_quality_ tempph_do.pdf
U.S. Geological Survey. (n.d.) Ph scale. https://www.usgs.gov/media/images/ph-scale-0#:~:text=pH%20is%20 a%20measure%20of,hydroxyl%20ions%20in%20the%20water
U.S. Geological Survey. (n.d.). What is a reach? https://www.usgs.gov/faqs/what-reach
University of Wisconsin Madison & Wisconsin Department of Natural Resources. (2010). Transparency - water action volunteers. https://wateractionvolunteers.org/files/2019/10/5Transparency-Monitoring2010.pdf
Vermont Department of Environmental Conservation. (2021). Aquatic Plants & Animals in Vermont. Gallery of Invaders. https://dec.vermont.gov/watershed/lakes-ponds/aquatic-invasives
Vermont invasives. (n.d.). Native Aquatic Plants of Vermont. https://vtinvasives.org/node/314

ANSWER KEY
WATERSHED ALLIANCE
STREAM
MONITORING PRE- AND POST-ASSESSMENT
NAME:
SCHOOL:
FOR THE FOLLOWING QUESTIONS PLEASE CIRCLE THE BEST ANSWER:
1. What is a watershed?
a. A piece of equipment used for stream monitoring
b. Another name for precipitation or rainfall
c. An area of land where all of the water drains into a specific water body, such as a stream, river, or lake
d. A very small body of water
CIRCLE THE RESPONSE BELOW THAT BEST FITS HOW YOU FEEL:
No correct or incorrect responses for these questions
2. I feel confident sharing what I know about watershed health with my friends and family. ❍ Strongly Agree ❍ Agree ❍ Not sure ❍ Disagree ❍ Strongly Disagree
3. I want to change my behavior and things I do at home in order to take care of my watershed. ❍ Strongly Agree ❍ Agree ❍ Not sure ❍ Disagree ❍ Strongly Disagree
INDICATE YOUR LEVEL OF AGREEMENT OR DISAGREEMENT WITH THE FOLLOWING STATEMENTS.
No correct or incorrect responses for these questions
4. The stream or river is a place: Strongly Agree Somewhat Agree Neither Agree not Disagree Somewhat Disagree Strongly Disagree to connect with nature.
to watch animals and birds.
where people can find nature.
where water is an important part of the community.
where people have access to rivers.
where people come to fish.
where people have access to nature.
to canoe and boat.
to have fun in nature.
to learn about nature.
to enjoy nature’s beauty.
to grow food.
ANSWER KEY
WATERSHED ALLIANCE
STREAM MONITORING
PRE- AND POST-ASSESSMENT
FOR THE FOLLOWING QUESTIONS, PLEASE FILL IN THE BLANKS:
NOTE: the suggested response list below is not exhaustive. There may be other correct responses not listed.
5. List 2-3 water quality challenges that Lake Champlain is currently facing?
(optional)
POSSIBLE RESPONSES: climate change, stormwater runoff, aquatic invasive species, flooding, pollution, microplastics, contamination, salt, crude oil spills
6. What action(s) can you take to improve water quality in the Lake Champlain watershed?
POSSIBLE RESPONSES: pick up dog poop, wash car on the lawn, keep storm drains clear of debris, tell others what I have learned, wash clothing with plastic fibers less, help plant trees to restore streambanks, make a salt brine, keep grass longer than 3+ inches, pick up marine debris (trash), install a rain barrel or rain garden
7. Please describe how you will complete the action(s) you listed above (e.g., at your home, with your family, or in your classroom, etc.):
POSSIBLE RESPONSES: My class is going to install a rain barrel at our school
WATERSHED ALLIANCE COVER SHEET
STUDENT NAME:
DATE: / / TIME : AM/PM
TOWN:
STREAM OR RIVER NAME:
MAP OF WATERSHED
Find where you live on the map and put a ★. Then, trace how a water droplet might travel to Lake Champlain from that location.

PHYSICAL PARAMETERS ASSESSMENT
PHYSICAL STATION
SURROUNDING LAND USES
Check All That Apply ❑ Farm
Factory
Park
Forest
❑ Road Along Bank ❑ Road Nearby
❑ Water Treatment Plant Upstream
Golf Course
Crops
Commercial Property
Other:
Residential
Logging
Pipes Entering Stream
CANOPY COVER
Circle the image below that show how much of the stream is covered by overhanging trees, shrubs or grasses.


TRANSPARENCY/TURBIDITY
Circle the image below that best represents the color (turbidity) of the stream.
WATER SAMPLES:


PHYSICAL PARAMETERS ASSESSMENT
PHYSICAL
CURRENT VELOCITY
Circle the speed (velocity) of the water
EMBEDDEDNESS
Pick up a random rock and look for the “bathtub ring.” This ring shows how deep the rock was buried (embedded) in the bottom of the stream. Circle below how much of your rock was buried in the stream.

STREAM HABITAT ASSESSMENT
PHYSICAL STATION
STREAMBED COMPOSITION (BOTTOM TYPE)
Check one of the following and write its points in the shaded column.
STREAMBANK STABILITY (EROSION)
Check
SPEED (VELOCITY)
Check one of the following and write its points in the shaded column.
STREAM HABITAT ASSESSMENT
PHYSICAL STATION
DEPTH OF DEEPEST POOL
Check one of the following and write its points value in the shaded column
Chest Deep
❑ Waist Deep
❑ Knee Deep
❑ Ankle Deep 0
RIPARIAN VEGETATION (TYPES OF PLANTS PRESENT)
Check one of the following and write its points in the shaded column.
❑ Grasses, Shrubs, and Trees
RIPARIAN VEGETATION ZONE WIDTH (WIDTH OF STREAMBANK TO HELP CONTROL RUNOFF AND EROSION)
Check one of the following and write its points in the shaded column. Point Values
❑ More Than 20 Paces
❑ Between 10 and 20 Paces
❑ Between 2 and 10 Paces
❑ Less Than 2 Paces
STREAM HABITAT ASSESSMENT RATING: Check the rating that applies to your total score.
❑ 68-72 (Excellent Habitat Quality)
❑ 48-67 (Good Habitat Quality)
❑ 24-47 (Fair Habitat Quality)
❑ Less Than 23 ( Poor Habitat Quality)
CHEMICAL ASSESSMENT
CHEMICAL STATION TIER 1
TEMPERATURE
Water Temp at Site °C
Notes: Varies with life stages and species. For example - The optimal temperature for Atlantic Salmon spawning is 5°C, whereas embryo survival is 7°C, and the maximum temperature for growth is 23°C.
DISSOLVED OXYGEN
Dissolved Oxygen mg/L
Notes: 4-7 mg/L of DO is low for cold fisheries, but good for pond animals. Whereas, 7-11 mg/L of DO is very good for most stream fish.
Notes: 6.5 - 8.5 is the average pH range for most aquatic life.
CHEMICAL ASSESSMENT CHEMICAL
STATION
NUTRIENTS
Orthophosphate (PO 4 3-) mg/L
Notes: If using Hach Kits, multiply the colorimeter reading by 0.326.
• < 0.05 mg/L (no impact)
• 0.05 – 0.10 mg/L (possible impacts)
• > 0.10 mg/L (impacted)

BIOLOGICAL ASSESSMENT BIOLOGICAL STATION
Worm-like Animals Generally tolerant of pollution
Shells (Both spiral and hinged shells) Sensitive to tolerant of pollution


POOL-RIFFLE RUN
Crayfish-like Animals Generally sensitive to pollution


Insectlike Animals Generally sensitive to pollution
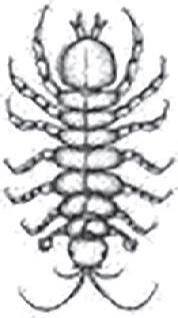


INTERPRETING YOUR RESULTS
If you find: It suggests:
Many kinds of animals, from sensitive to tolerant Good water quality.
Severe organic pollution. No animals Toxic pollution.
Only a few kinds of worm-like (tolerant) animals, but many individuals of these kinds
WATERSHED ALLIANCE COVER SHEET
STUDENT NAME:
DATE: / / TIME : AM/PM
TOWN:
STREAM OR RIVER NAME:
MAP OF WATERSHED
Find where you live on the map and put a ★. Then, trace how a water droplet might travel to Lake Champlain from that location.
PHYSICAL PARAMETERS ASSESSMENT
SURROUNDING LAND USES
Check All That Apply
❑ Farm
Park
Golf Course
Residential ❑ Factory
Forest
❑ Road Along Bank ❑ Road Nearby
❑ Water Treatment Plant Upstream
Crops
Commercial Property
Other:
Logging
Pipes Entering Stream
CANOPY COVER
Circle the percentage below that best represents the percentage of stream width covered by overhanging grasses, shrubs, and trees (stand in middle of stream if possible):
TRANSPARENCY/TURBIDITY
Fill in the blanks below using the turbidity tube and NTU conversion chart.
Height of water column in turbidity tube: CM = NTU’s
Note: The lower the NTU, the lower the turbidity (more clear water)

CURRENT VELOCITY
Follow the instructions in the Stream Monitoring Handbook to conduct 2 trials of the velocity assessment. Fill in the blanks below, then average the results.
Trial 1 Velocity: 10 meters (m) ÷ seconds (s) = Meters/seconds (m/s)
Trial 2 Velocity: 10 meters (m) ÷ seconds (s) = Meters/seconds (m/s)
Average velocity = (Trial 1 Velocity m/s + Trial 2 Velocity m/s) ÷ 2 = (m/s)
PHYSICAL PARAMETERS ASSESSMENT
PHYSICAL STATION
EMBEDDEDNESS
Pick up 10 random rocks and look for the “bathtub ring” on each. This ring shows how deep the rock was embedded (buried) in sediment at the bottom of the stream. Estimate the percent that each rock was buried (embedded). Reference the gray shaded area in the picture below for rough percentages.
Add the 10 rock percentages % ÷ 10 = % Average Embeddedness

STREAM HABITAT ASSESSMENT
PHYSICAL STATION
STREAMBED COMPOSITION: Large sediment types (cobbles and gravels) support a wider variety of organisms than smaller sediment types (sands and silts).
Check one of the following and write its points in the shaded column.
❑ Mixture of cobbles, gravels, and sand
❑ Mixture of gravel and sand
❑ Mostly sand and silt
STREAMBANK STABILITY: Stream banks that are actively eroding generally have degraded (broken down) habitats when compared to stable streams.
Check one of the following and write its points in the shaded column. Point Values Points Given ❑ Banks appear stable (no signs of erosion)
❑ Moderately stable banks (some areas of erosion variable)
❑ Unstable banks (lots of erosion present)
DEPTH AND VELOCITY: High dissolved oxygen (DO) levels support a healthy, diverse aquatic community. Shallow streams have warmer water, which results in lower DO levels. Fast streams mix air into the water, which results in higher DO levels.
Check one of the following for each category (deepest pool and velocity) and write its points in the shaded column.
STREAM HABITAT ASSESSMENT
PHYSICAL STATION
STREAMBED COVER: A wide variety and/or abundance of submerged structures in the stream supports good aquatic habitat. Additionally, it is a great hiding place for fish.
Check as many as you see and write a point for each checked item in the shaded column.
Example: If you check all items, give 5 total points.
❑ Solid rock also known as bedrock
❑ Submerged logs, stumps, or tree roots
❑ Large rocks (boulder size)
❑ Human made objects/structures (Ex. bridge)
❑ Other (ex. rip-rap)
RIPARIAN VEGETATION: The root systems of plants growing along streambanks help hold soil in place and reduce the amount of erosion that is likely to occur.
Check one of the following and write its points in the shaded column.
❑ Mixture of trees, shrubs, and grasses
❑ Mixture of shrubs and grasses
❑ Mostly grasses
❑ No vegetation
RIPARIAN VEGETATION ZONE WIDTH SECTION: A vegetative zone serves as a buffer to pollutants entering the stream from runoff and helps control erosion. It is measured from the stream edge and beyond (on either side of the stream bank).
Check one of the following and write its points in the shaded column. Point Values Points Given
❑ Buffer zone is greater than 30.5 meters (100ft)
❑ Buffer zone is between 15 meters (50ft) and 30.5 meters (100ft)
❑ Buffer zone is between 7.6 meters (25ft) and 15 meters (50ft)
❑ No buffer zone
FOR PAGE 2
TOTAL SCORE: SUBTOTAL FOR PAGE 1 + SUBTOTAL FOR PAGE 2 =
STREAM HABITAT ASSESSMENT RATING: Check the rating that applies to your total score. ❑ Excellent (22 to 18 total points)
Fair (10 to 6 total points)
Good (17 to 11 total points)
CHEMICAL ASSESSMENT CHEMICAL
STATION
TEMPERATURE
Water Temp at Site °C
Notes: Varies with life stages and species. For example - The optimal temperature for Atlantic Salmon spawning is 5°C, whereas embryo survival is 7°C, and the maximum temperature for growth is 23°C.
DISSOLVED OXYGEN
Dissolved Oxygen mg/L
Notes: 4-7 mg/L of DO is low for cold fisheries, but good for pond animals. Whereas, 7-11 mg/L of DO is very good for most stream fish.
Notes: 6.5 - 8.5 is the average pH range for most aquatic life.
CHEMICAL ASSESSMENT CHEMICAL
STATION
NUTRIENTS
Orthophosphate (PO 4 3-) mg/L
Notes: If using Hach Kits, multiply the colorimeter reading by 0.326.
• < 0.05 mg/L (no impact)
• 0.05 – 0.10 mg/L (possible impacts)
• > 0.10 mg/L (impacted)
CONDUCTIVITY
Conductivity uS/cm
Notes: This reading can only be taken if using Vernier probes. 150 – 500 uS/cm (microSiemens)
BIOLOGICAL ASSESSMENT BIOLOGICAL STATION


Group 4Very Tolerant Aquatic worm Blood midge larva (red) Rat-tailed Maggot Left-Handed or Pouch snail
# of TAXA represented Weighting Factor (x1)
POOL-RIFFLE RUN
POLLUTION TOLERANCE INDEX (PTI)
Record the taxa (group) represented in your sampling by either entering the number of organisms you counted or a
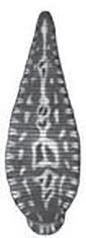


Group 3Fairly Tolerant Leech Midge larva Planaria/Flatworm Black fly larva


Group 2Moderately Tolerant Damselfly nymph Dragonfly nymph Scud Sowbug Cranefly larva Clam/Mussel Crayfish


Group 1Intolerant Stonefly nymph Mayfly nymph Caddisfly nymph Riffle Beetle Dobsonfly Larva
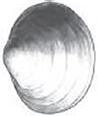

# of TAXA represented Weighting Factor (x2)
# of TAXA represented Weighting Factor (x3)

Right-Handed or Gilled snail Water Penny

# of TAXA represented Weighting Factor (x4)
Pollution Tolerance Index Rating (And the final index value for each group) PTI Ratings: EXCELLENT ( 23 or More) | GOOD (17-22) | FAIR (11-16) | POOR (10 or Less)
Please check other Biological Indicators you observed:
Native Mussels ❑ Zebra Mussels ❑ Rusty Crayfish ❑ Aquatic Plants % Algae Cover % Diversity Index
WATERSHED ALLIANCE COVER
SHEET
STUDENT NAME:
TOWN:
MAP OF WATERSHED
Find where you live on the map and put a ★. Then, trace how a water droplet might travel to Lake Champlain from that location.
PHYSICAL PARAMETERS ASSESSMENT
SURROUNDING LAND USES
Check All That Apply
❑ Farm
Park
Golf Course
Residential ❑ Factory
Forest
❑ Road Along Bank ❑ Road Nearby
❑ Water Treatment Plant Upstream
Crops
Commercial Property
Other:
Logging
Pipes Entering Stream
CANOPY COVER
Circle the percentage below that best represents the percentage of stream width covered by overhanging grasses, shrubs, and trees (stand in middle of stream if possible):
TRANSPARENCY/TURBIDITY
Fill in the blanks below using the turbidity tube and NTU conversion chart.
Height of water column in turbidity tube: CM = NTU’s
Note: The lower the NTU, the lower the turbidity (more clear water)
CURRENT VELOCITY
Follow the instructions in the Stream Monitoring Handbook to conduct 2 trials of the velocity assessment. Fill in the blanks below, then average the results.
Trial 1 Velocity: 10 meters (m) ÷ seconds (s) = Meters/seconds (m/s)
Trial 2 Velocity: 10 meters (m) ÷ seconds (s) = Meters/seconds (m/s)
Average velocity = (Trial 1 Velocity m/s + Trial 2 Velocity m/s) ÷ 2 = (m/s)
PHYSICAL PARAMETERS ASSESSMENT
PHYSICAL STATION
EMBEDDEDNESS
Pick up 10 random rocks and look for the “bathtub ring” on each. This ring shows how deep the rock was embedded (buried) in sediment at the bottom of the stream. Estimate the percent that each rock was buried (embedded). Reference the gray shaded area in the picture below for rough percentages.
Add the 10 rock percentages % ÷ 10 = % Average Embeddedness
STREAM HABITAT ASSESSMENT
PHYSICAL STATION
I. SUBSTRATE (bottom type)
a) Size
Score:
b) “Smothering” Are Fist Size and Larger Pieces Smothered By Sands/Silts?
c) “Silting” Are Silts and Clays Distributed Throughout the Stream? ❑ 14PT
Mostly Large (Fist Size or Bigger)
6PT
Mostly Small (Smaller than Fingernail, but Coarse, or Bedrock)
Symptoms: Light kicking results in substantial clouding for more than a minute. ❑ 10PT
Mostly Medium (Smaller than Fist, Larger than Fingernail)
Mostly Very Fine (Not Coarse, Sometimes Greasy or Mucky)
II. FISH COVER (hiding places) - Add 2 Points For Each One Present
Underwater Tree Roots (Large)
Underwater Tree Roots (Small)
Shrubs/Small Trees Hang Over the Bank
Backwaters, Oxbows or Side Channels
Downed Trees, Logs, or Branches
Symptoms: Hard to move pieces, often black on bottom.
Water Plants
Shallow, Slow Areas for Small Fish
III. STREAM CHANNEL SHAPE AND HUMAN ALTERATIONS
a) “Curviness” or “Sinuosity” of Channel b) How Natural is the Site?
8PT 2 or More Good Bends
6PT 1 or 2 Good Bends
Mostly Straight Some “Wiggle”
Mostly Natural
Few Minor Man-Made Changes (e.g. a bridge)
Deep Areas (Chest Deep)
Score:
Undercut Banks
Boulders
Score:
Many Man-Made Changes, but Some Natural Conditions Left (e.g. trees, meaders)
Heavy Man-Made Changes (e.g. leveed or channelized)
SUBTOTAL FOR PAGE 1:
STREAM HABITAT ASSESSMENT
PHYSICAL STATION
IV. STREAM FORESTS & WETLANDS (RIPARIAN AREA) & EROSION Score:
a) Riparian Width Mostly:
Bank Erosion
&
CHEMICAL ASSESSMENT CHEMICAL
STATION
TEMPERATURE
Water Temp at Site °C
Notes: Varies with life stages and species. For example - The optimal temperature for Atlantic Salmon spawning is 5°C, whereas embryo survival is 7°C, and the maximum temperature for growth is 23°C.
DISSOLVED OXYGEN
Dissolved Oxygen mg/L
Notes: 4-7 mg/L of DO is low for cold fisheries, but good for pond animals. Whereas, 7-11 mg/L of DO is very good for most stream fish.
Notes: 6.5 - 8.5 is the average pH range for most aquatic life.
CHEMICAL ASSESSMENT CHEMICAL
STATION
NUTRIENTS
Orthophosphate (PO 4 3-) mg/L
Notes: If using Hach Kits, multiply the colorimeter reading by 0.326.
• < 0.05 mg/L (no impact)
• 0.05 – 0.10 mg/L (possible impacts) > 0.10 mg/L (impacted)
CONDUCTIVITY
Conductivity uS/cm
Notes: This reading can only be taken if using Vernier probes. 150 – 500 uS/cm (microSiemens)
BIOLOGICAL ASSESSMENT BIOLOGICAL STATION
Group 4Very Tolerant Aquatic worm Blood midge larva (red) Rat-tailed Maggot Left-Handed or Pouch snail
# of TAXA represented Weighting Factor (x1)
POOL-RIFFLE RUN
POLLUTION TOLERANCE INDEX (PTI)
Record the taxa (group) represented in your sampling by either entering the number of organisms you counted or a
Group 3Fairly Tolerant Leech Midge larva Planaria/Flatworm Black fly larva
Group 2Moderately Tolerant Damselfly nymph Dragonfly nymph Scud Sowbug Cranefly larva Clam/Mussel Crayfish
Group 1Intolerant Stonefly nymph Mayfly nymph Caddisfly nymph Riffle Beetle Dobsonfly Larva
# of TAXA represented Weighting Factor (x2)
# of TAXA represented Weighting Factor (x3)
Right-Handed or Gilled snail Water Penny
# of TAXA represented Weighting Factor (x4)
Pollution Tolerance Index Rating (And the final index value for each group) PTI Ratings: EXCELLENT ( 23 or More) | GOOD (17-22) | FAIR (11-16) | POOR (10 or Less)
Please check other Biological Indicators you observed:
Zebra Mussels
Rusty Crayfish ❑ Aquatic Plants % Algae Cover % Diversity Index
Native Mussels
GROUP III: TOLERANT
GROUP II: MODERATELY SENSITIVE
GROUP I: SENSITIVE

Aquatic worms Total Count Abundance Code: R
Blackfly larvae Total Count Abundance Code:


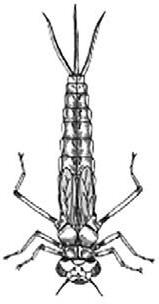


Caddisfly larvae (except net spinners)
Midge larvae Total Count Abundance Code:

Leeches Total Count Abundance Code: R C D
Total Count Abundance Code: R C D


Cranefly larvae Total Count Abundance Code:

Lunged snails
Net-spinning caddisfly larvae Total Count Abundance Code: R

INSTRUCTIONS For each kind of organism you collect: 1. Check the box next to its name. 2. Count (or estimate) the number of individuals of this kind and enter this number in the “Total Count” space 3. Circle Abundance Code R, C, or D for this kind. ABUNDANCE CODES (R) = 1 to 9 organisms: Rare (C) = 10 to 99 organisms: Common (D) = Over 100 organisms: Dominant


BIOLOGICAL ASSESSMENT
BIOLOGICAL STATION
1. CALCULATE THE INDEX VALUE FOR EACH GROUP.
a. Look at the Sensitivity Groups of Page 1. In each Group box below, count the number of R’s and write that number in the space to the left. Do the same for the C’s, then D’s.
b. Multiply each number by its Weighting Factor (WF). Write that number to the right.
c. Add the numbers in the Value column on the right to get the Index Value for that Group.
Group I: Sensitive W F Value for each Abund Code
Group II: Sensitive W F Value for each Abund Code Group III: Sensitive W F Value for each Abund Code
2. CALCULATE
3.
DATA REFERENCE SHEETS
Dissolved Oxygen:
7 – 11 mg/L
Temperature:
Vermont Water Quality Standards for Rivers and Streams
Between 13°C (55°F) - 19°C (67°F)
Vermont Fish and Wildlife states optimum temperatures for the following cold water fish species:
• Brown Trout: optimum temperatures range from 12°C (53°F) to 19°C (66°F)
• Brook Trout: optimum temperatures between 13°C (55°F) to 15.5°C (60°F)
pH:
6.5 – 8.5 (VT DEC, 2022)
Phosphorus:
< 0.05 mg/L (no impact), 0.05 – 0.10 mg/L (possible impacts), > 0.10 mg/L (impacted)
Conductivity:
150 – 500 uS/cm (microSiemens)
Vermont - New Hampshire Upland:
• Average = 84
• 25th percentile = 51
• 75th percentile = 118
Turbidity:
0 – 50 NTUs (no impact), 51 – 150 NTUs (possible impacts), > 150 NTUs (impacted)
Turbidity levels not to exceed 10 NTU in cold water fish habitat as an annual average under dry weather base-flow conditions (VT DEC, 2022).
TRANSPARENCY CONVERSION CHART
*NTU = Nephelometric Turbidity unit
CONTACT US
Watershed.Alliance@uvm.edu uvm.edu/seagrant/
@LakeChamplainSeaGrant
Lake Champlain Sea Grant
@LakeChamplainSG
ACKNOWLEDGEMENTS
DEVELOPED BY:
Ashley Eaton, University of Vermont — Lake Champlain Sea Grant
Caroline McKelvey, University of Vermont — Lake Champlain Sea Grant
Nate Trachte, State University of New York at Plattsburgh — Lake Champlain Sea Grant
Kris Stepenuck, University of Vermont — Lake Champlain Sea Grant
Marisa Immordino, University of Vermont — Lake Champlain Sea Grant
Kate Warner, University of Vermont — Lake Champlain Sea Grant
CONTRIBUTORS AND/OR EDITORS: Erin De Vries
Don Fox
Jurij Homziak
Mark Malchoff
Marley Myers
Catrin Noel
Bethany Sargent
Elissa Schuett
Amelia Tarren
Julianna White

Funded by Lake Champlain Sea Grant, which is supported by the National Oceanic and Atmospheric Administration National Sea Grant College Program, U.S. Department of Commerce, and administered by the University of Vermont and SUNY Plattsburgh.