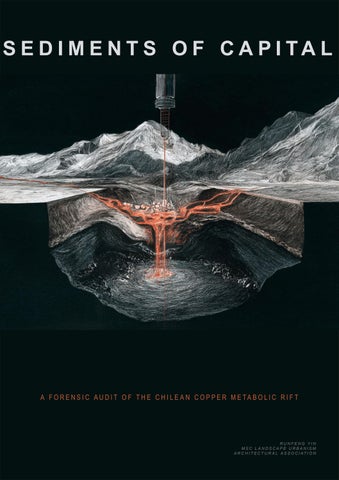
SEDIMENTS OF CAPITAL
A FORENSIC AUDIT OF THE CHILEAN COPPER METABOLIC RIFT
Workshop2 rework with the help of ai and python for collectiong data.
Team member: Runfeng Yin ,Yuyang Ding
Reworked by Runfeng Yin
Abstract:
The global imperative for decarbonization has paradoxically intensified the extractive pressure on the Global South, re-inscribing colonial patterns of unequal exchange under the guise of the "Green Transition." This project investigates the socio-ecological collateral damage of copper mining in Chile, focusing on the operations of Anglo American in the Los Bronces district. By synthesizing historical archives from the Allende era with contemporary financial and geological data, the research exposes the systemic asymmetry between the mobility of capital and the immobility of toxic waste.
Methodologically, the project employs a counter-forensic approach. It challenges the corporate narrative of "sustainable mining" by reconstructing the material reality of extraction. Through mass balance algorithms and geospatial simulation, the research reveals how the privatization of natural resources—cemented during the post-1973 neoliberal shift—has transformed Chile into a repository of global industrial risk.
The investigation is visualized through five scalar evidences:
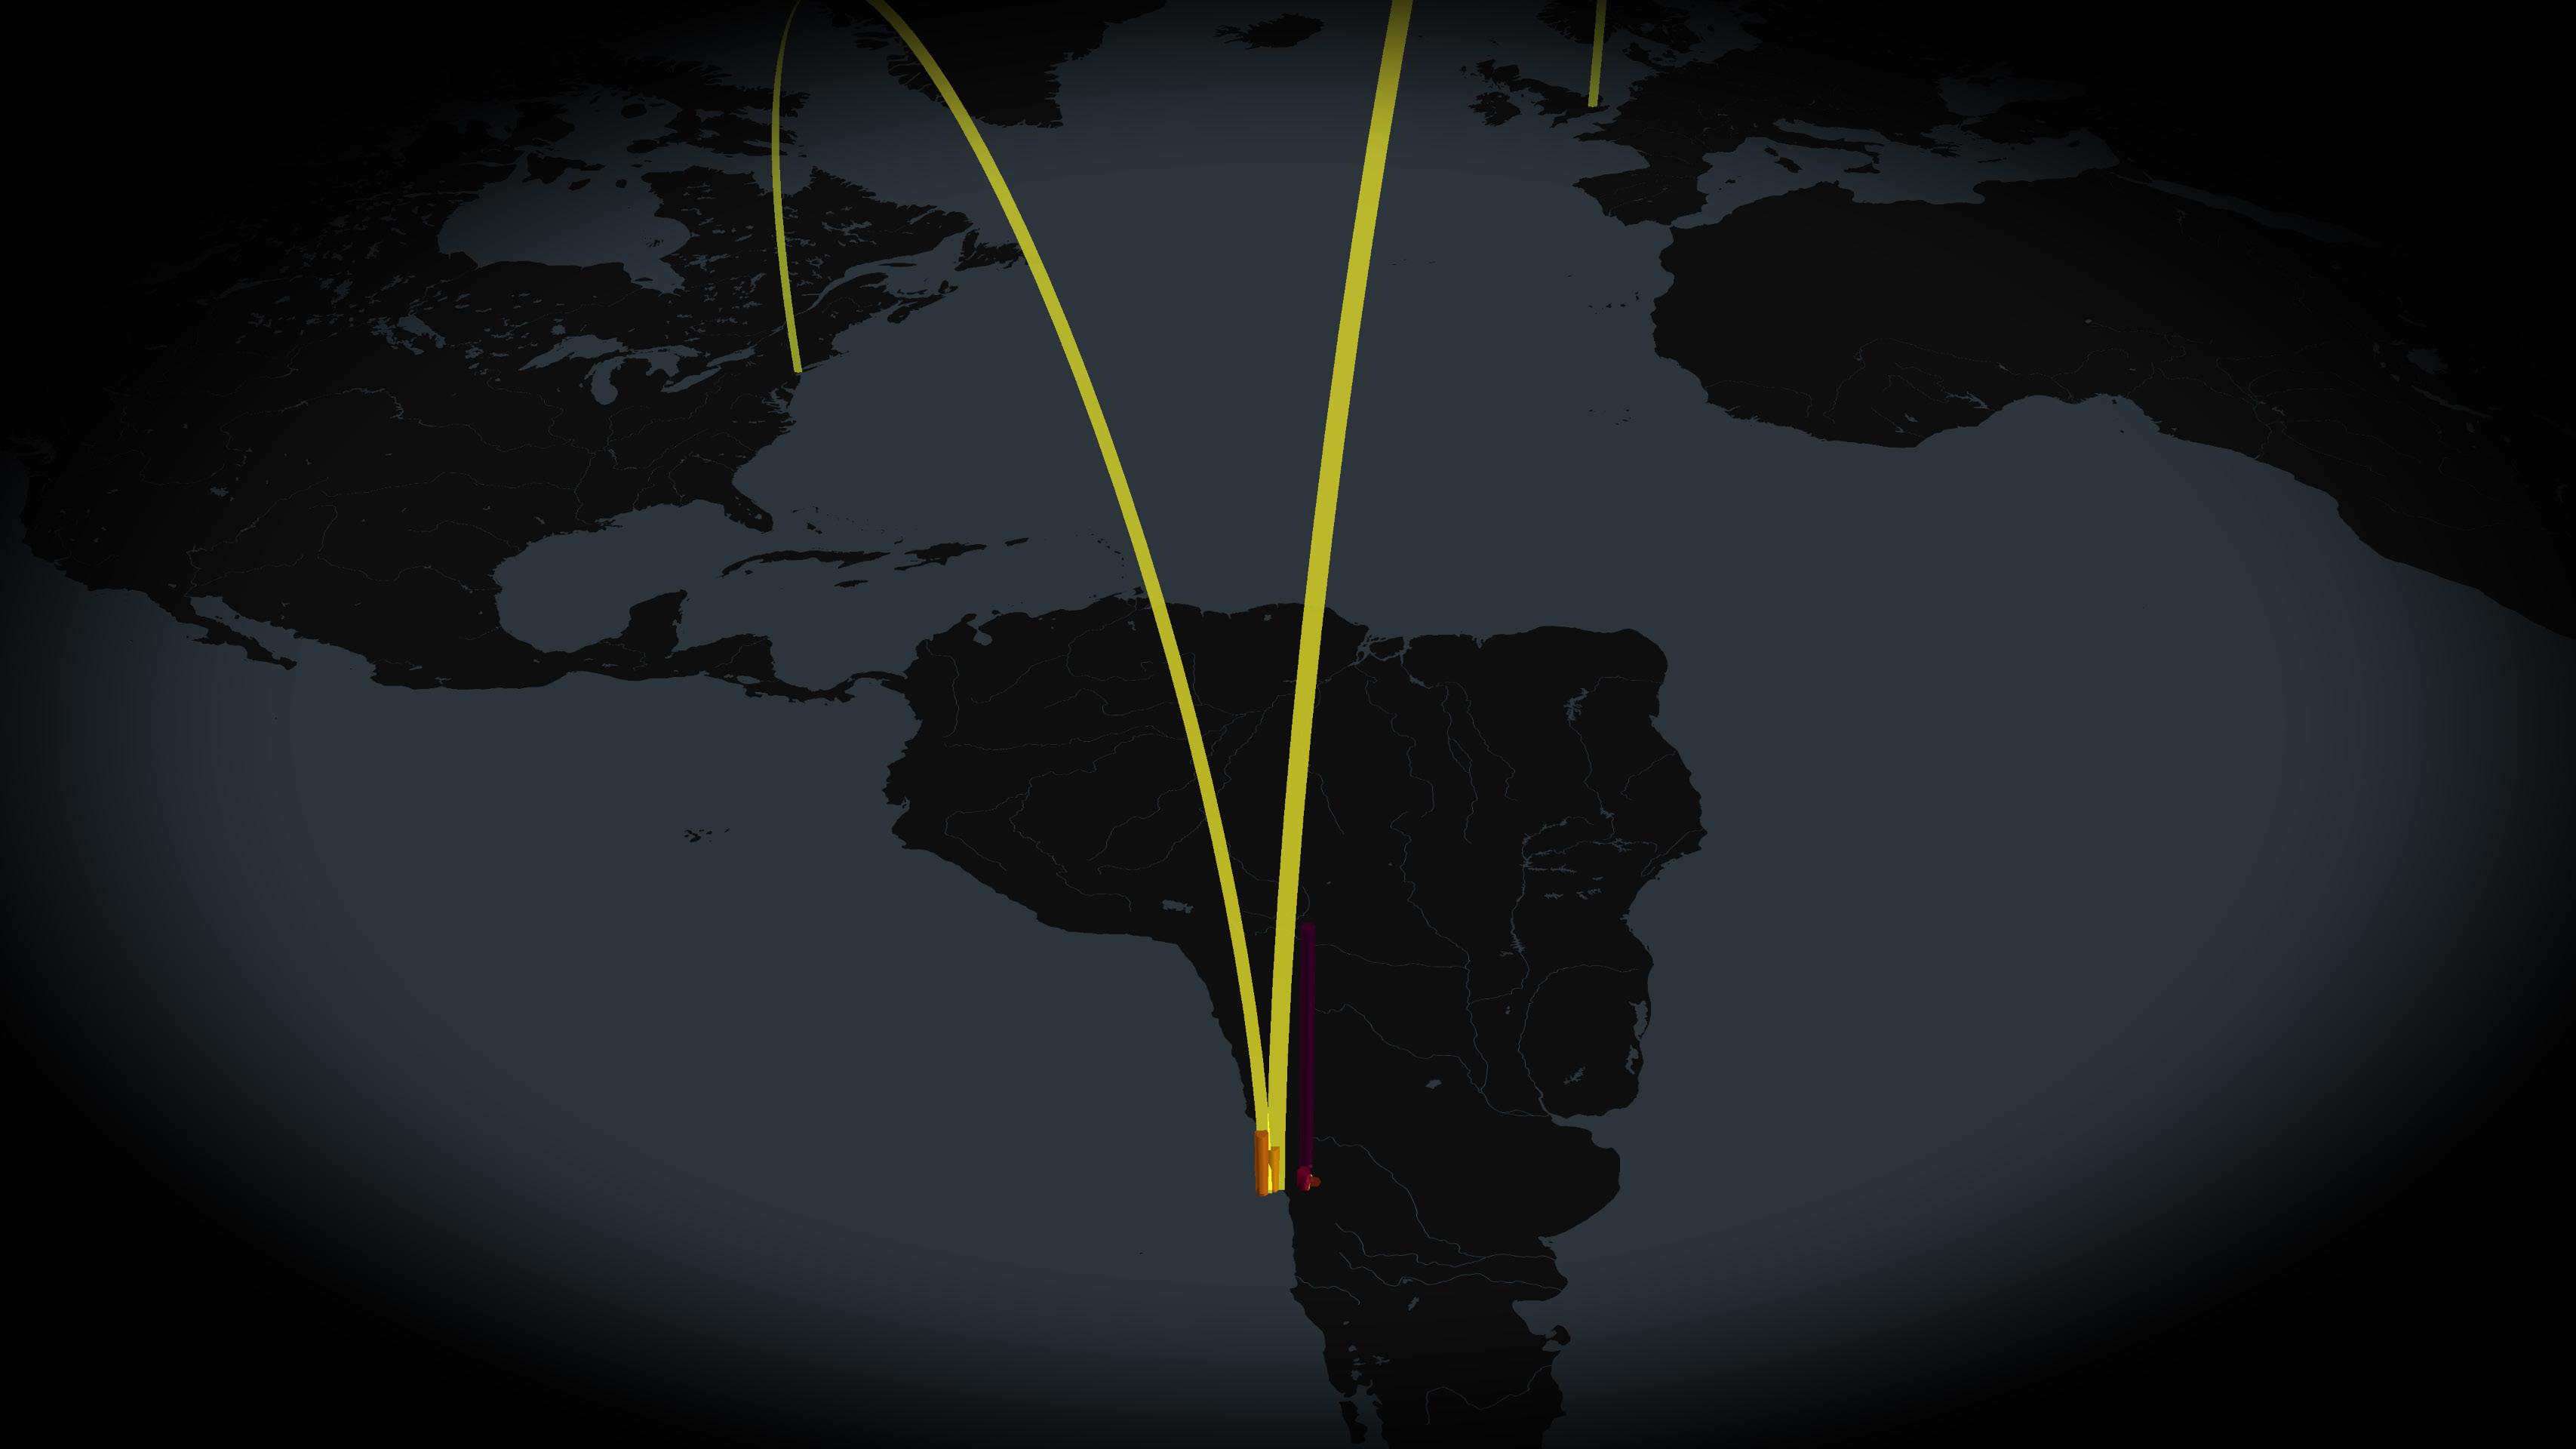
1. Planetary Displacement: Mapping the geopolitical shift of tailings dam failures from the Global North to the South, proving the phenomenon of "environmental arbitrage."
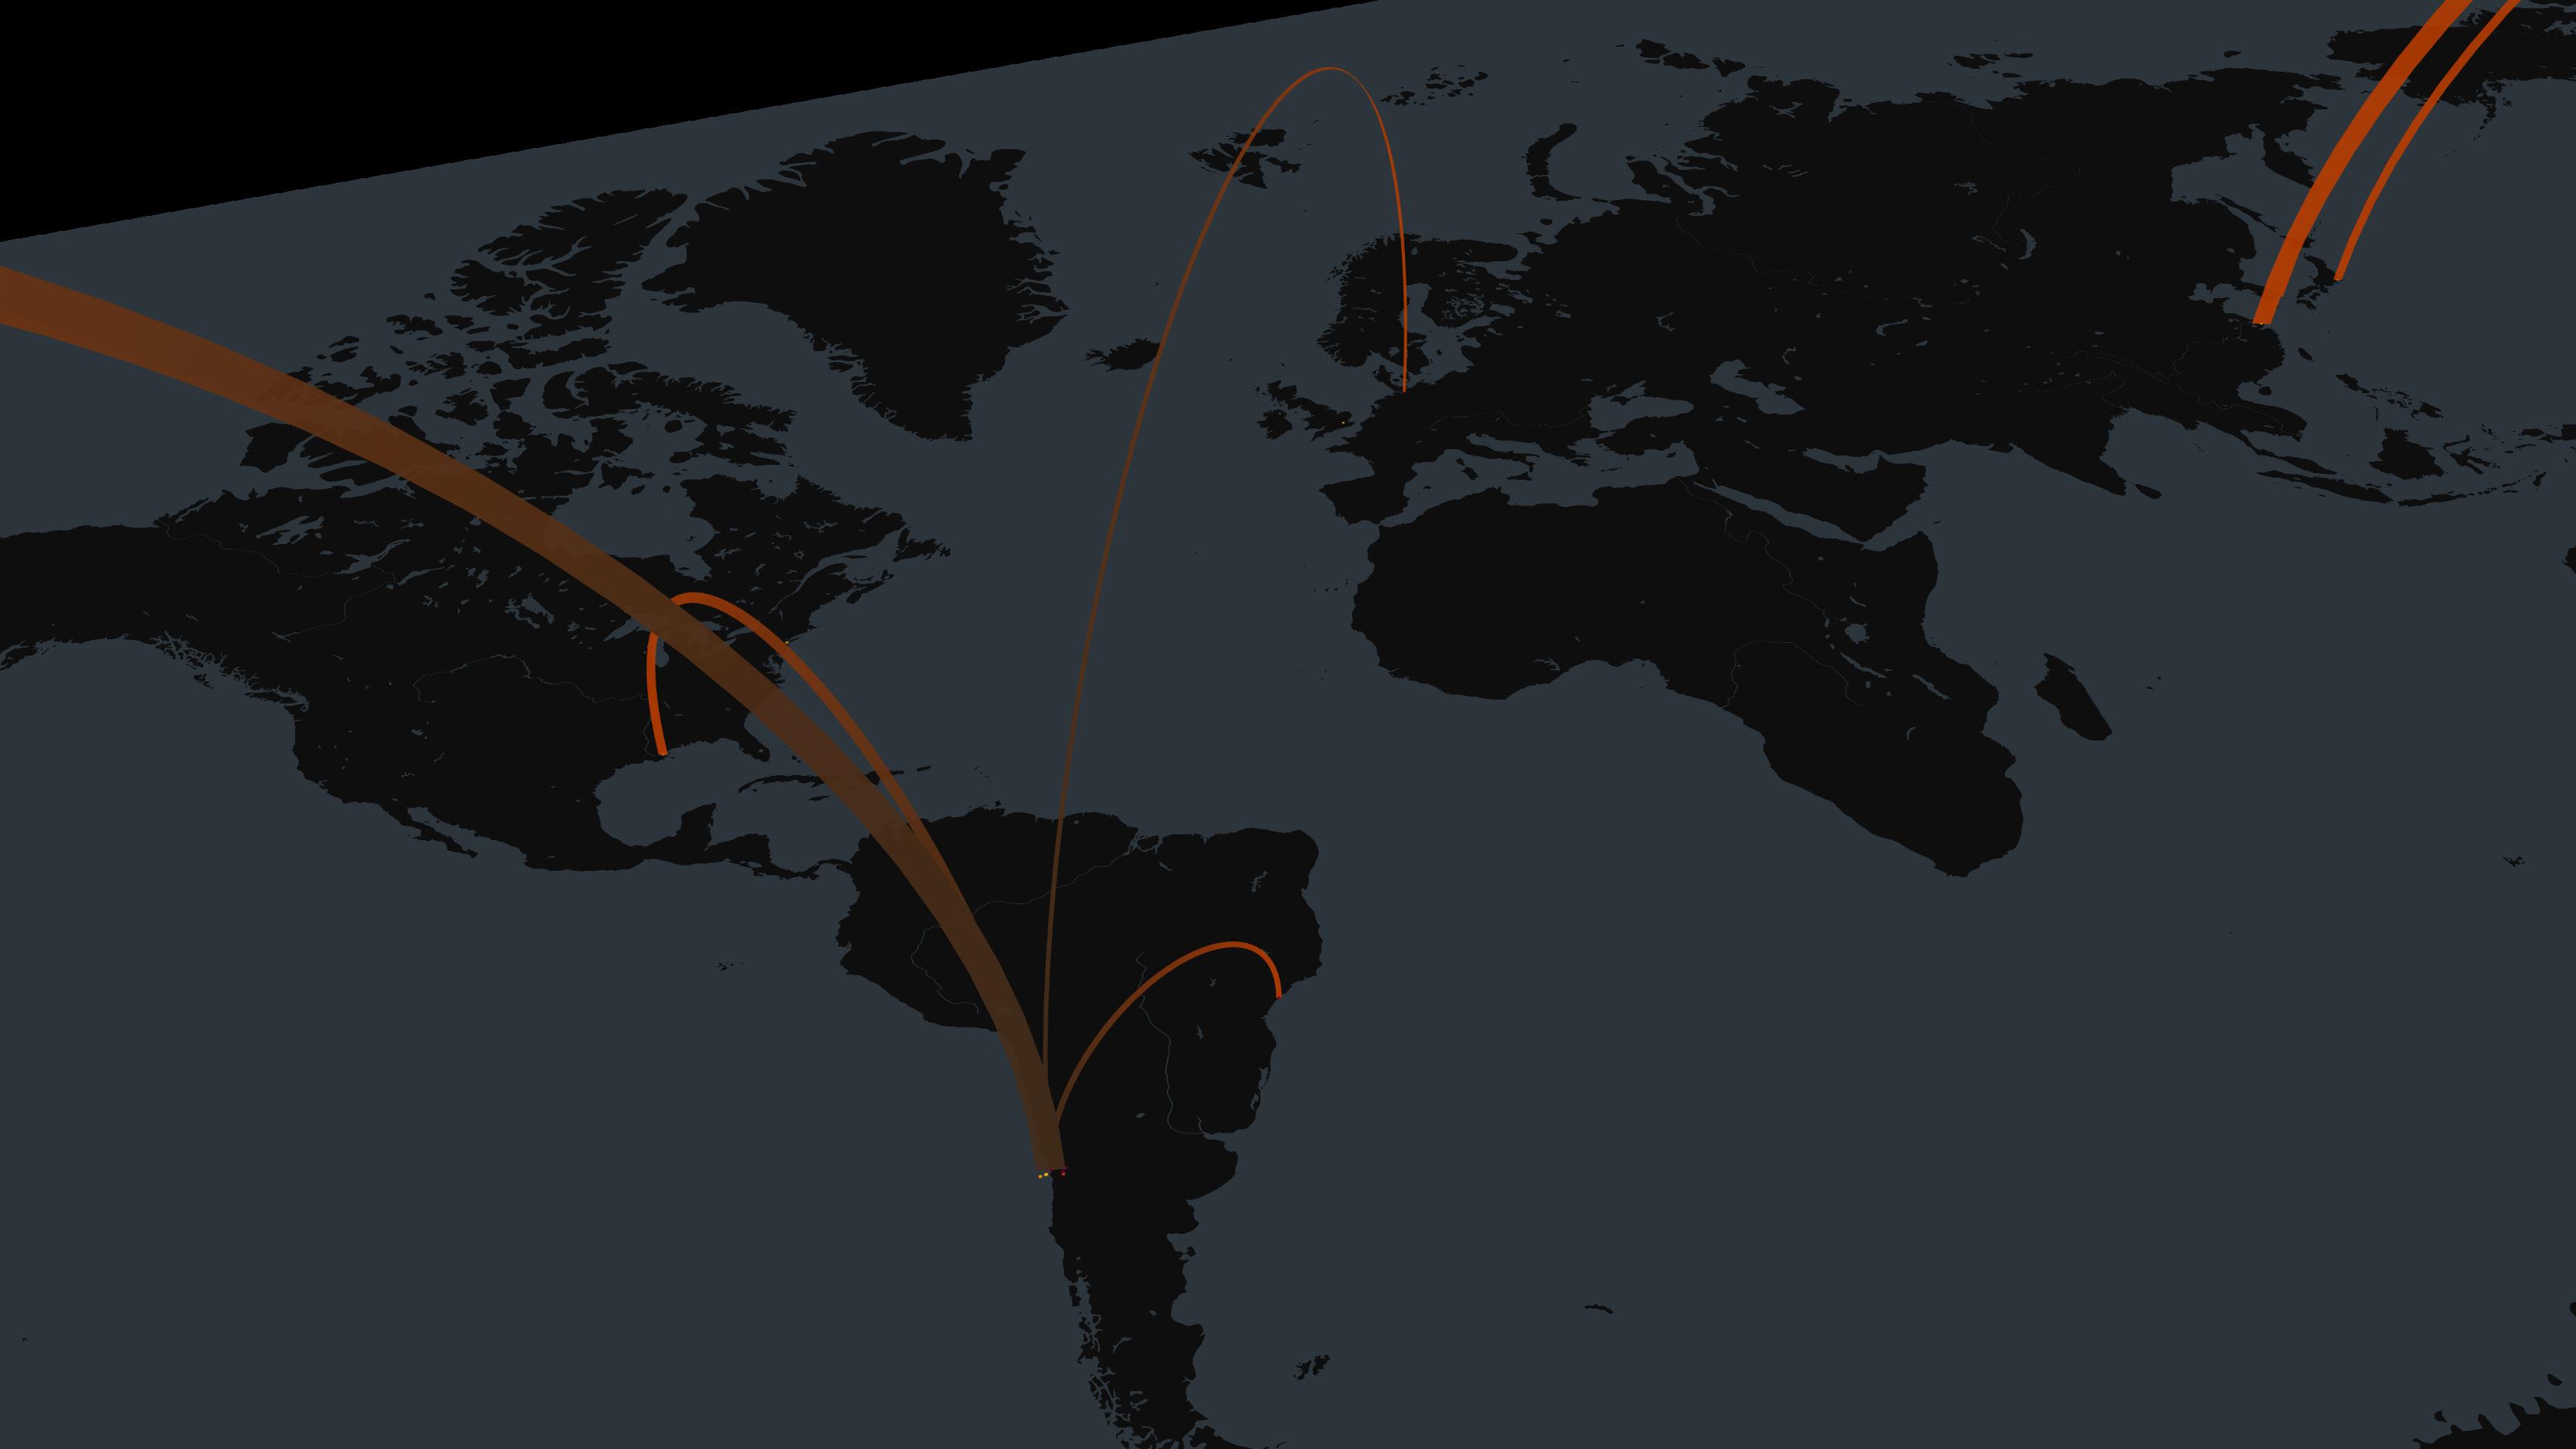
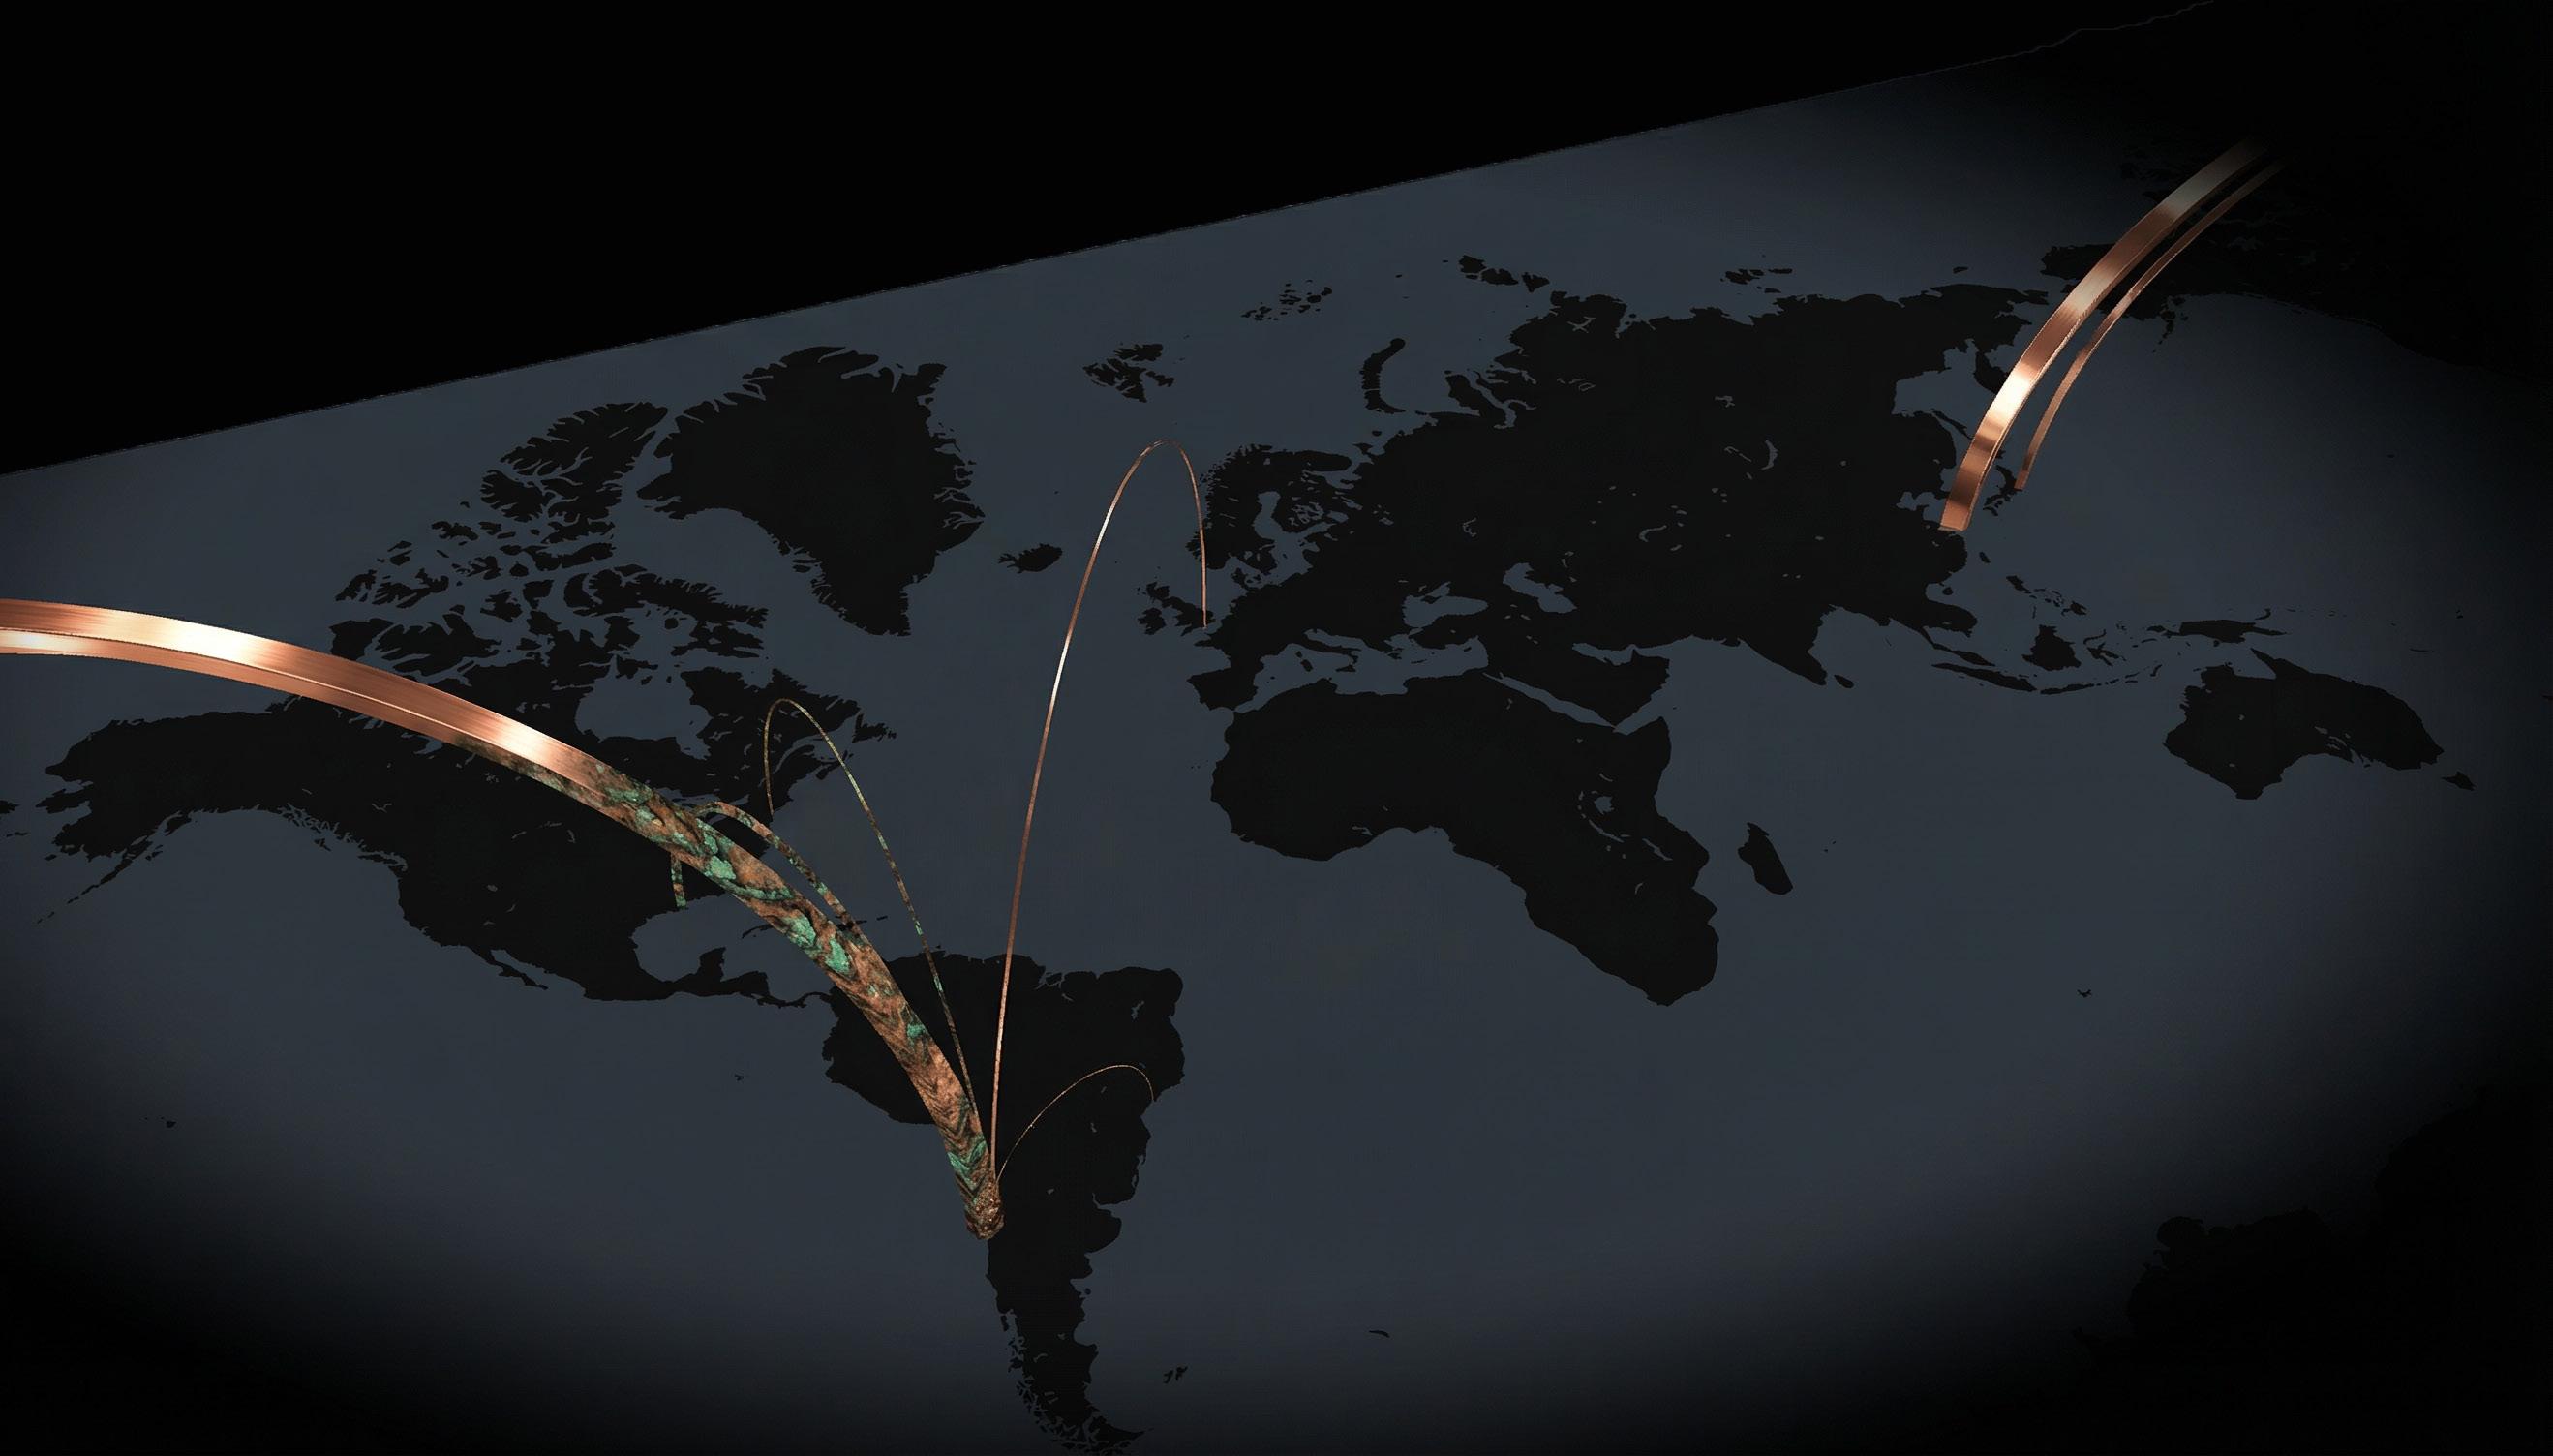
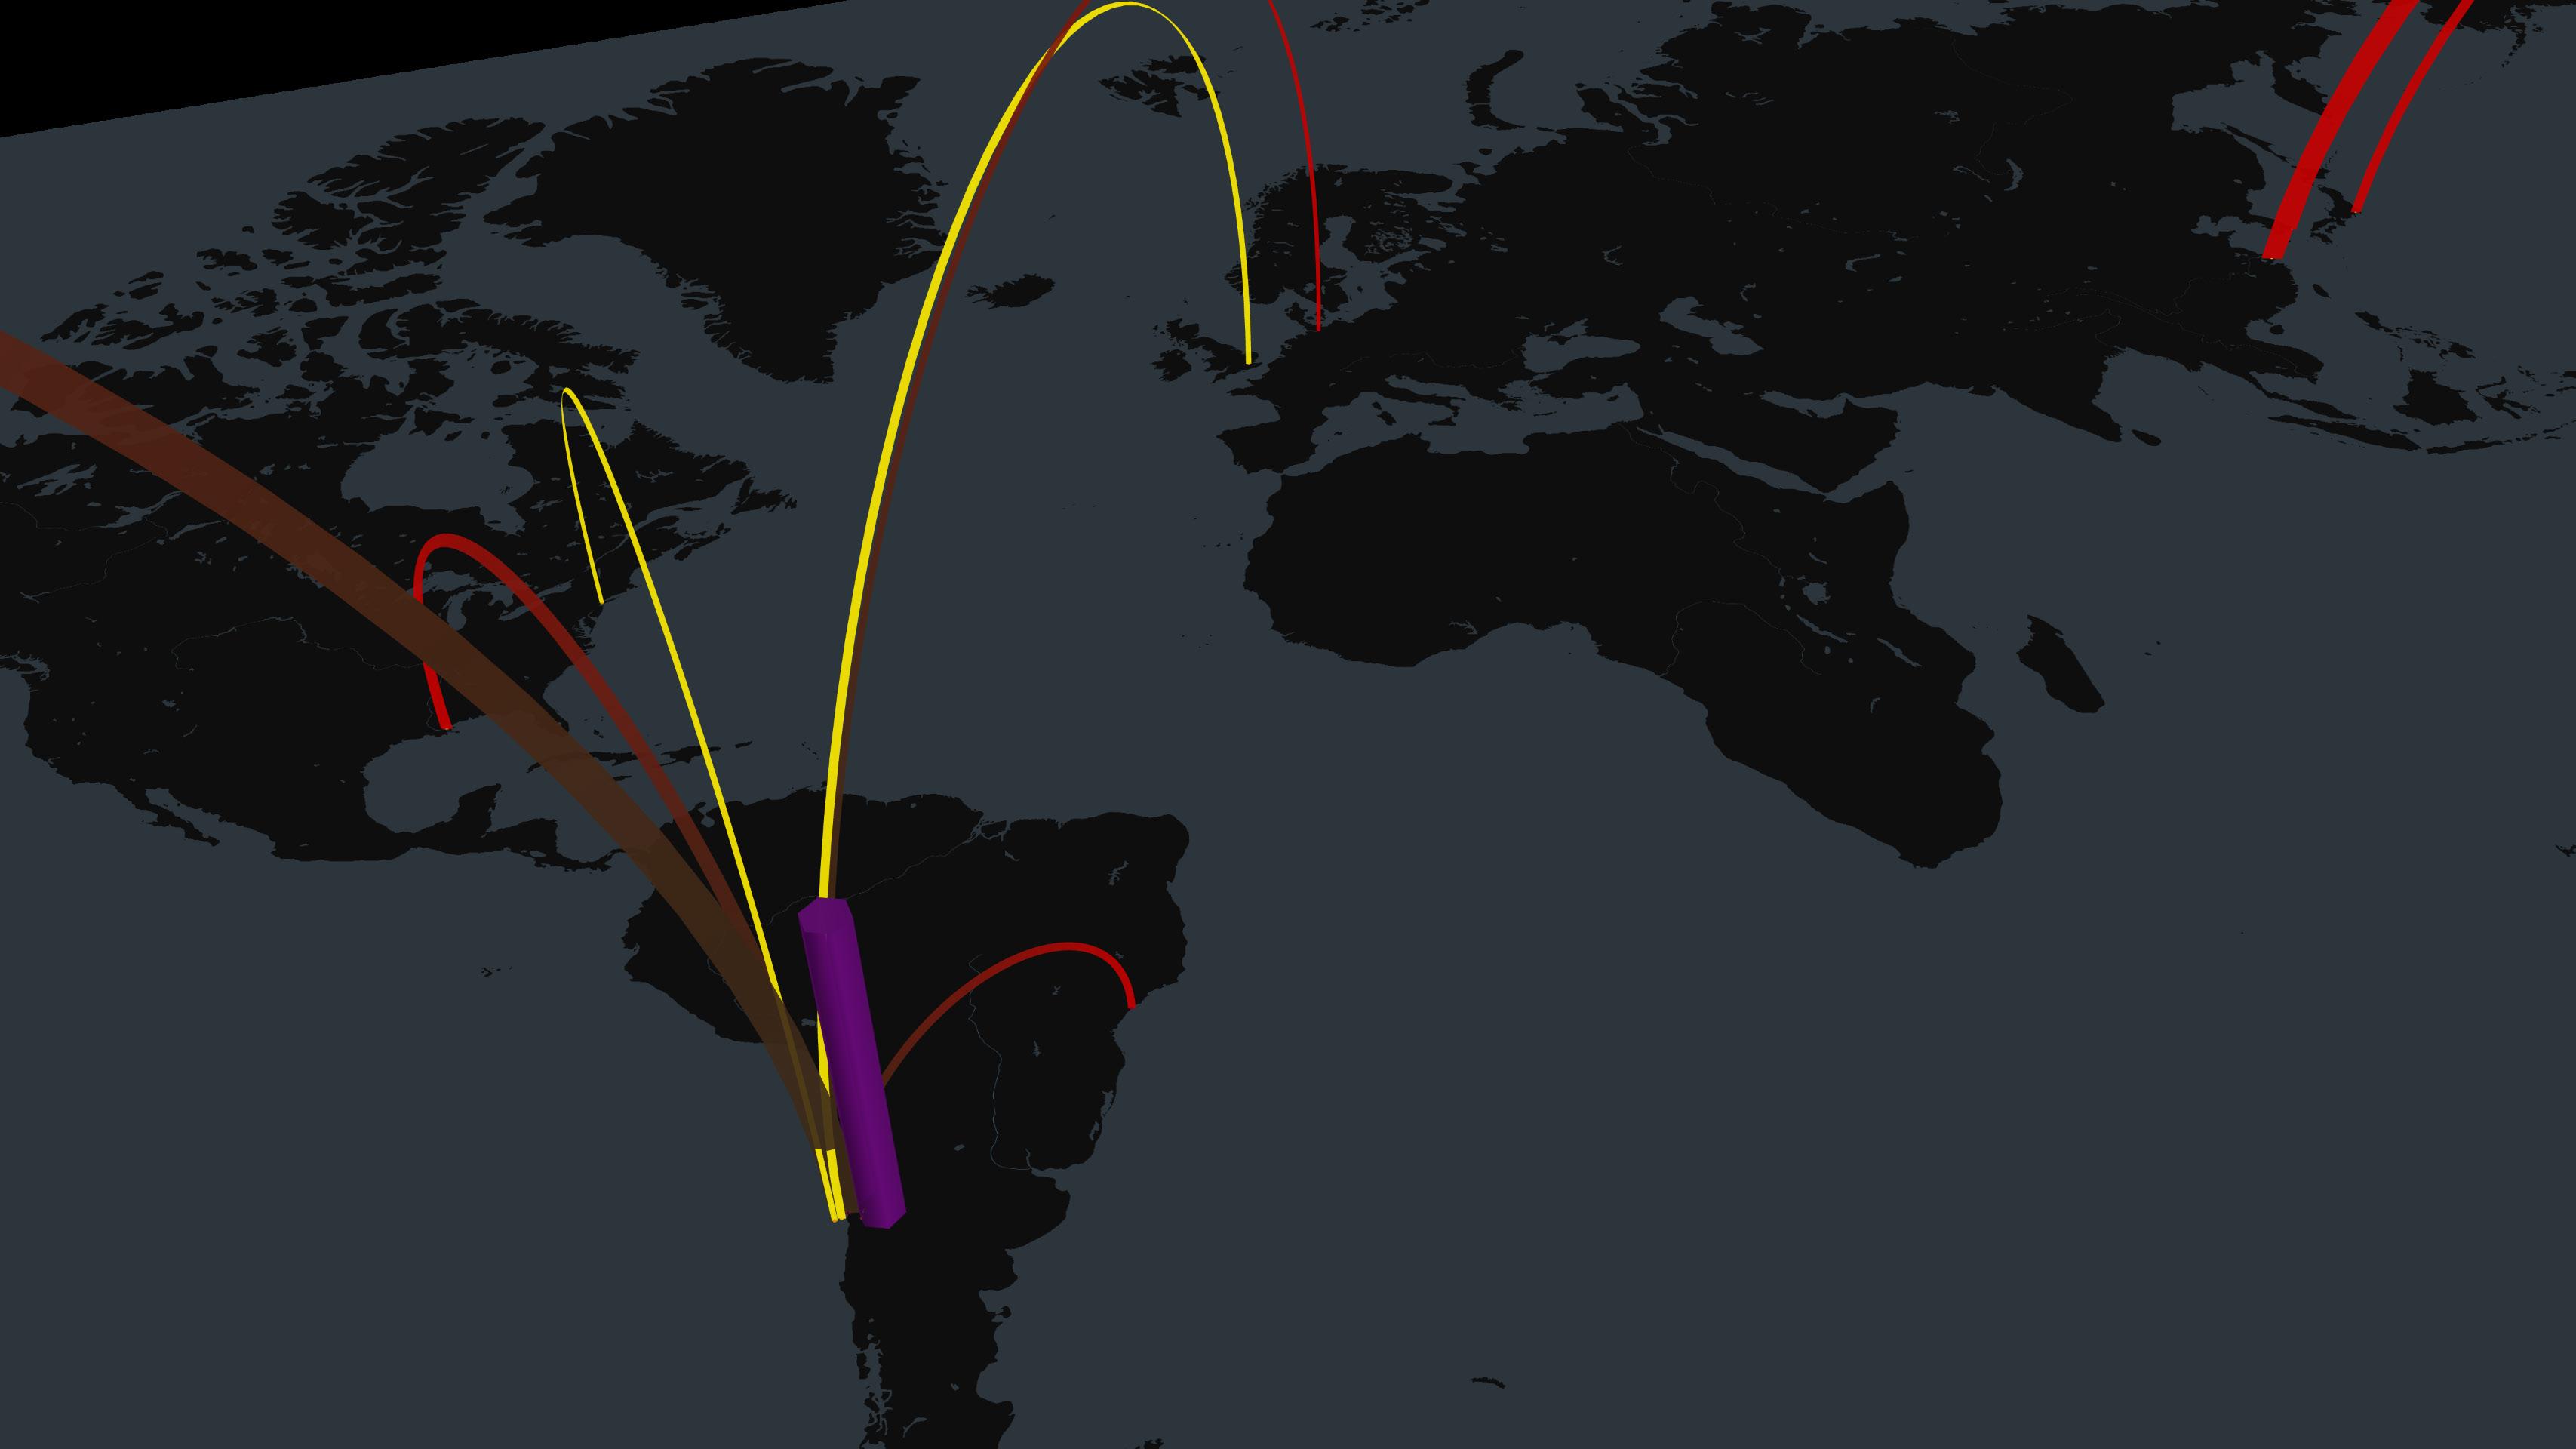
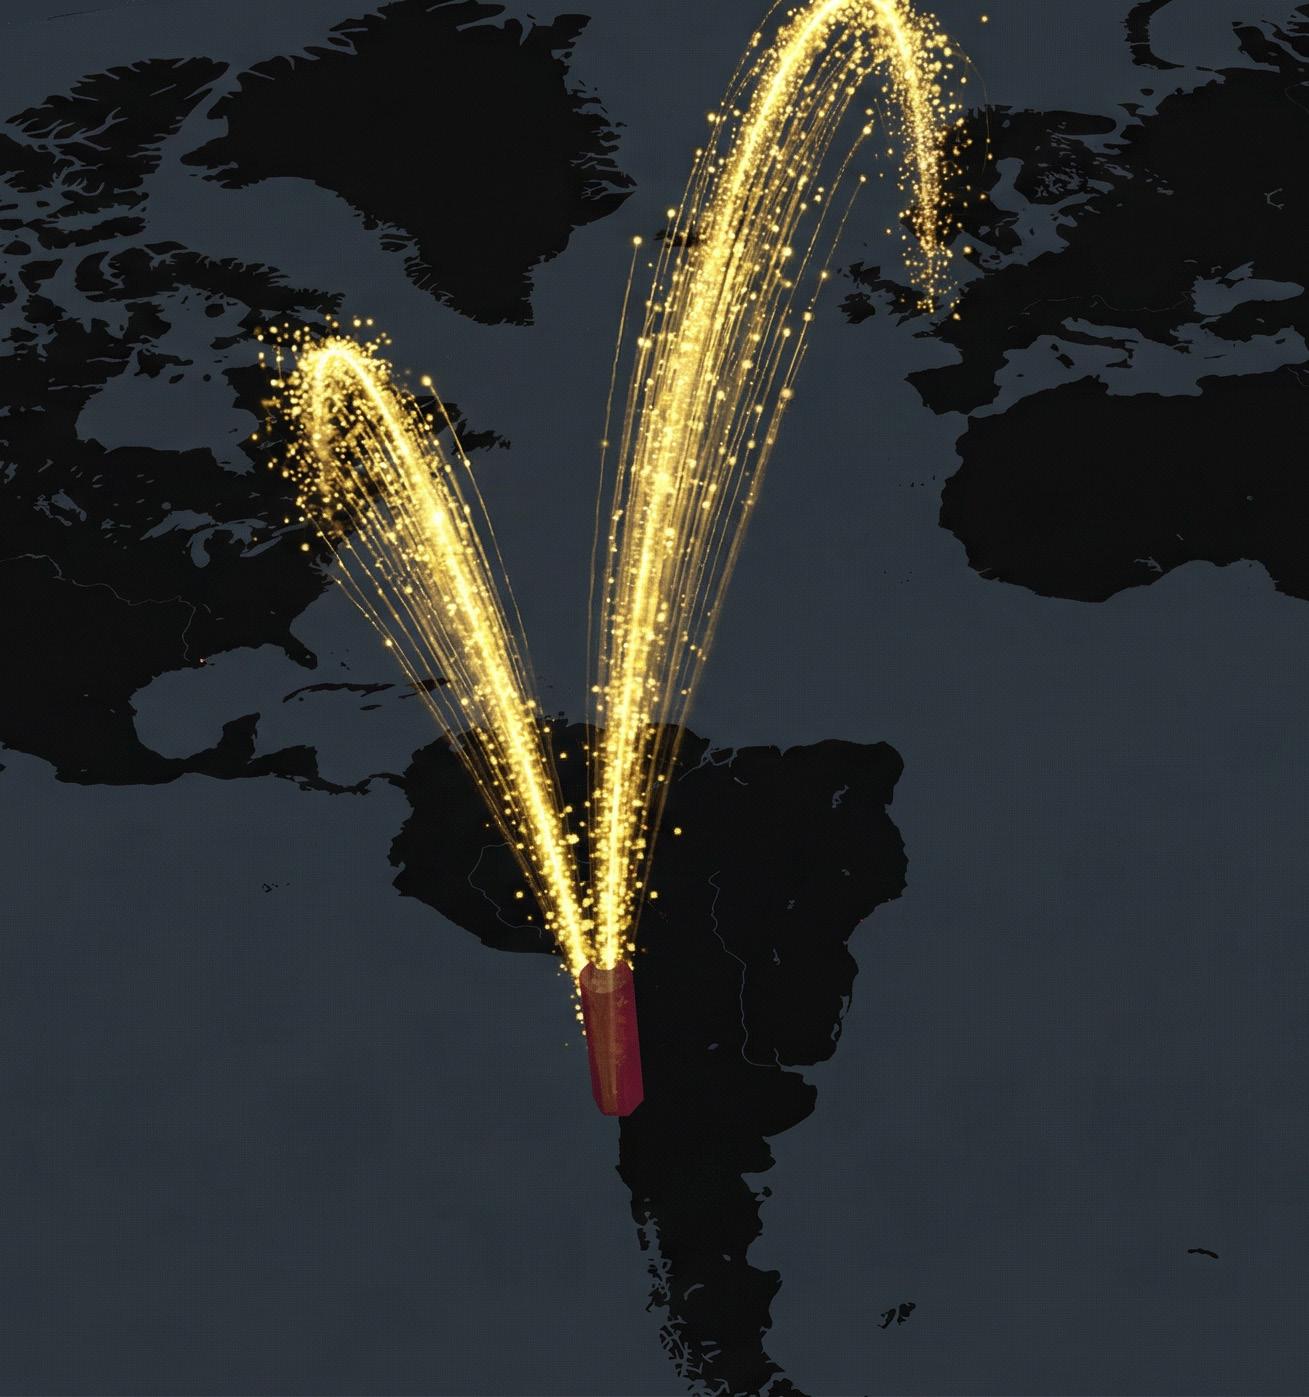
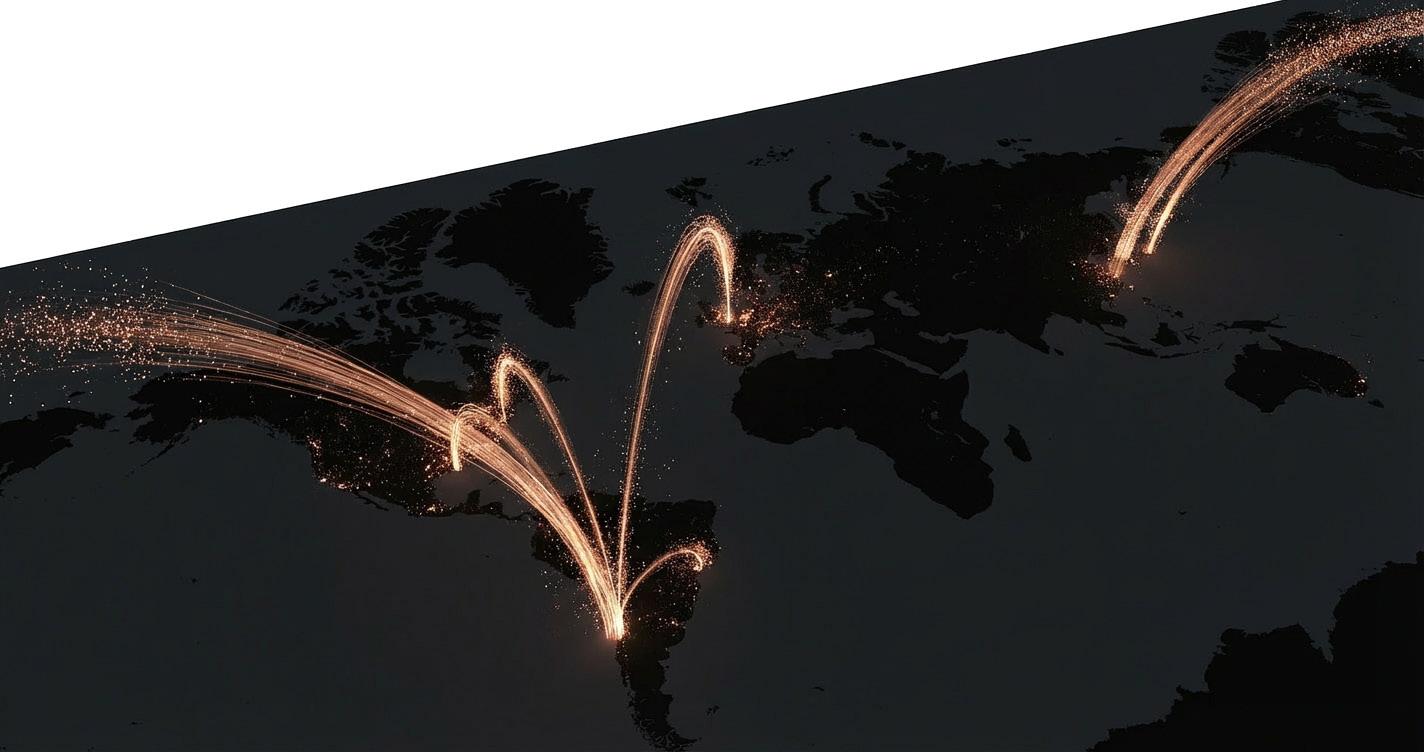
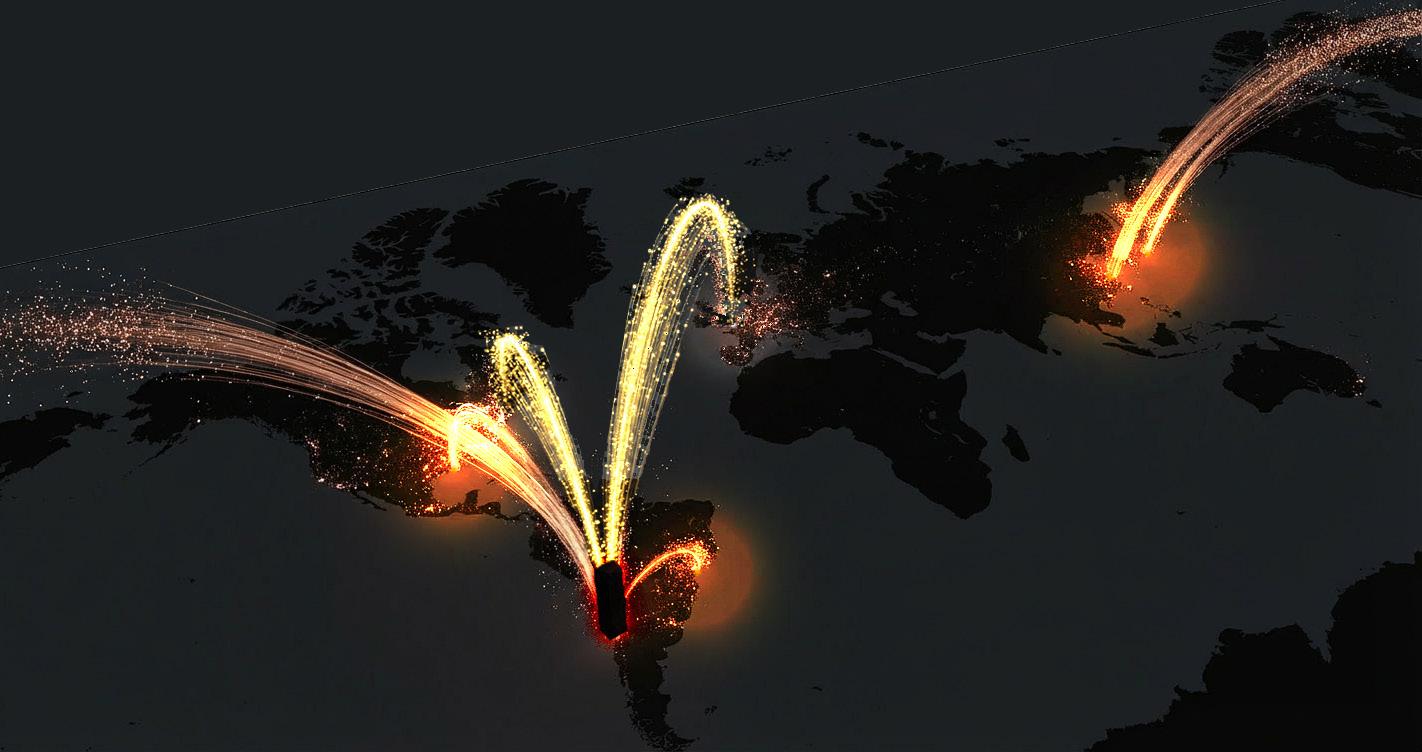
2. The Extraction Arteries: A flow analysis tracing the diversion of copper (material) and profits (capital) to foreign centers, contrasted with the permanent accumulation of toxic tailings in the local landscape.
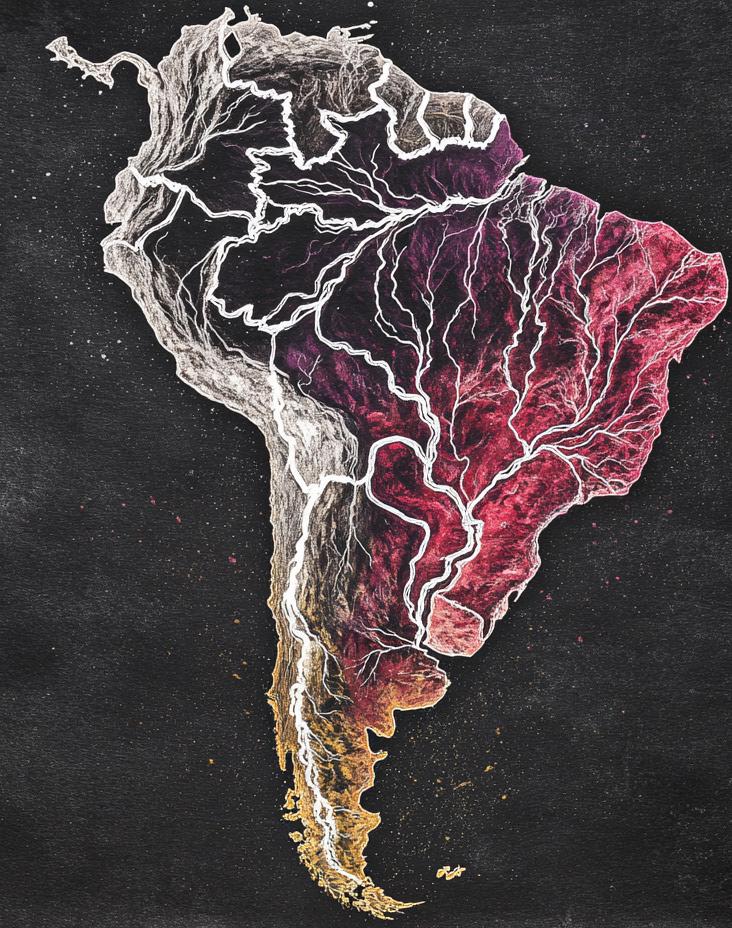
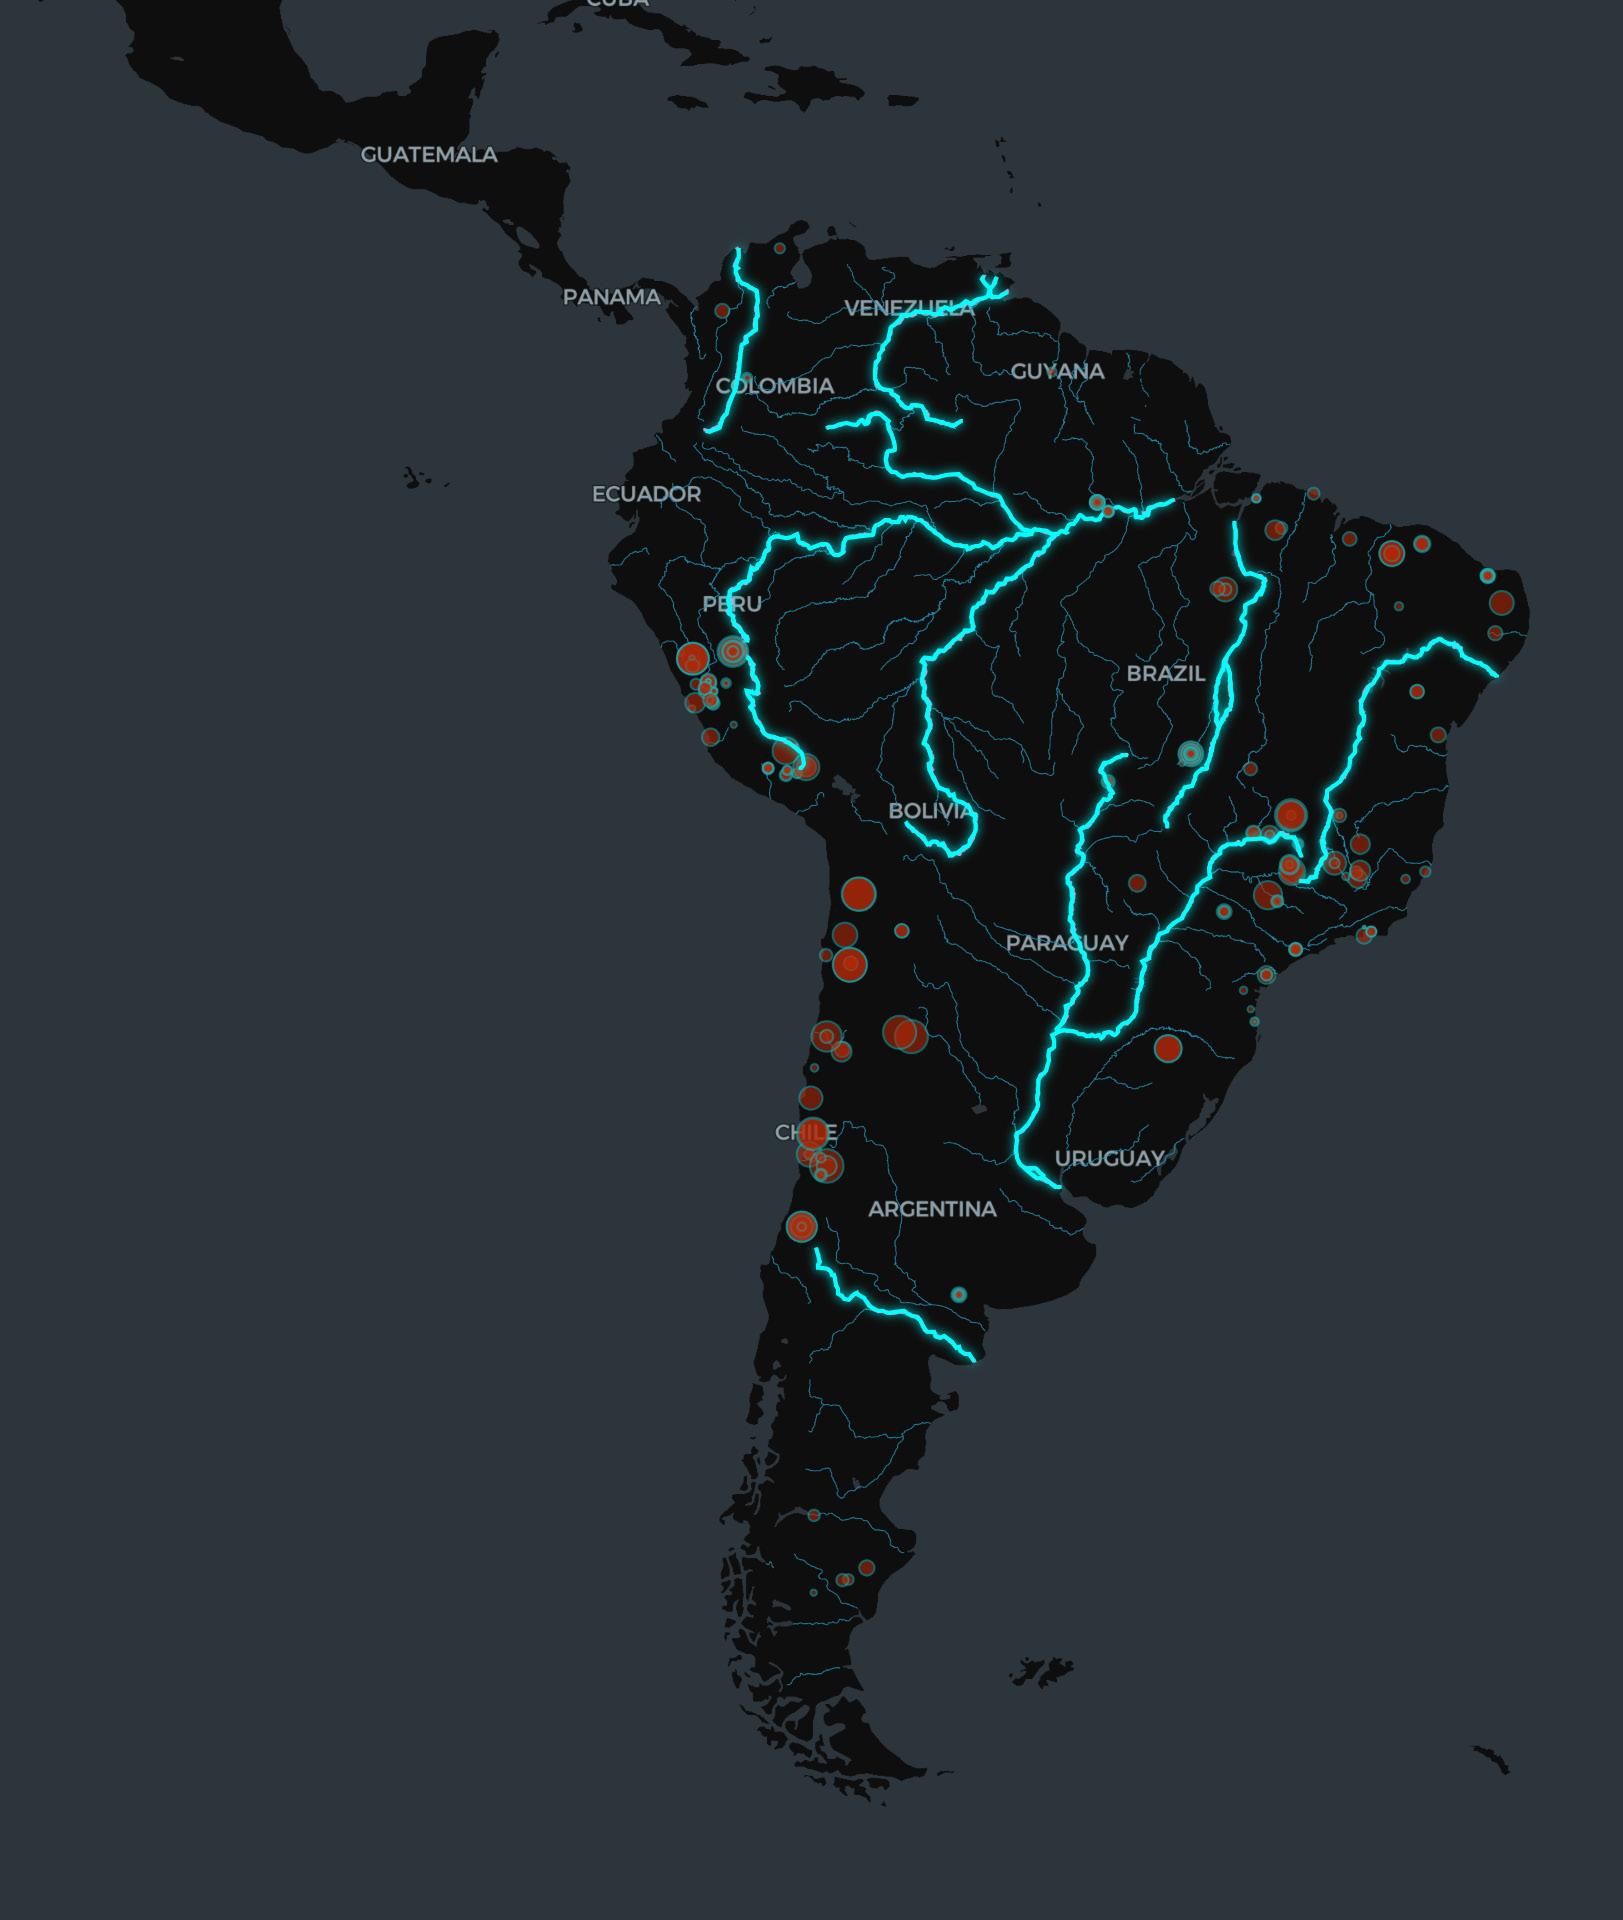
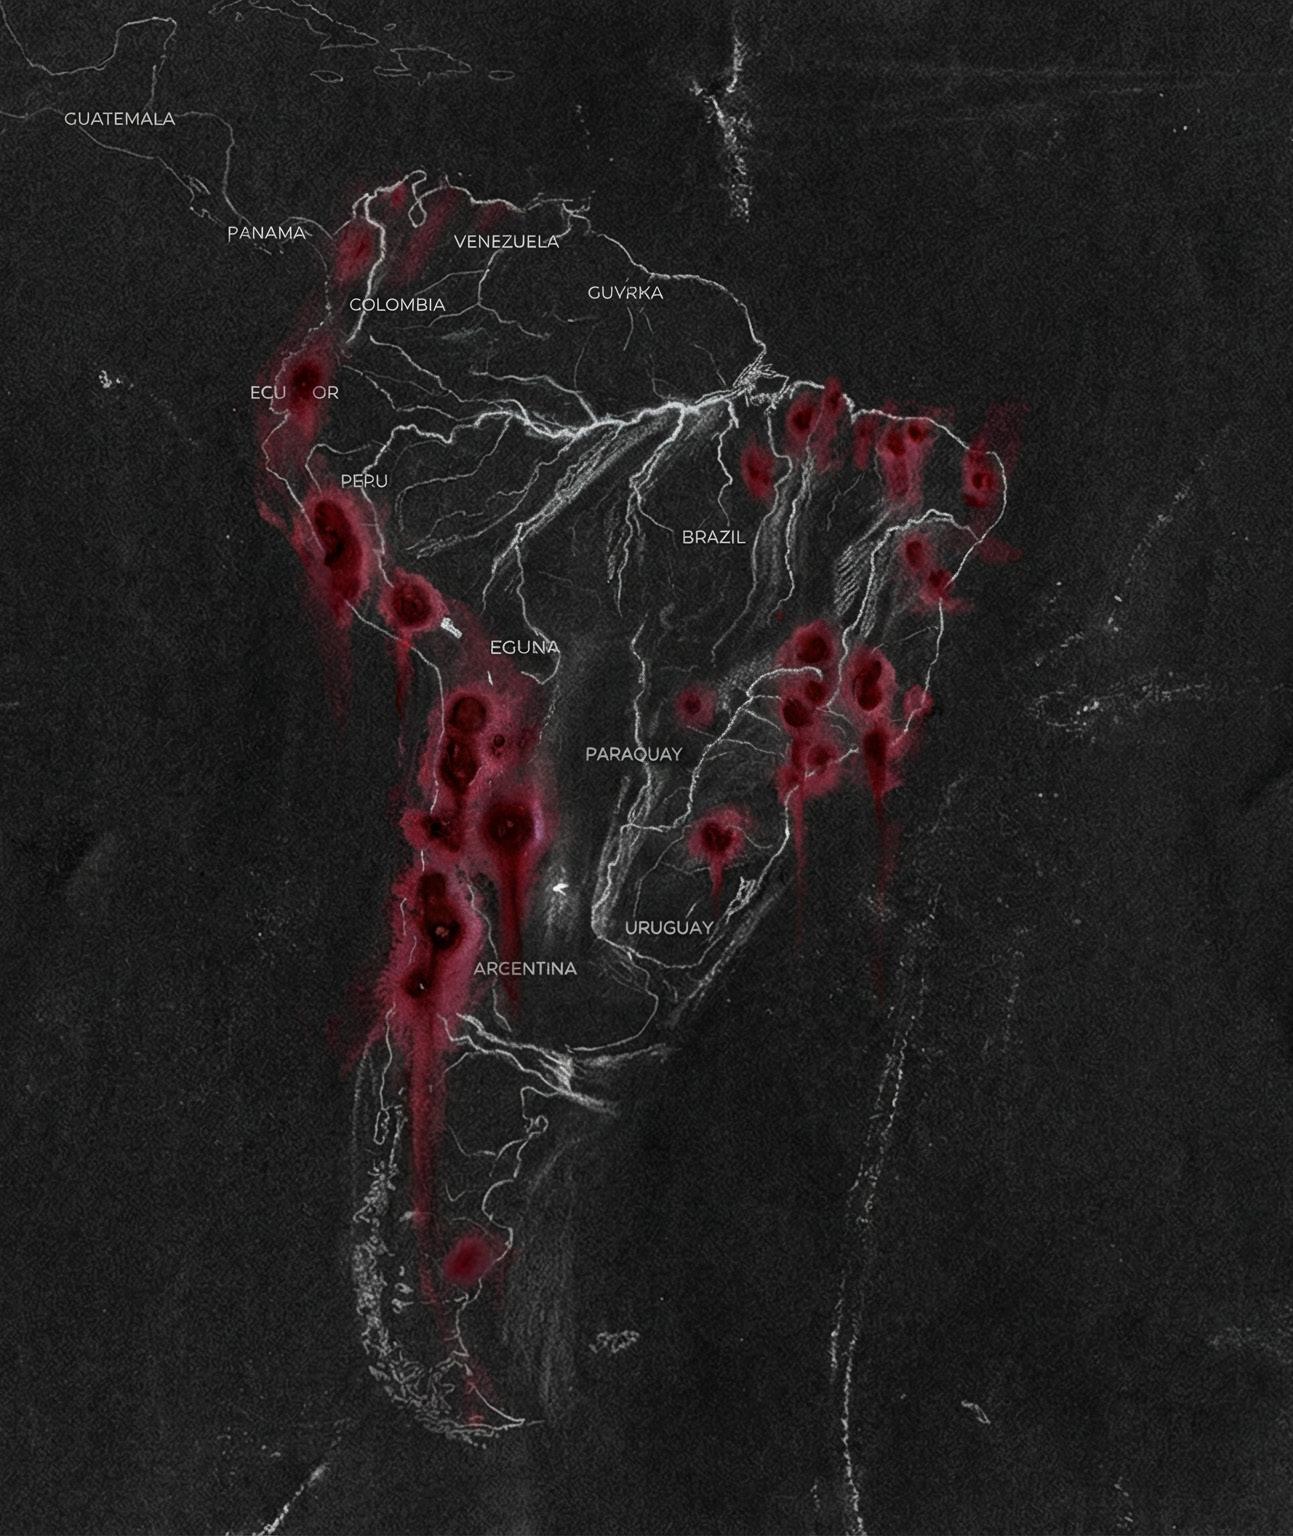
3. Continental Asymmetry: A hydro-social risk simulation across South America, demonstrating how localized private footprints threaten vast public river networks.
4. The Tectonic Gamble: A spatiotemporal overlay of seismic activity (USGS data) and tailings storage, exposing the engineering hubris of accumulating fluid waste within the "Ring of Fire."
5. Recursive Trauma: A comparative reconstruction of the 1965 El Cobre disaster and the looming threat of the El Torito dam, visualizing the exponential growth of risk and the historical recurrence of negligence.
This project asserts that the tailings dam is not merely an engineering byproduct, but a monument to the "negative value" left behind by global capitalism—a geological debt that the Chilean territory is forced to bear in perpetuity.
Technical Toolkit:
Data Mining & Cleaning: Python (Pandas/Geopy) via Google Colab.
Geospatial Analysis: QGIS, Natural Earth Data, USGS Earthquake API.
Data Visualization: Kepler.gl (WebGL-based large-scale geospatial mapping).
AI-Assisted Rendering: Midjourney (Texture generation), Nano Banana (Style transfer & Structure preservation), Jimeng/Runway (Motion simulation).
uploaded = files.upload()
# 获取文件名
filename = next(iter(uploaded))
print(f" 正在读取 : {filename} ...")
# 读取 Excel
try:
df = pd.read_excel(io.BytesIO(uploaded[filename]))
print(" 读取成功!开始法医级清洗 ...")
except Exception as e: print(f" 读取失败 : {e}")
# ==========================================
# 核心逻辑:提取与换算函数 # ==========================================
def clean_volume_m3(text):
"""
提取体积,统一转换为 立方米 (m3)。
处理 : million, >, ?
""" if pd.isna(text): return -1 text = str(text).lower().replace(',', '') # 去逗号 if '?' in text and not re.search(r'\d', text): return -1 # 只有问号没有数字
# 提取基础数字
# 优先找 "million" 结构 million_match = re.search(r'([>~]?\s*)?(\d+\.?\d*)\s*million', text) if million_match: return float(million_match.group(2)) * 1_000_000
# 找普通数字 ( 假设单位是 m3)
# 排除掉年份 ( 如 2025) 的干扰,通常体积数字会带有 m3, cubic 等关键词,或者数字很大 nums = re.findall(r'(\d+\.?\d*)', text) if nums: # 取最大的数字作为体积估计 ( 防止取到日期 )
# 这是一个启发式策略 vals = [float(n) for n in nums] best_val = max(vals) if best_val < 2030 and best_val > 1900: # 可能是年份,忽略 return -1 return best_val return -1 def clean_area_km2(text):
"""
从 Impacts 描述中提取受污染面积,统一转换为 平方公里 (km2)。 支持 : km2, sq km, acres, hectares
""" if pd.isna(text): return 0 text = str(text).lower().replace(',', '')
# 1. 找 km2 / square km km_match = re.search(r'(\d+\.?\d*)\s*(?:km2|sq\s*km|square\s*kilometers)', text) if km_match:
&
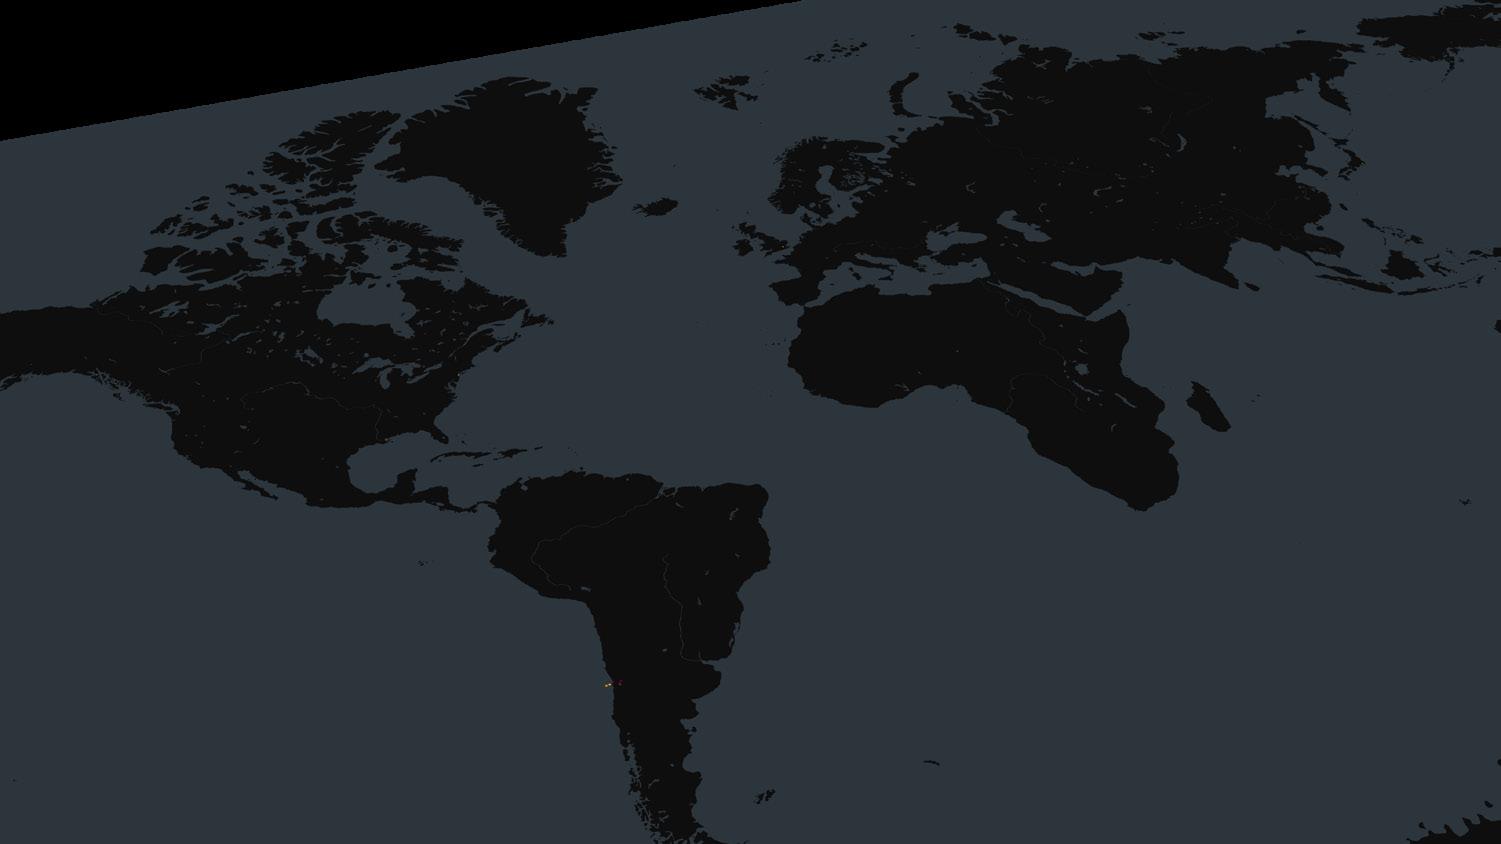
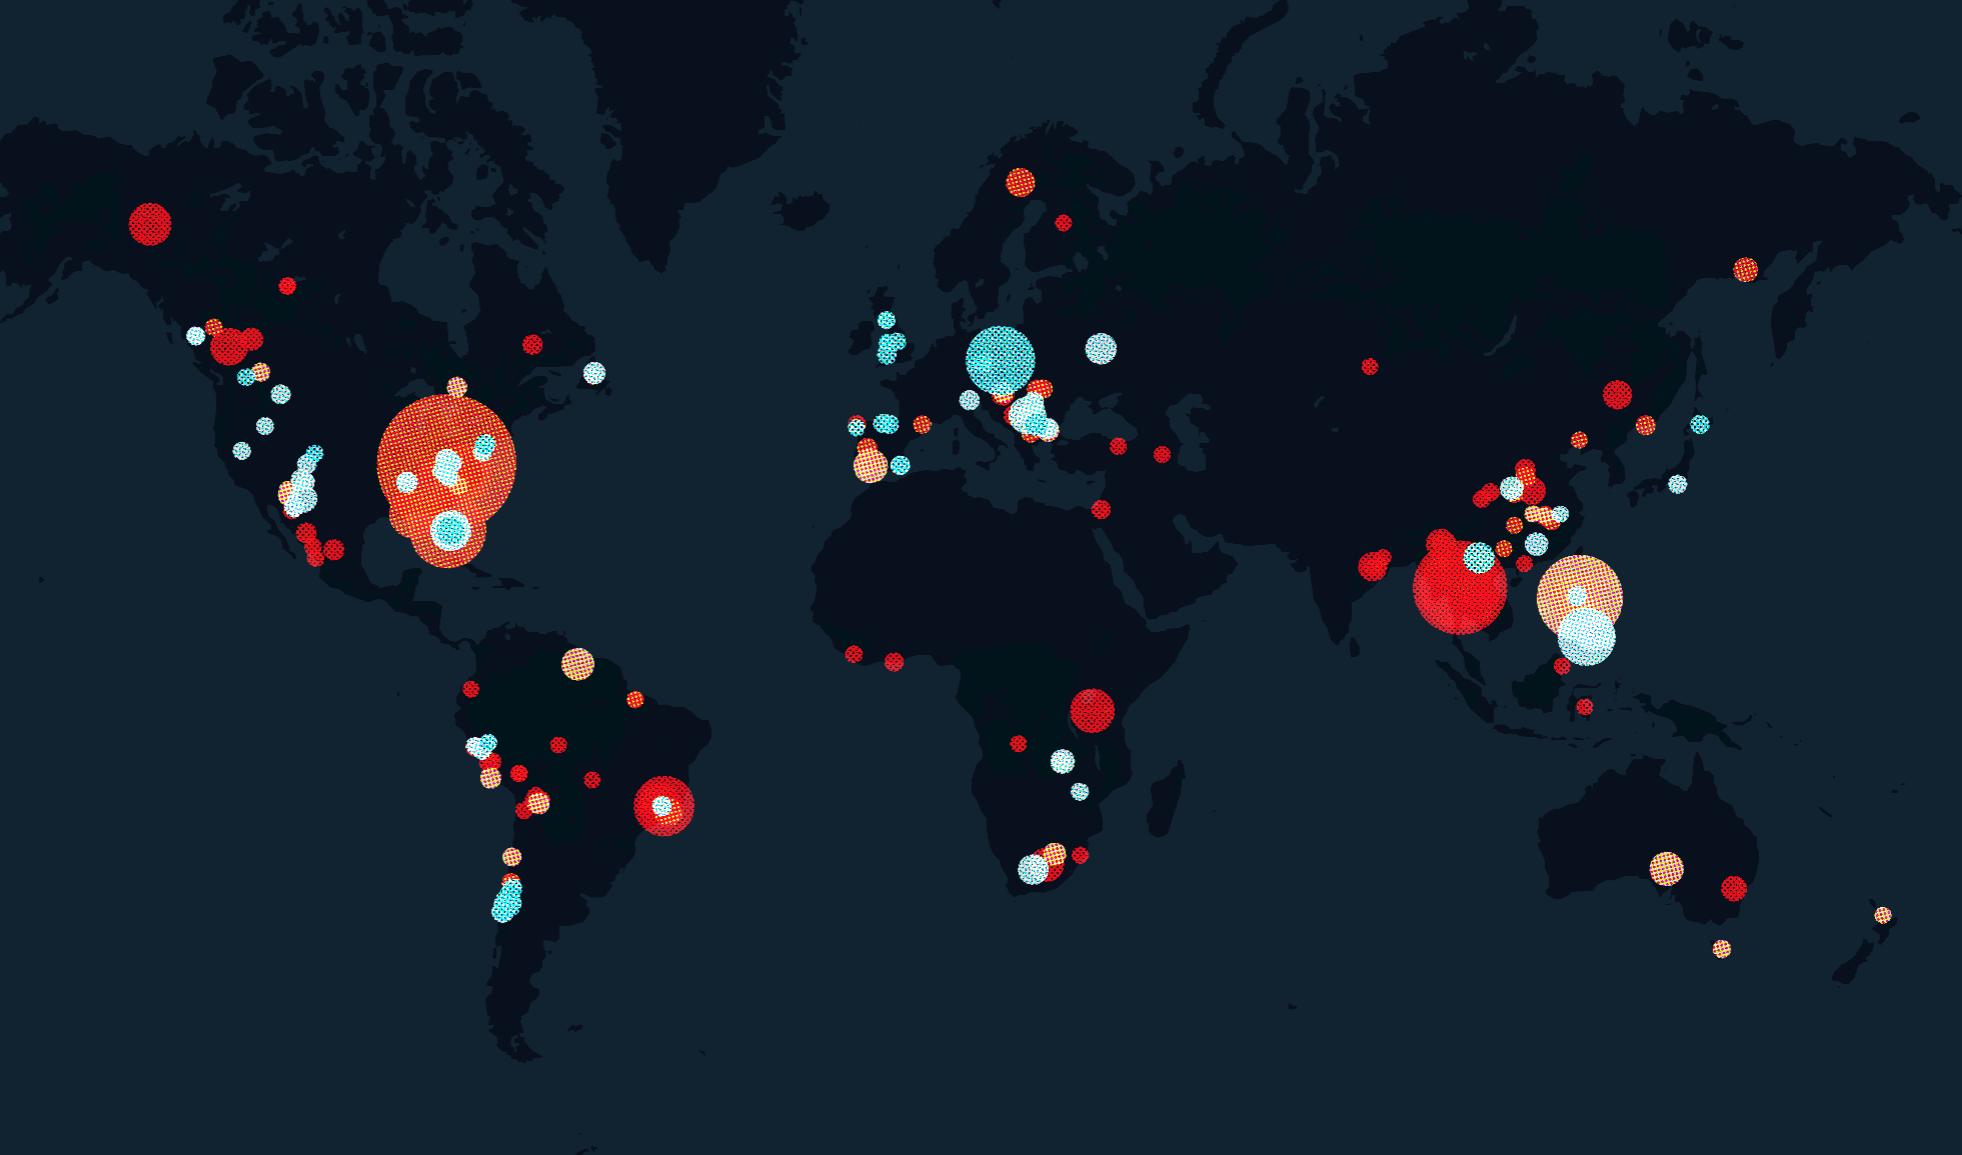
This visualization is constructed from the WISE Uranium Project's historical database of major tailings dam
Due to the unstructured nature of the original archives, a custom Python script was deployed to scrape, parse, and clean the dataset. Ambiguous location data was reconstructed using Google Geocoding API to achieve precise geospatial coordinates, while missing volumetric data was standardized through cross-referencing industry reports.
Conclusion:
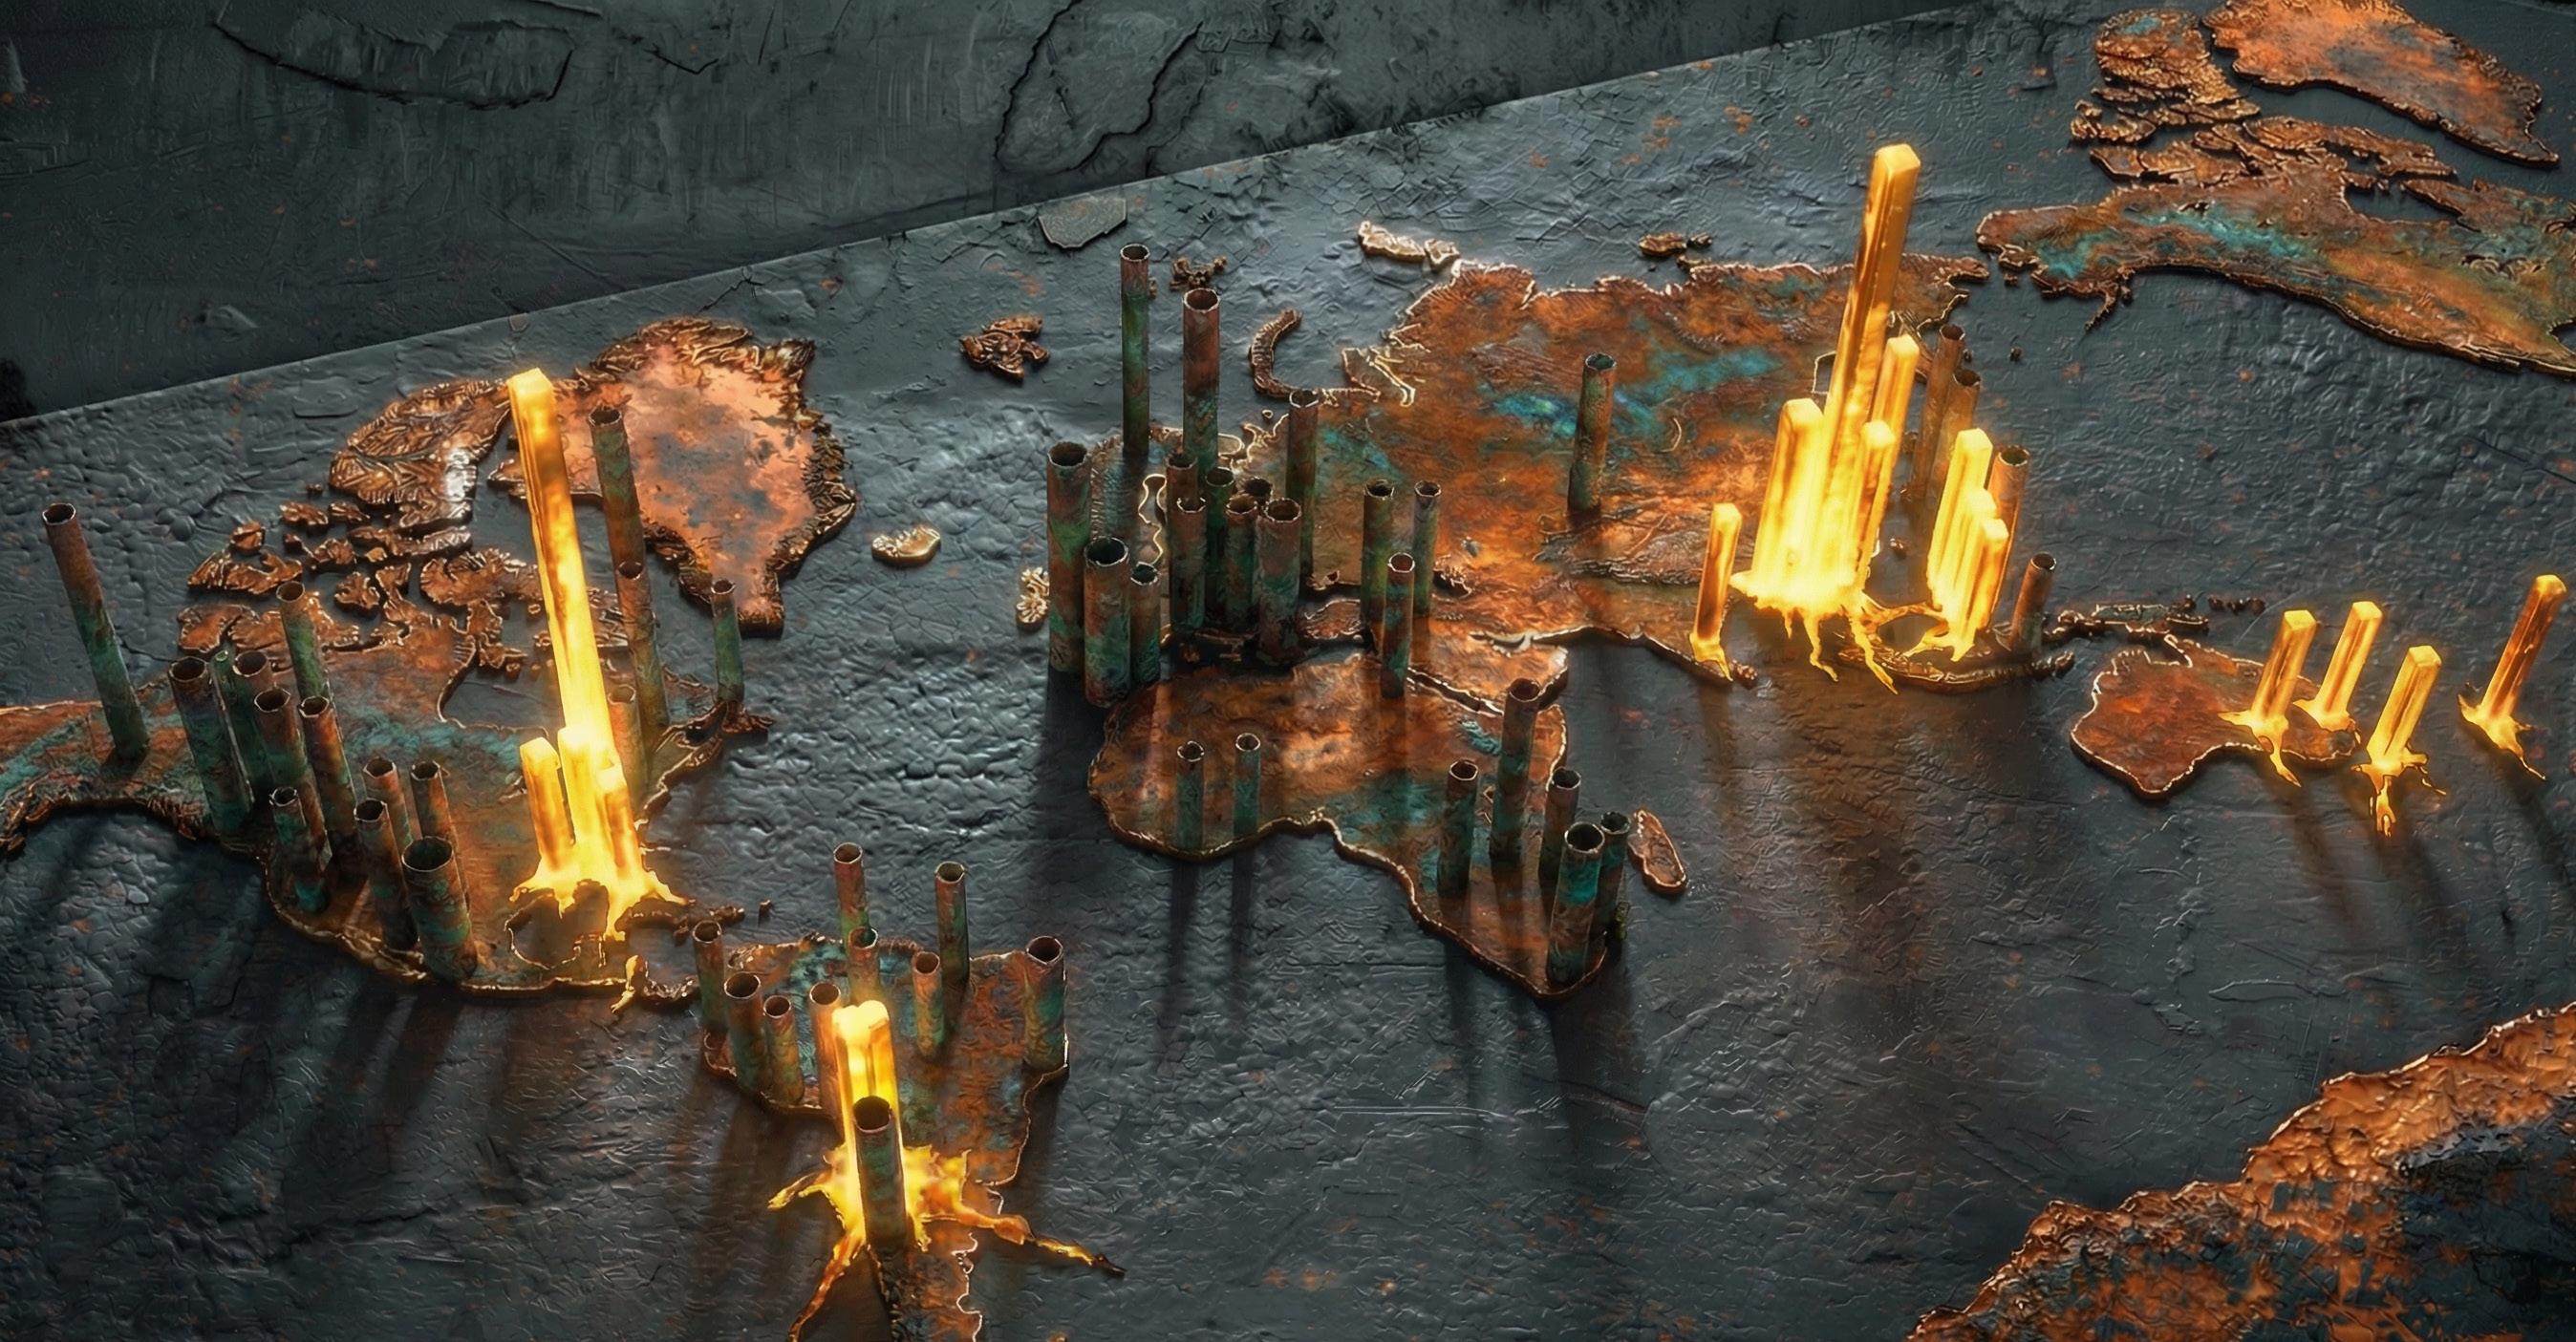
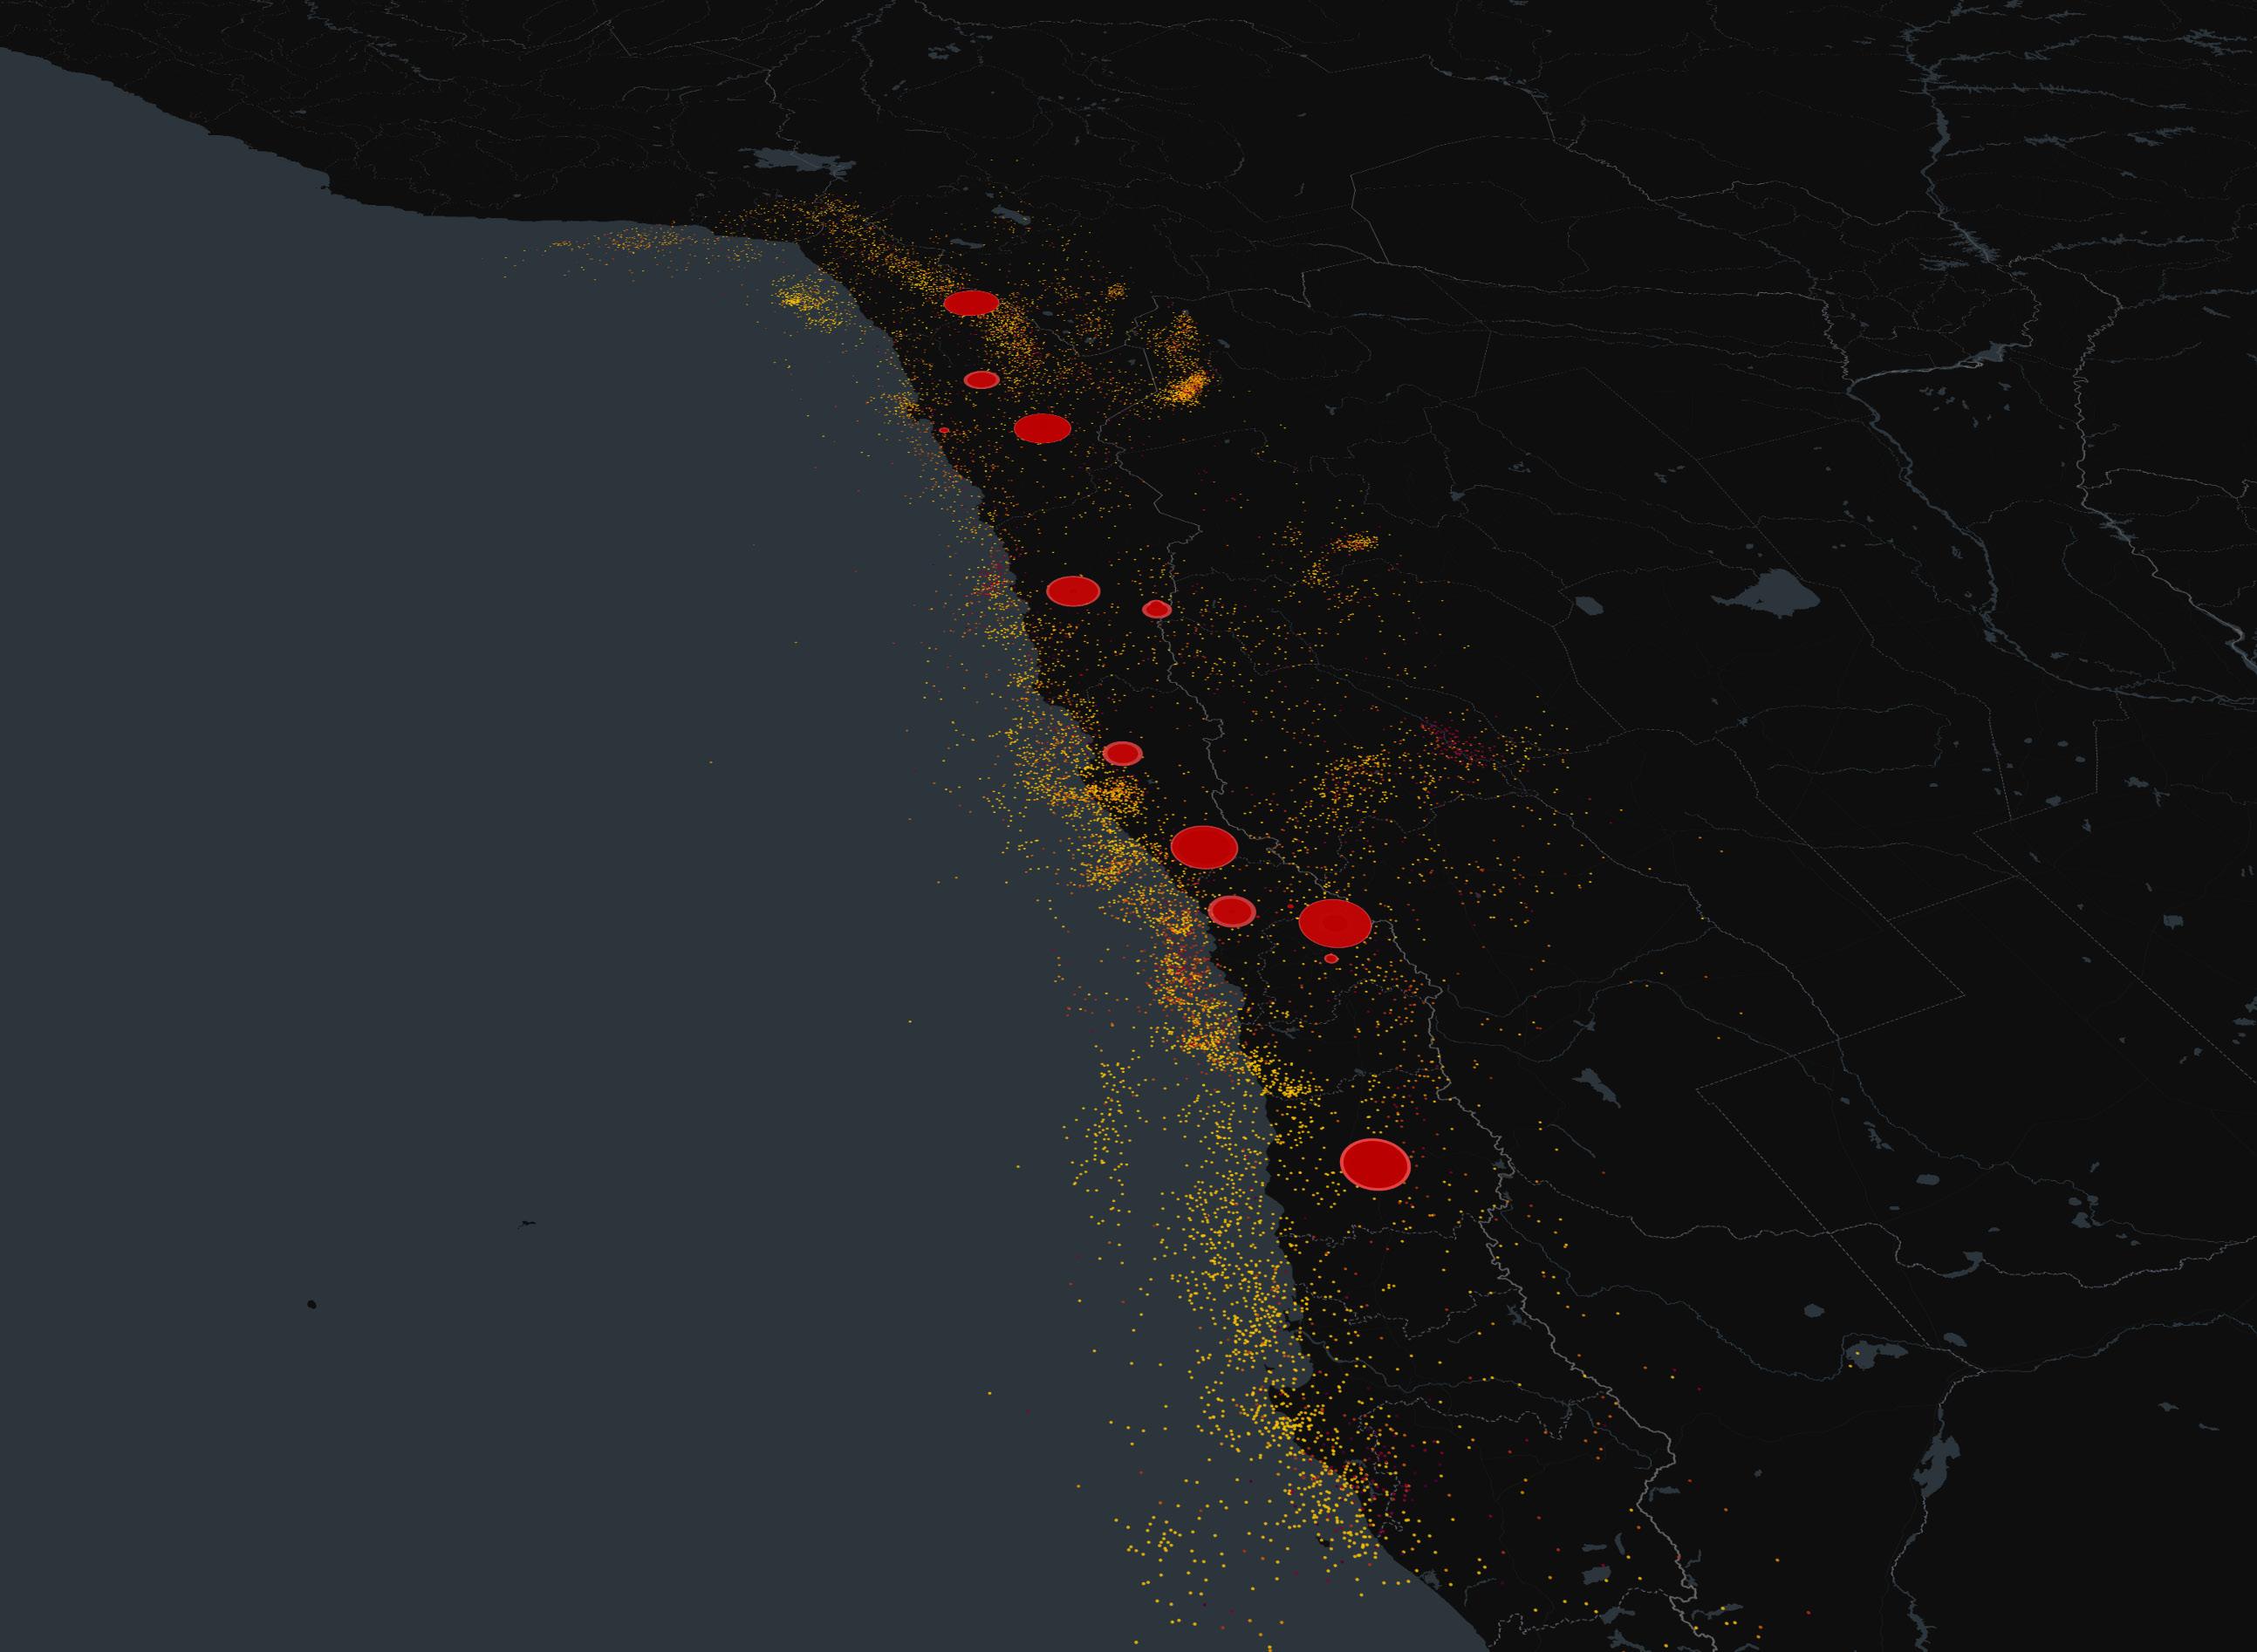
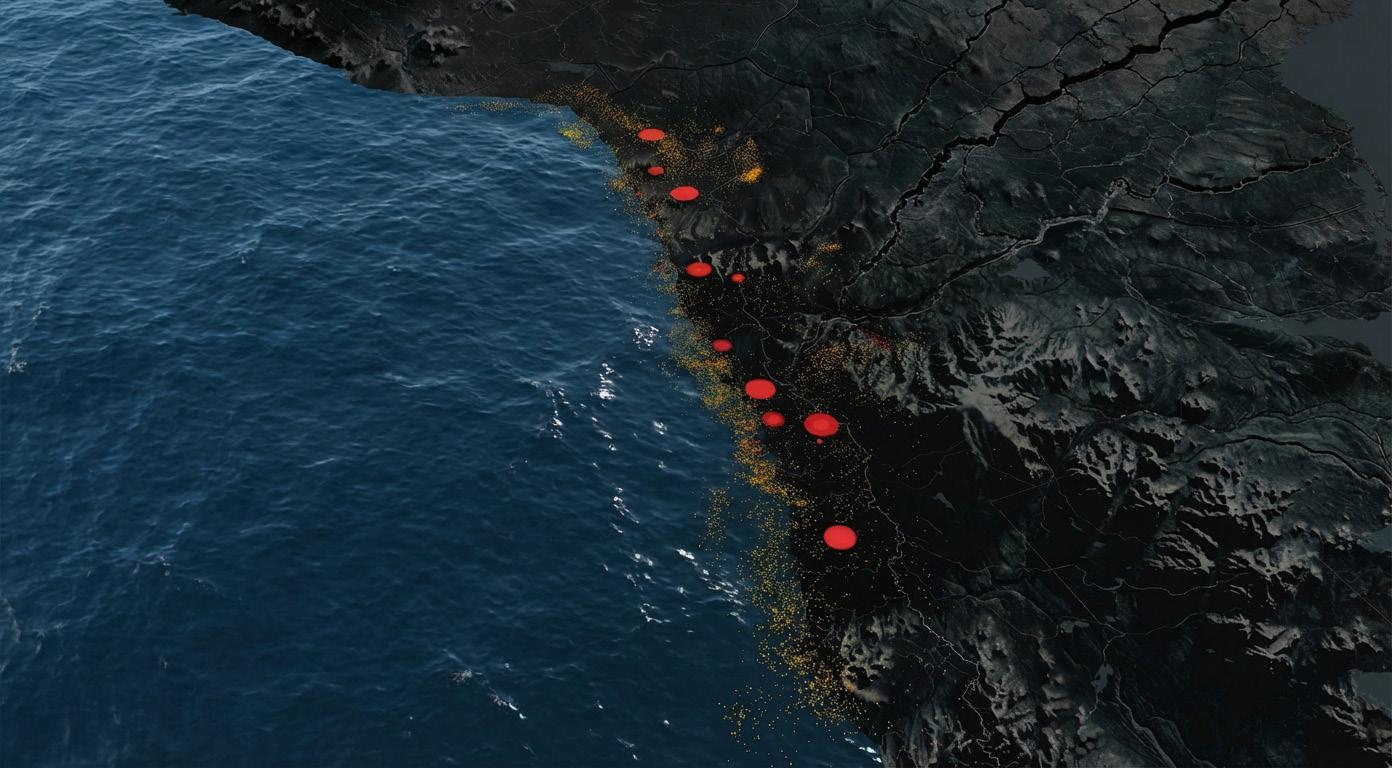
1.Geopolitical Displacement: The map reveals a distinct temporal shift. Prior to 2000, accidents were concentrated in the Global North (Europe/USA). Post-2000, the epicenter of risk has migrated aggressively to the Global South (Latin America & Africa), confirming the hypothesis of "Environmental Arbitrage"—where strict regulations in core nations push high-risk extraction to the periphery.
2.The Scale of Disaster: There is an inverse correlation between ore grades and accident magnitude. As global copper grades decline (approaching 0.6%), the volume of waste required to extract the same amount of metal increases exponentially. Consequently, modern failures in the Global South involve volumes of toxic sludge orders of magnitude larger than historical accidents in the North.
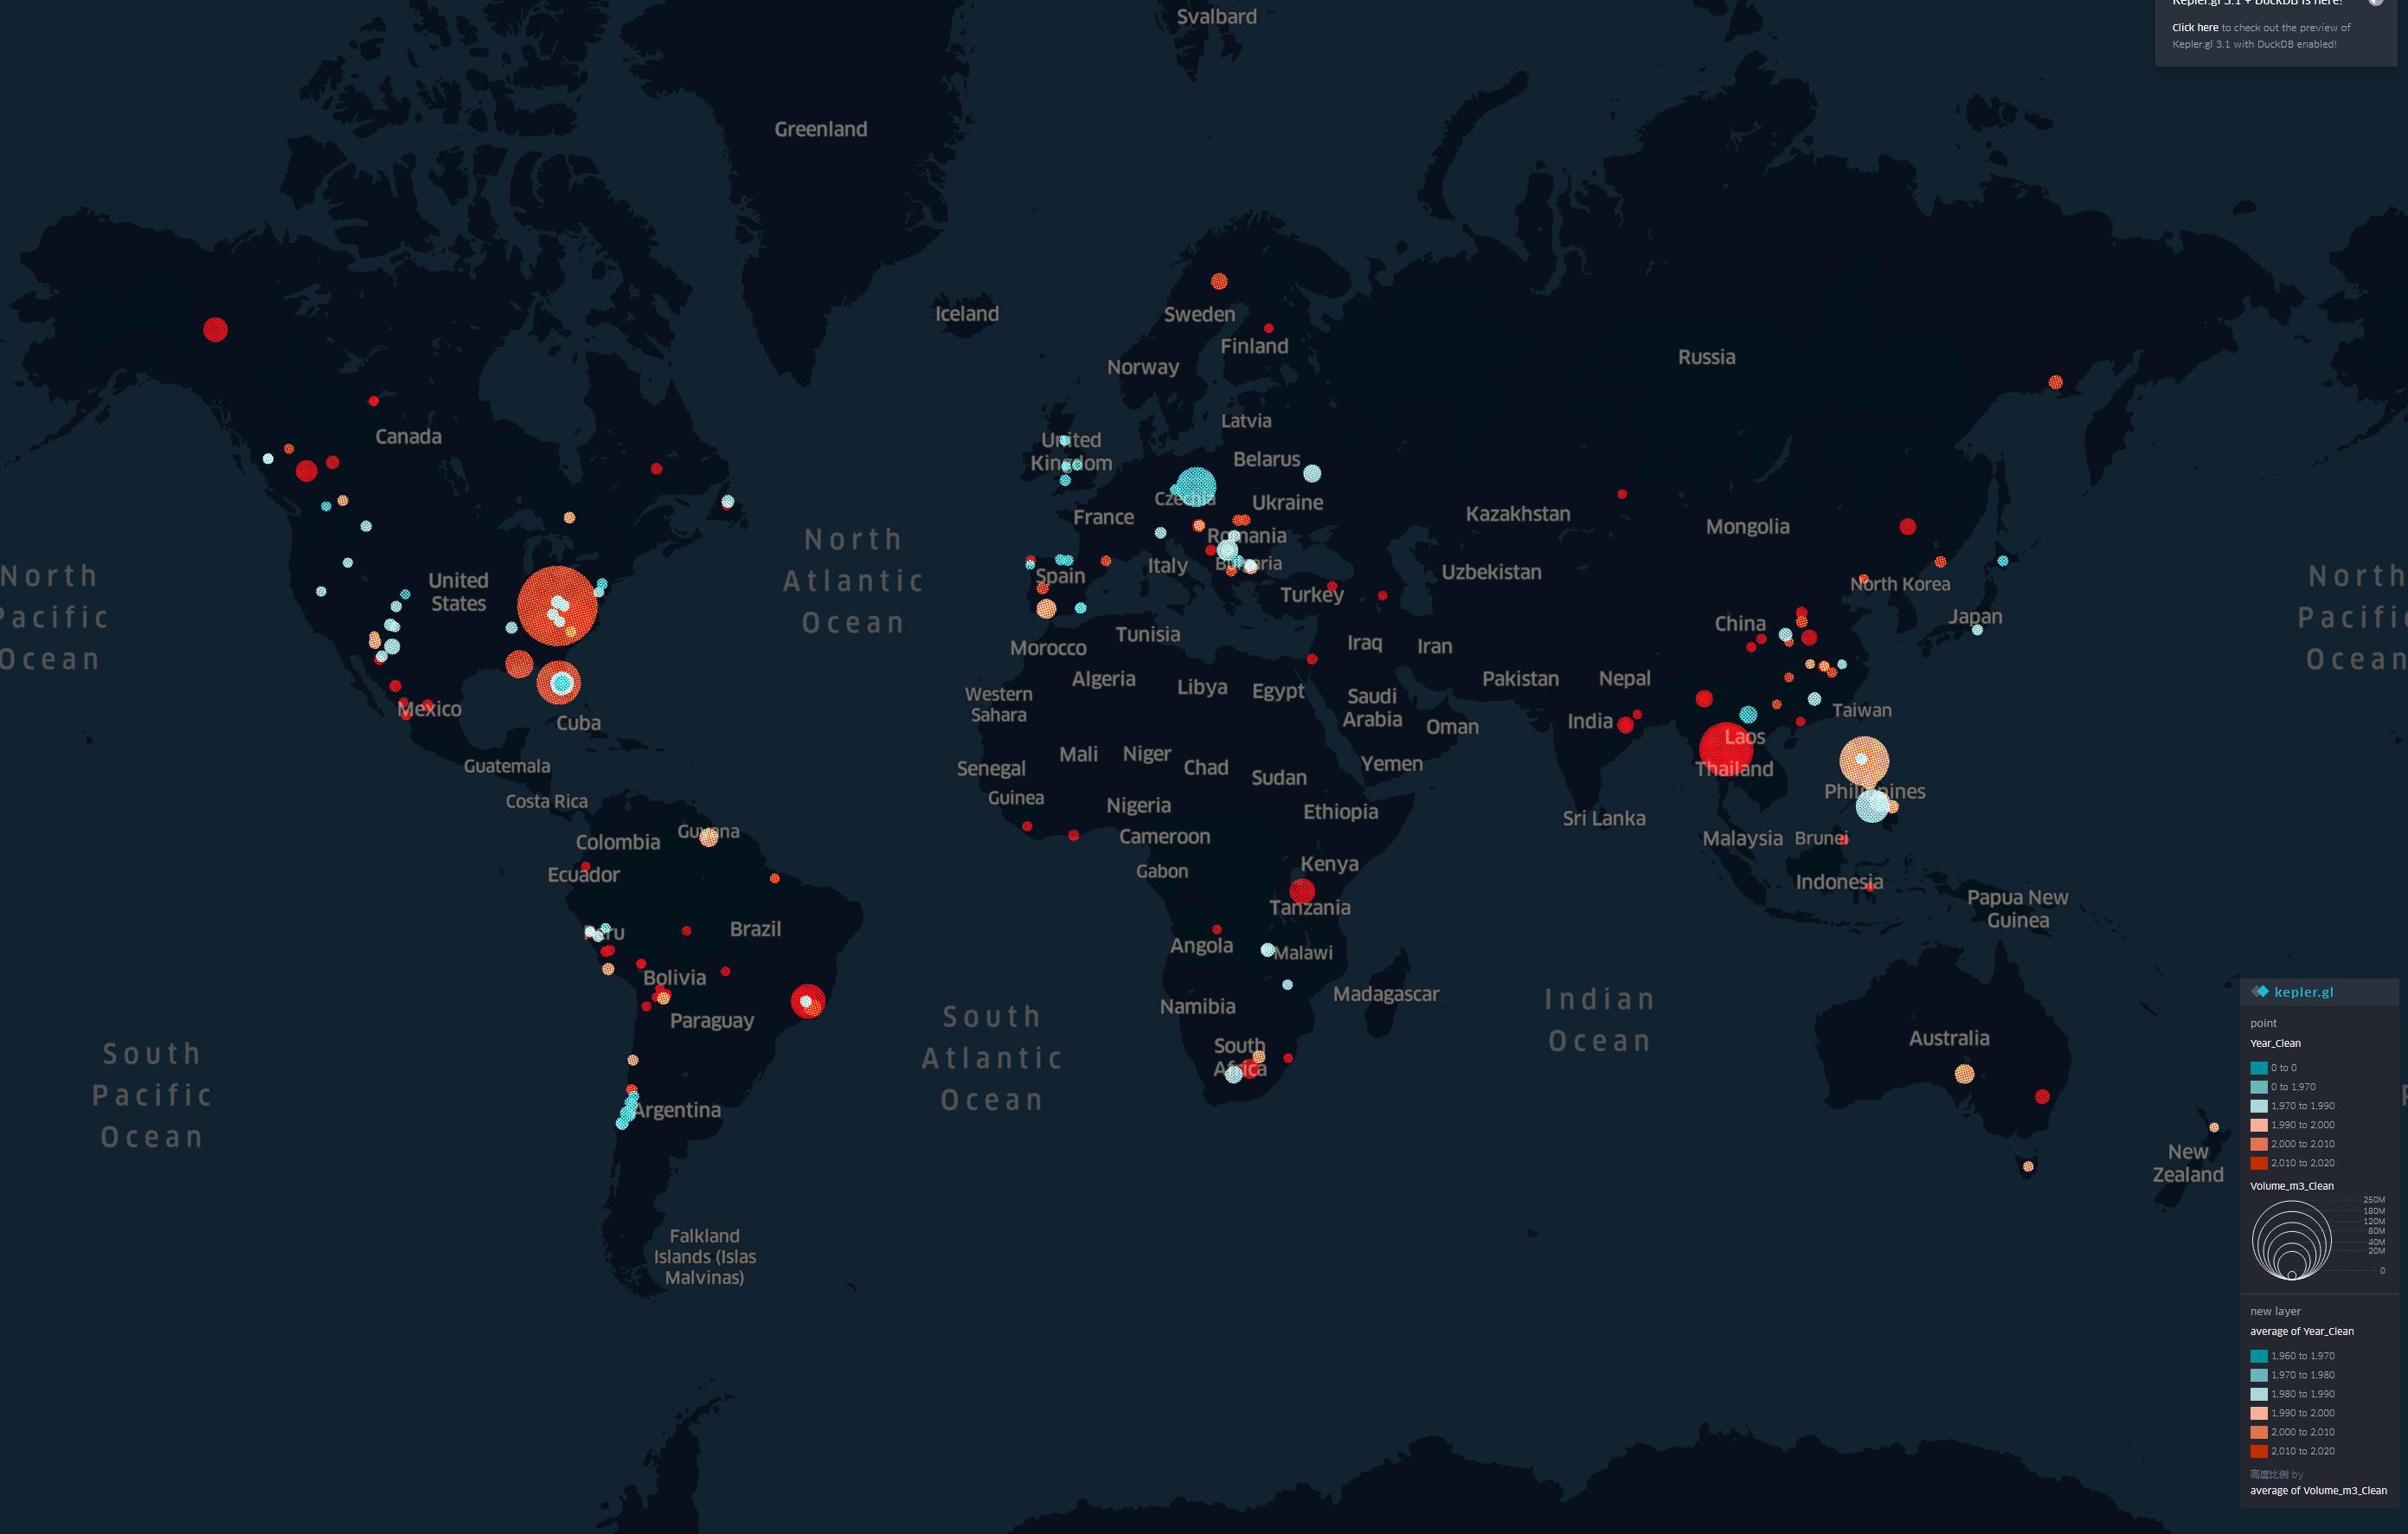
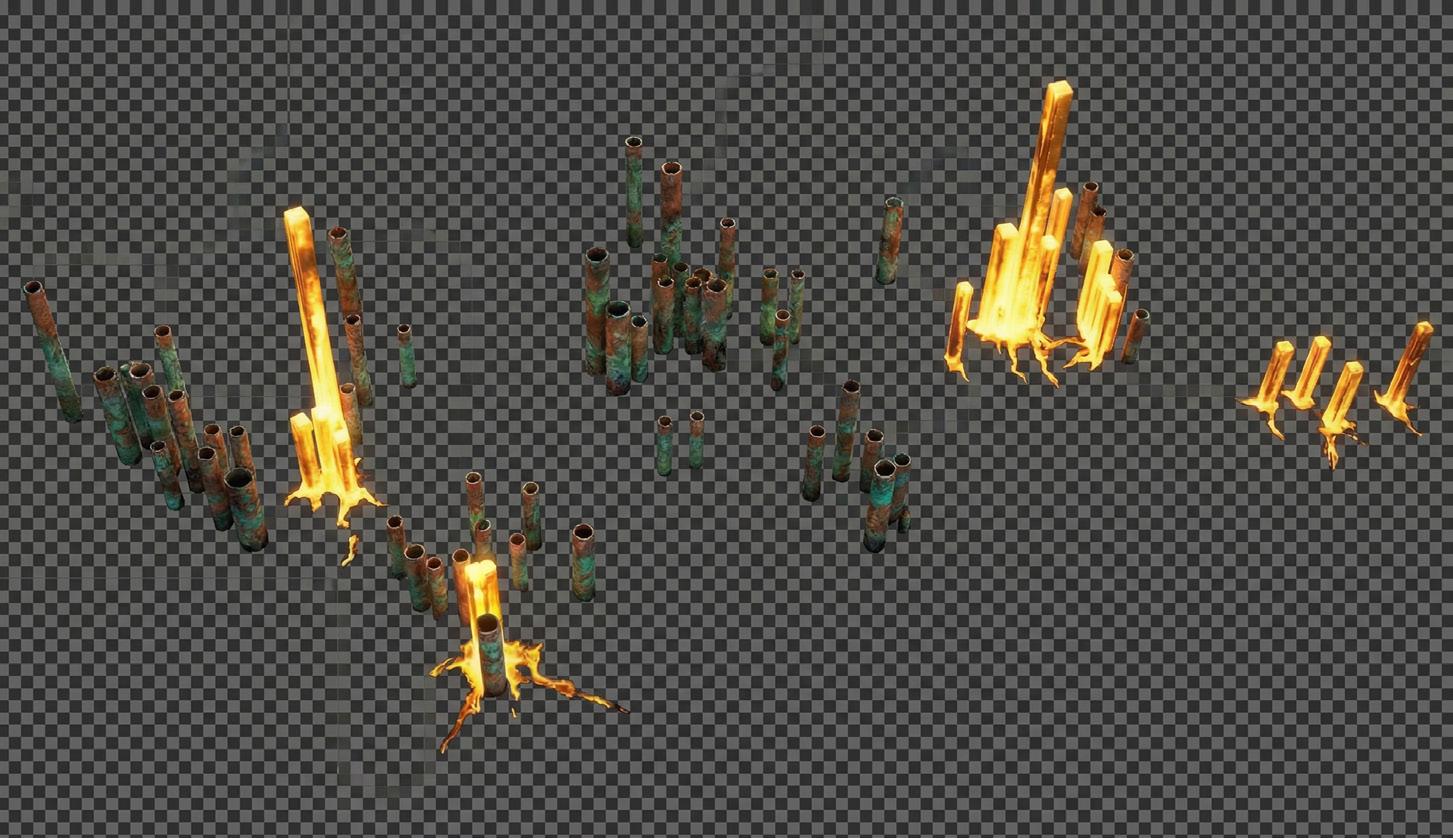
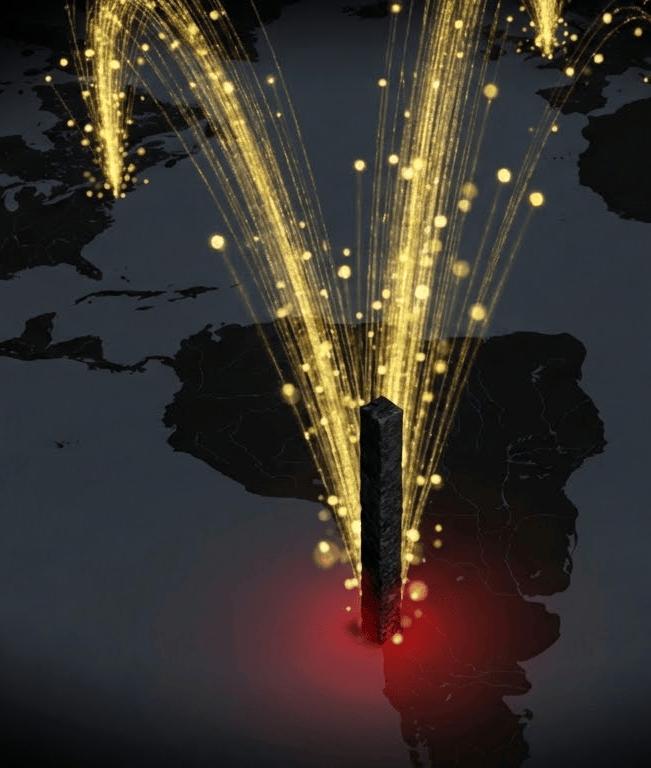
Global Statistics Chart on Tailings Accidents
On this map, the pale blue indicates events from a distant past, while orange and red denote those closer to the present. The size of the circles represents the scale of the incidents. However, it should be noted that the consequences of some incidents have not been statistically
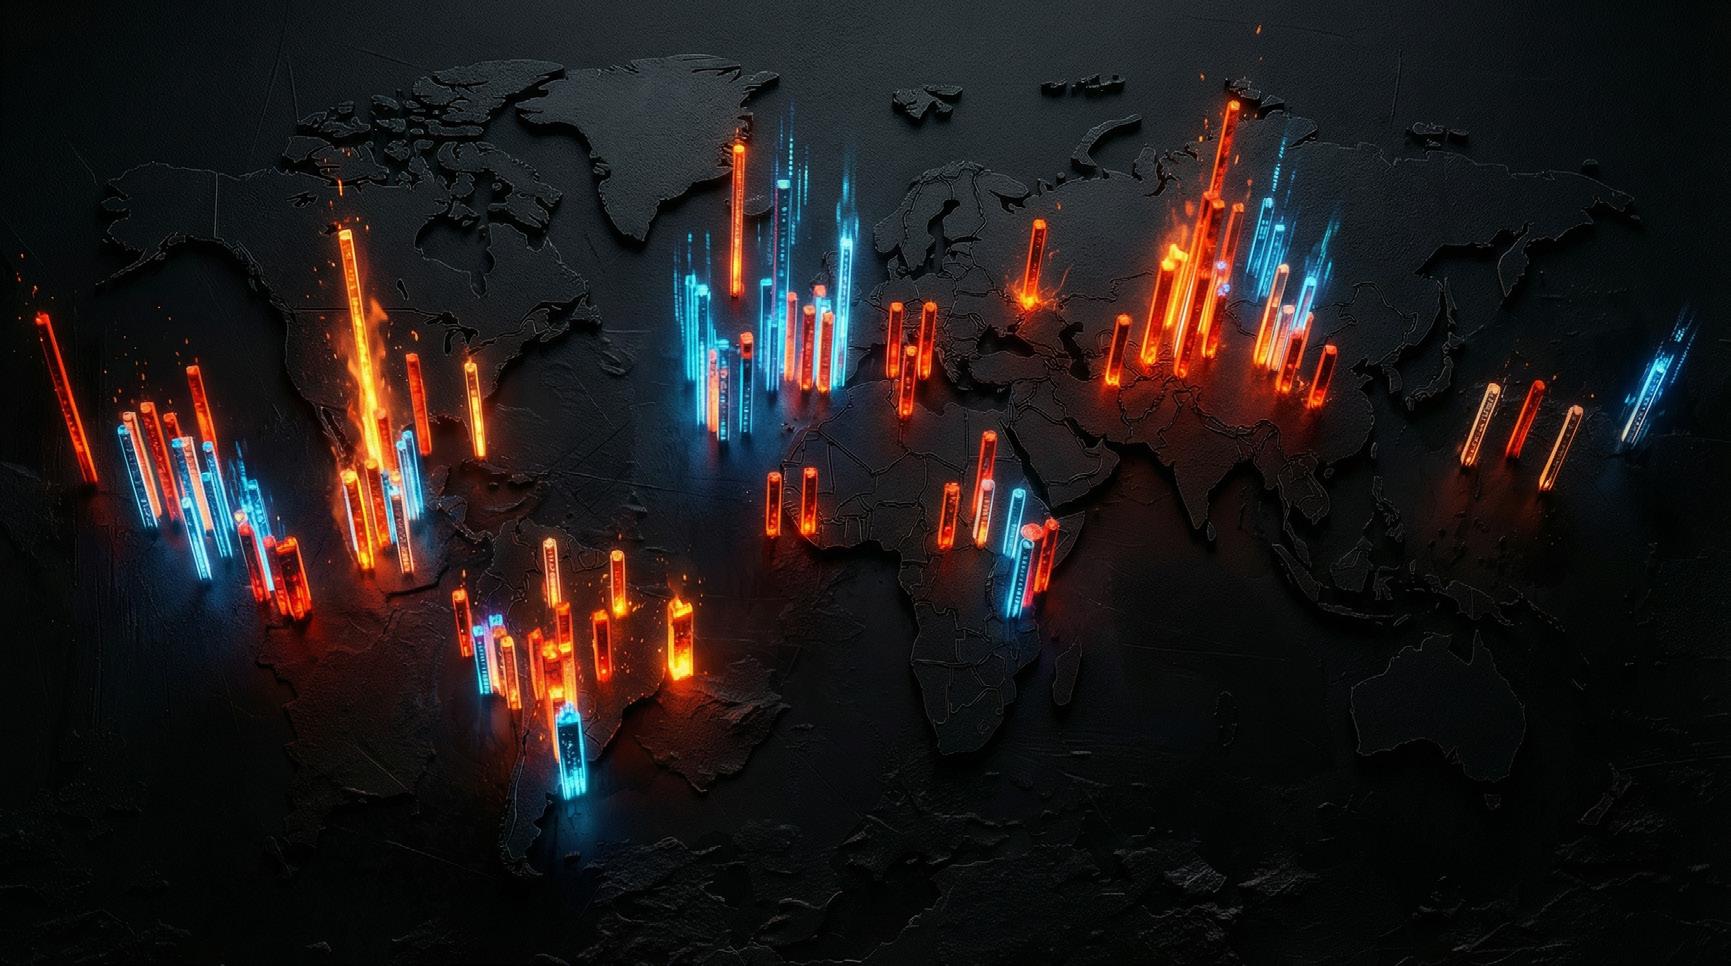
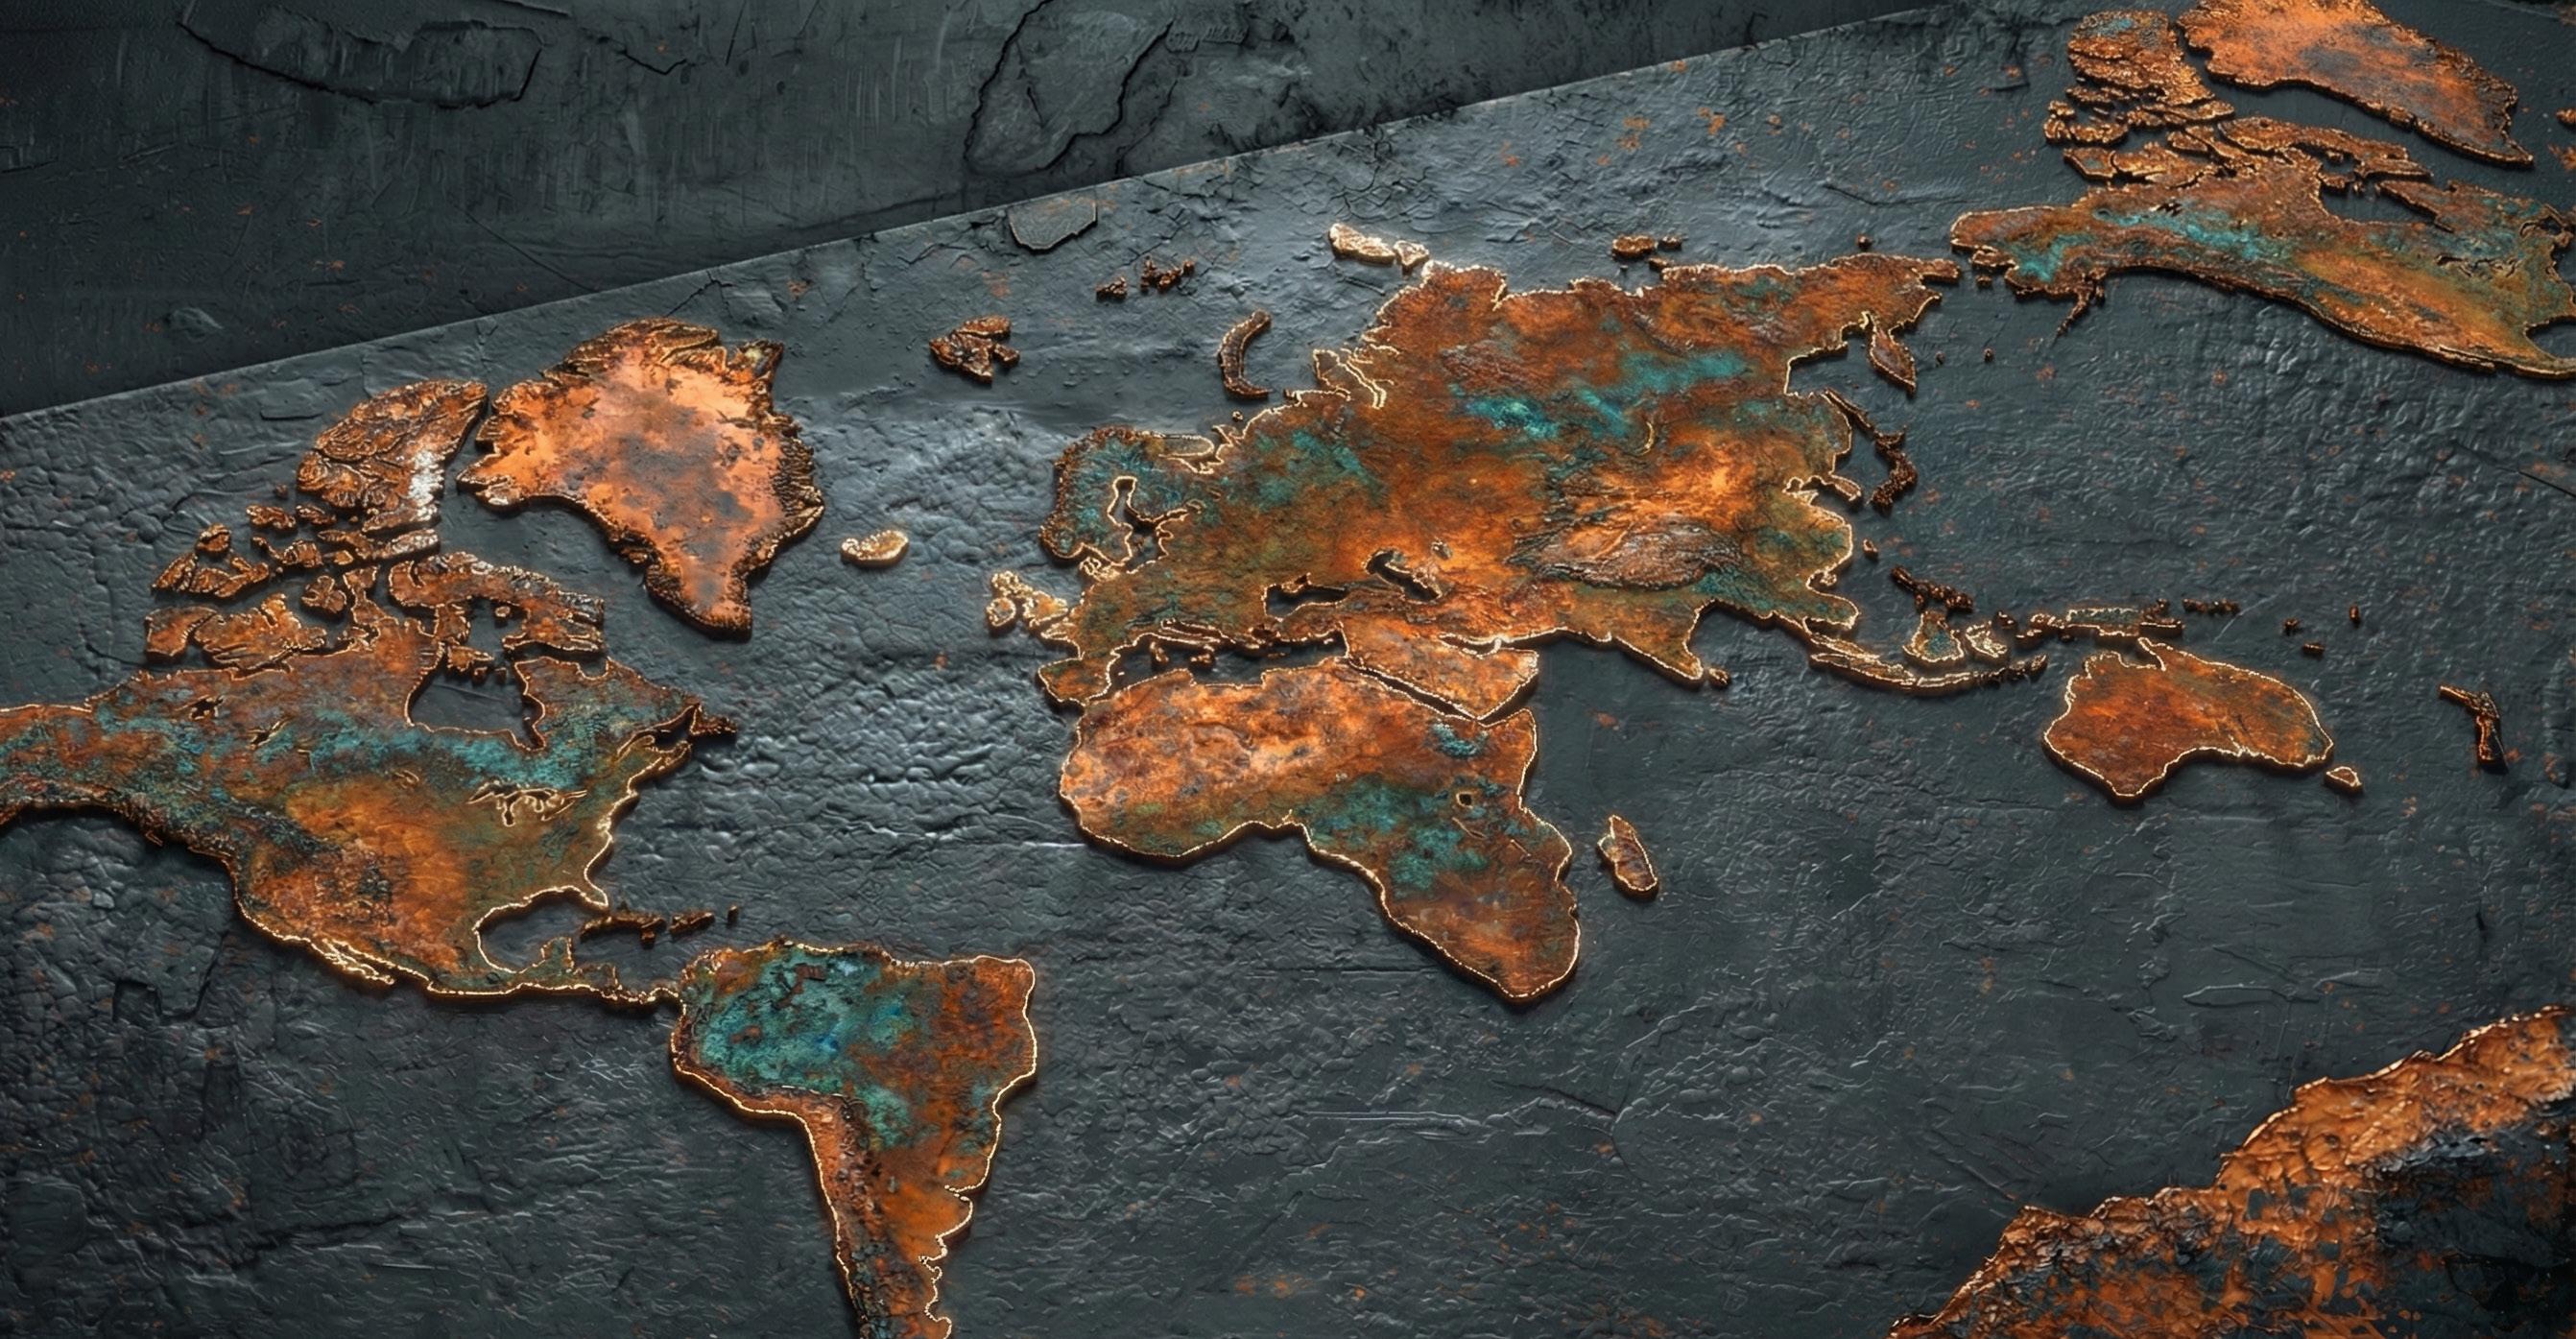
Consequently, I separated the base image into a background layer and column-specific layers, applying distinct style transfers to each before compositing the elements. This approach succeeded.For the column chart, employed cast metal columns to symbolise antiquity, while flaming columns signify more recent periods. The height of each column correlates with the severity of the incident's consequences. As you can see, I ultimately produced this image, which I subsequently imported into AI video software to animate and add sound.