Ioanna Athanasopoulou , Runfeng Yin ,Huilong Hu , Cheng Zhu
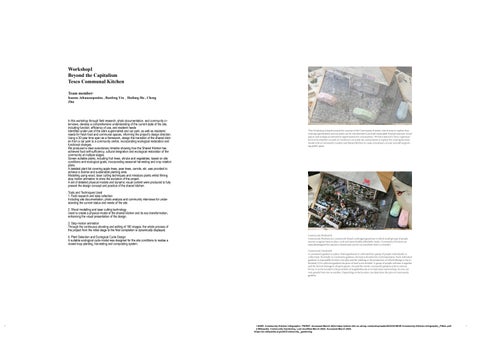
In this workshop through field research, photo documentation, and community interviews, develop a comprehensive understanding of the current state of the site, including function, efficiency of use, and resident needs
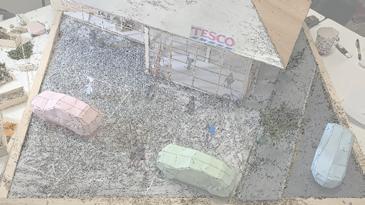
Identified under-use of the site’s supermarket and car park, as well as residents’ needs for fresh food and communal spaces, informing the project’s design direction. Using a 30-year time span as a framework, design the transition of the shared kitchen from a car park to a community centre, incorporating ecological restoration and functional changes.
We produced a clear evolutionary timeline showing how the Shared Kitchen has achieved food self-sufficiency, cultural integration and ecological restoration of the community at multiple stages.
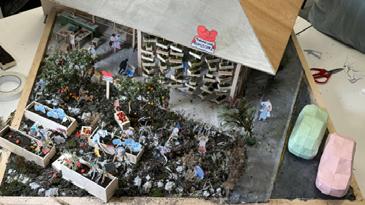
Screen suitable plants, including fruit trees, shrubs and vegetables, based on site conditions and ecological goals, incorporating seasonal harvesting and crop rotation plans.
A detailed plant list covering apple trees, pear trees, carrots, etc. was provided to achieve a diverse and sustainable planting area.
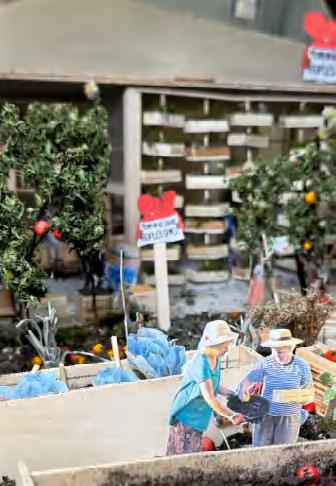
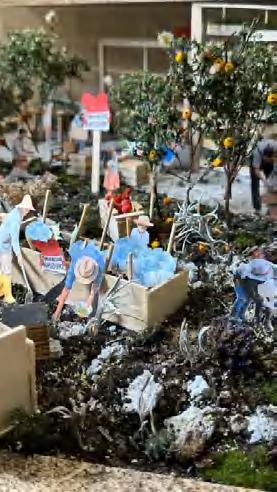
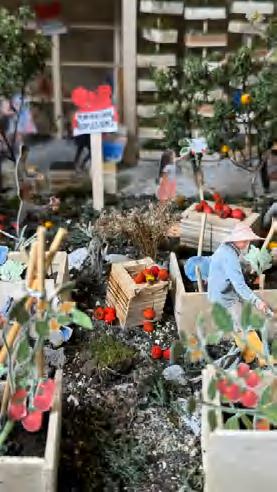
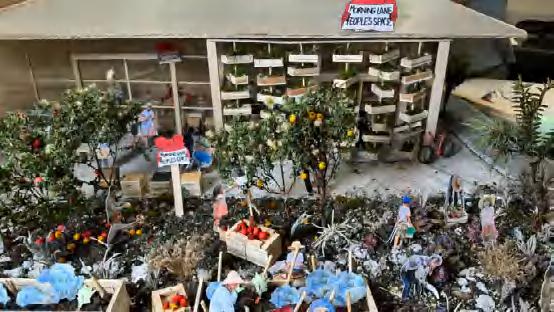
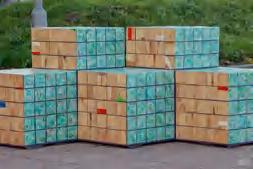
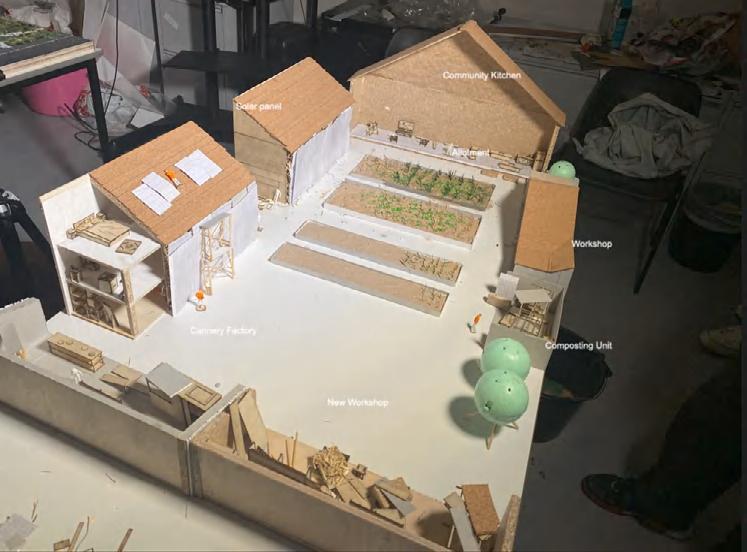
Modelling using wood, laser cutting techniques and miniature plants whilst filming stop motion animation to show the evolution of the project.
A set of detailed physical models and dynamic visual content were produced to fully present the design concept and practice of the shared kitchen.
Tools and Techniques Used
1. Field research and data collection
Including site documentation, photo analysis and community interviews for understanding the current status and needs of the site.
2. Wood modelling and laser cutting technology
Used to create a physical model of the shared kitchen and its eco-transformation, enhancing the visual presentation of the design.
3. Stop-motion animation
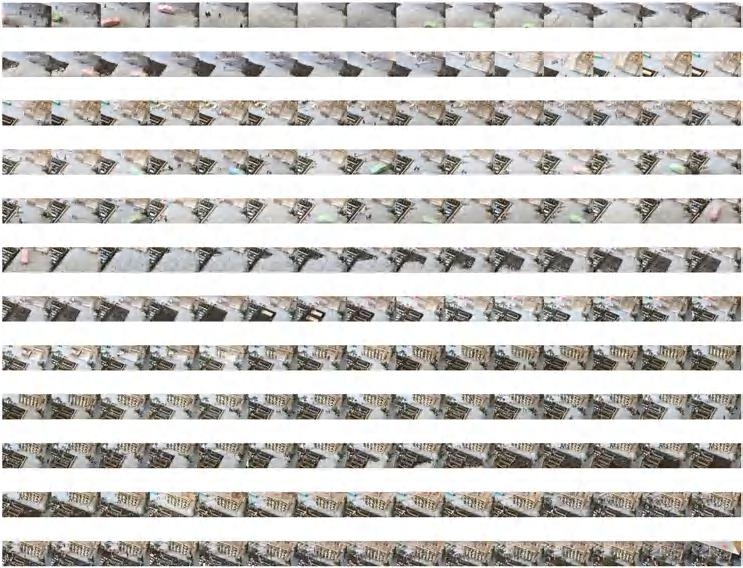
Through the continuous shooting and editing of 180 images, the whole process of the project from the initial stage to the final completion is dynamically displayed.
4. Plant Selection and Ecological Cycle Design
A suitable ecological cycle model was designed for the site conditions to realise a closed-loop planting, harvesting and composting system. This
ensure that the growth changes in the animation are in line with the actual agro-ecological laws.
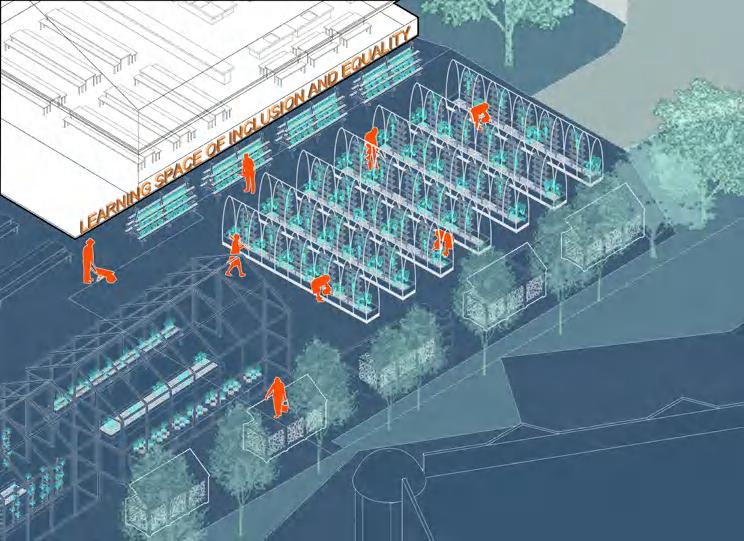
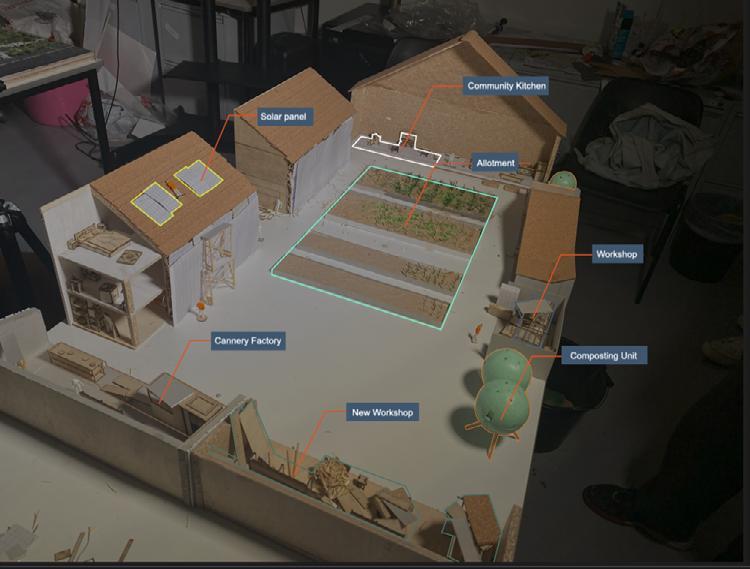
Plant Models Outdoor
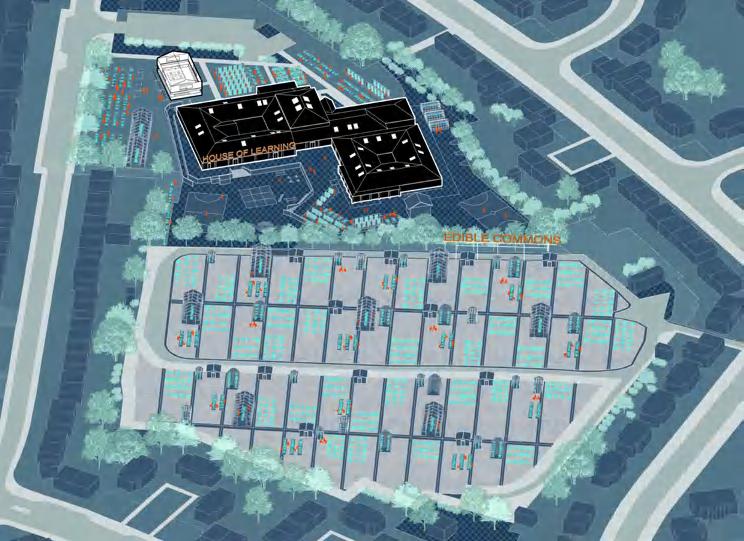
Eventually, it will become a community kitchen and a growing area.
General overview
Made by Runfeng and Ioanna
Workshop2 Tailing dam in Lation America
Team member:
Yuyang Ding , Runfeng Yin
In this workshop, we discovcer the concepts and functions of tailing dams and their potential risks, especially the far-reaching environmental and social impacts of collapse events, were systematically sorted out.
Combined with case studies, such as the Brumadinho disaster in Brazil and the El Soldado mine in Chile, the destructive and typical characteristics of tailings dam collapses were clarified.
Focuses on the threats to local communities from tailings dam collapse, especially the long-term harm to indigenous populations and ecosystems.
Through the collection of data on global tailings dam collapse events, a structured database was created, and the data was cleaned and normalised to ensure the accuracy of the analyses.
Statistical methods were used to mine the data for patterns, leading to the following core conclusions:
There is historical overlap in the locations of high collapses, i.e. areas where collapses have occurred are more likely to be at risk again.
Shift in the centre of gravity of events: most occurred in developed countries prior to 1980, and have since become concentrated in developing countries, reflecting globalisation trends and regulatory differences in mining activities.
Differences in the regional distribution of releases: events with large releases have been concentrated in South America, highlighting the region’s identity as a mineral resource heartland.
Technological tools
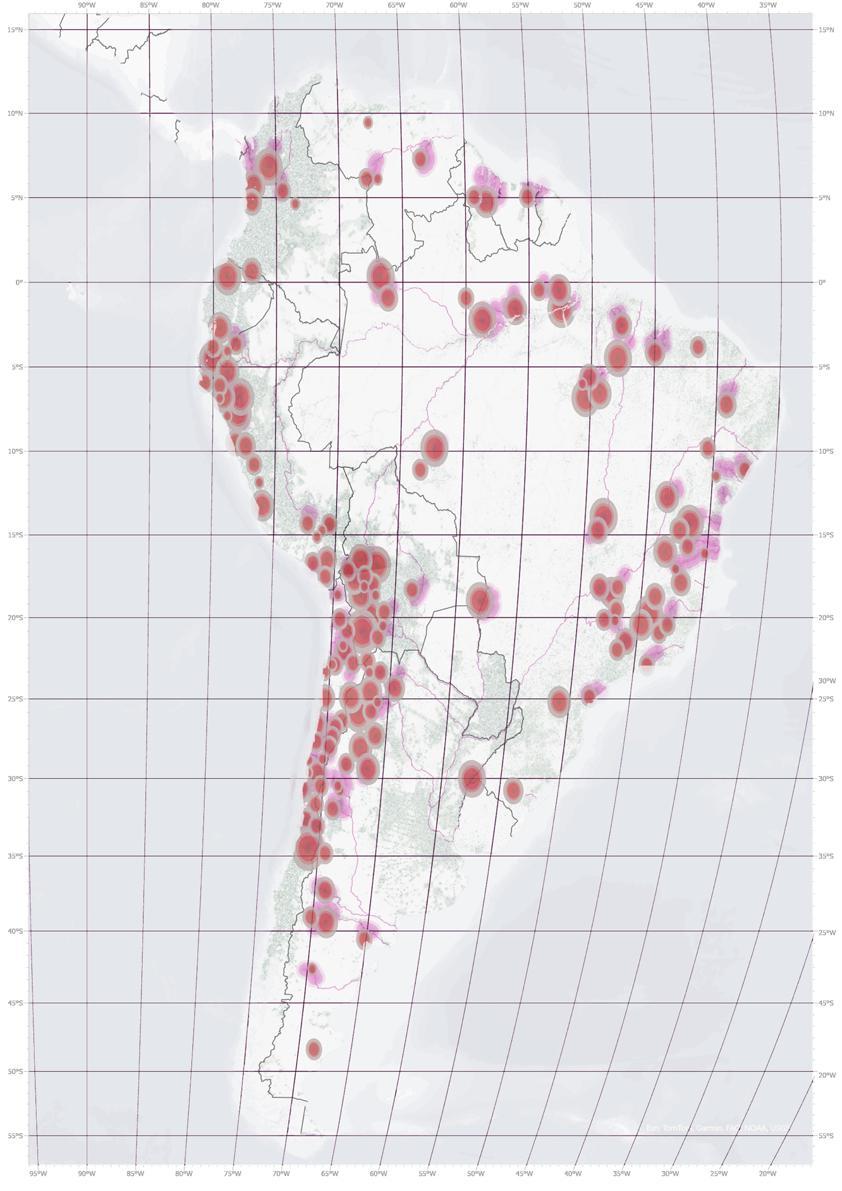
GIS and spatial analysis: The use of GIS satellite maps to annotate the global distribution of tailings dams and their surrounding environmental characteristics clearly presents high-risk areas and the overlap of historical events.
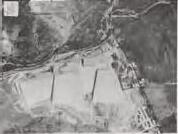
Google Earth: through high-precision geographic image data, it provides finegrained analysis of key mining areas (e.g. El Soldado mine in Chile) and simulates the scope of possible collapse impacts.
Tailings Flow Slide Calculator: Combines geographic and environmental data to simulate the flow path and area of influence of a tailings dam collapse, providing quantitative predictions.
Visualisation tools: Bar charts, heat maps and spatial and temporal distribution maps are produced to clearly demonstrate the global and regional characteristics of tailings dam events.
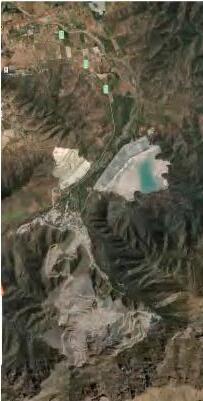
Tailings dams in South America and potentially radioactive areas
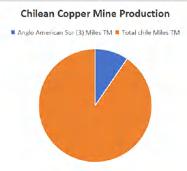
Chile was responsible for 24% of the world’s copper production in 2022, and its main export markets include China, Japan, South Korea, and Europe. Total copper exports reached approximately 22.8 billion USD. Given the World Bank’s October 2022 copper price of 8,370 USD per ton, the total economic value of Chile’s exports in copper reaches around 100.47 billion USD.
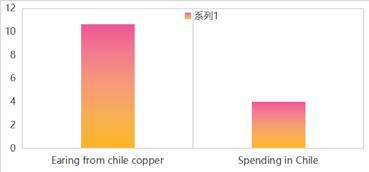
Data from Cochilco indicates that Anglo American’s share of production in Chile represents 10.6% of the national output. This translates to: 100.47 billion USD×0.106=10.65 billion USD
According to Anglo American’s 2022 annual report, the company contributed approximately 4.365 billion USD in taxes and economic contributions to Chile, equating to only 37.84% of their earnings staying in the local economy. This substantial percentage loss demonstrates how local copper resources primarily benefit international markets rather than local communities .This data shows that the majority of Chile’s copper resource revenues are captured by foreign companies, supporting Chile’s role as a supplier of raw materials in the international capital chain.
3841-21714 copper shipping route
22590-54321
54632-87564
98234-156453
203769-8212792
South America: Hypothetical Impact of Tailings Dam Failure
Given South America’s high release volumes, we modeled the potential impact of a hypothetical dam collapse:
A single failure could contaminate an area equivalent to 0.3% of the continent, roughly the size of the UK. The environmental and social costs would devastate local ecosystems and communities reliant on agriculture and clean water.
Workshop3 AI using and analysising in LFA
Team member:
Yuxiang Huang , Runfeng Yin , Chongpu Liu
In this workshop, we focused on exploring the use of Artificial Intelligence (AI) tools in design and data analysis, and through a series of practice and tool use, we achieved several learning objectives and gained insights and experiences. Below is a summary of this learning: Learning Objectives and Outcomes
Explore the application of AI in image analysis
Learn how to let AI understand and describe the exhibit images through human-computer dialogue, so as to extract key information (keywords).
Outcome: AI-assisted keyword generation was achieved, laying the foundation for subsequent data analysis and visualisation.
Data processing and visualisation using code
Learning and using Python to write programs to generate word clouds through keyword relevance analysis, visually displaying the weight and relevance of different keywords.
Results: The word cloud clearly shows the frequency and relevance of the keywords of the pictures, which provides the basis for the trend analysis of the project.
New possibilities for AI-generated design
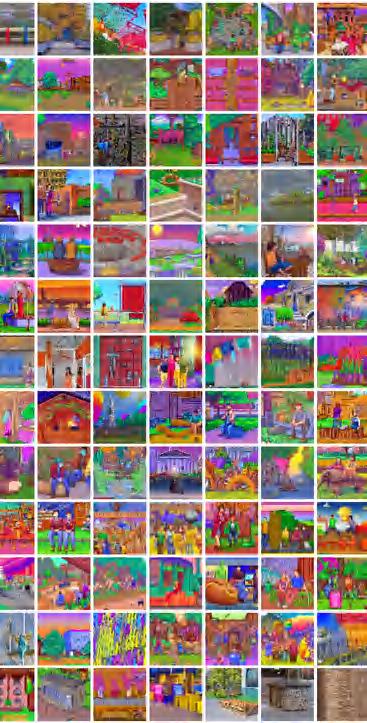
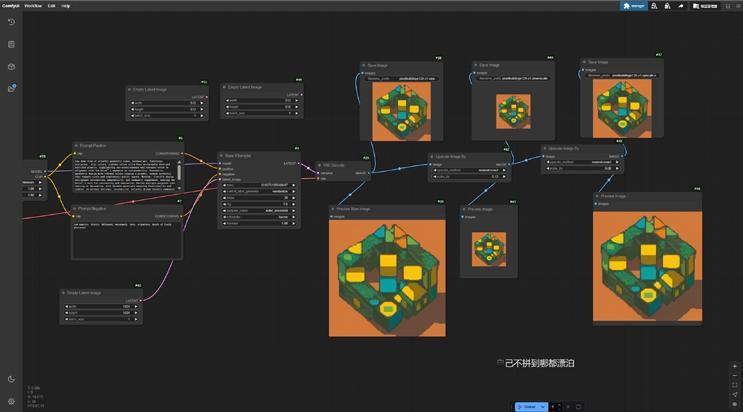
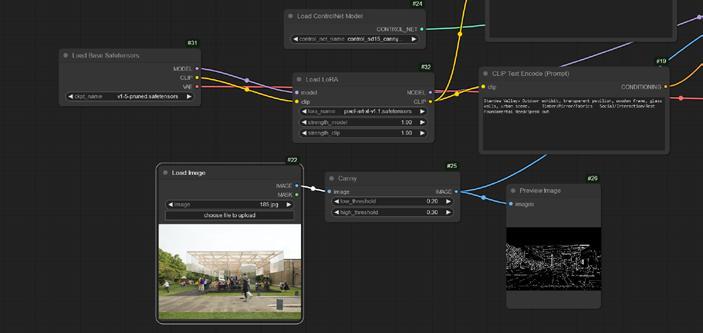
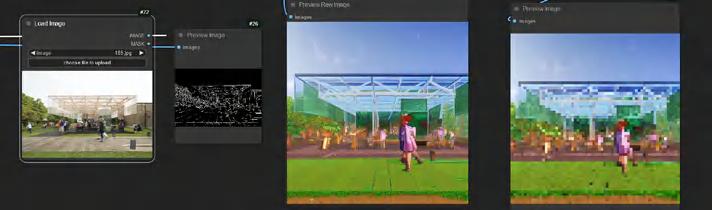
Using AI tools (e.g. Comfy UI) for regeneration design, new exhibit designs were created by combining the line drawings of the original images with the AI-generated keyword descriptions.
Results: demonstrated the potential of AI in creative design, suggesting new interpretations and optimisations of the original exhibits.
Validation of AI against human understanding
The performance and limitations of AI in art emotion recognition were analysed by simulating the emotions of pictures through emotion analysis tools and comparing them with human emotion judgments.
RESULTS: Similarities and deviations between AI and human perception were found, providing a basis for further optimising AI’s emotion recognition capabilities.
Tools and Techniques Used
Python.
Data processing and visualisation tool applied to keyword extraction, correlation analysis and word cloud generation.
ChatGPT
Image description and keyword extraction through human-computer dialogue, providing efficient assistance for understanding images.
Comfy UI
AI image generation tool that explores the possibility of exhibit regeneration by combining descriptions
AI re-generation of exhibits
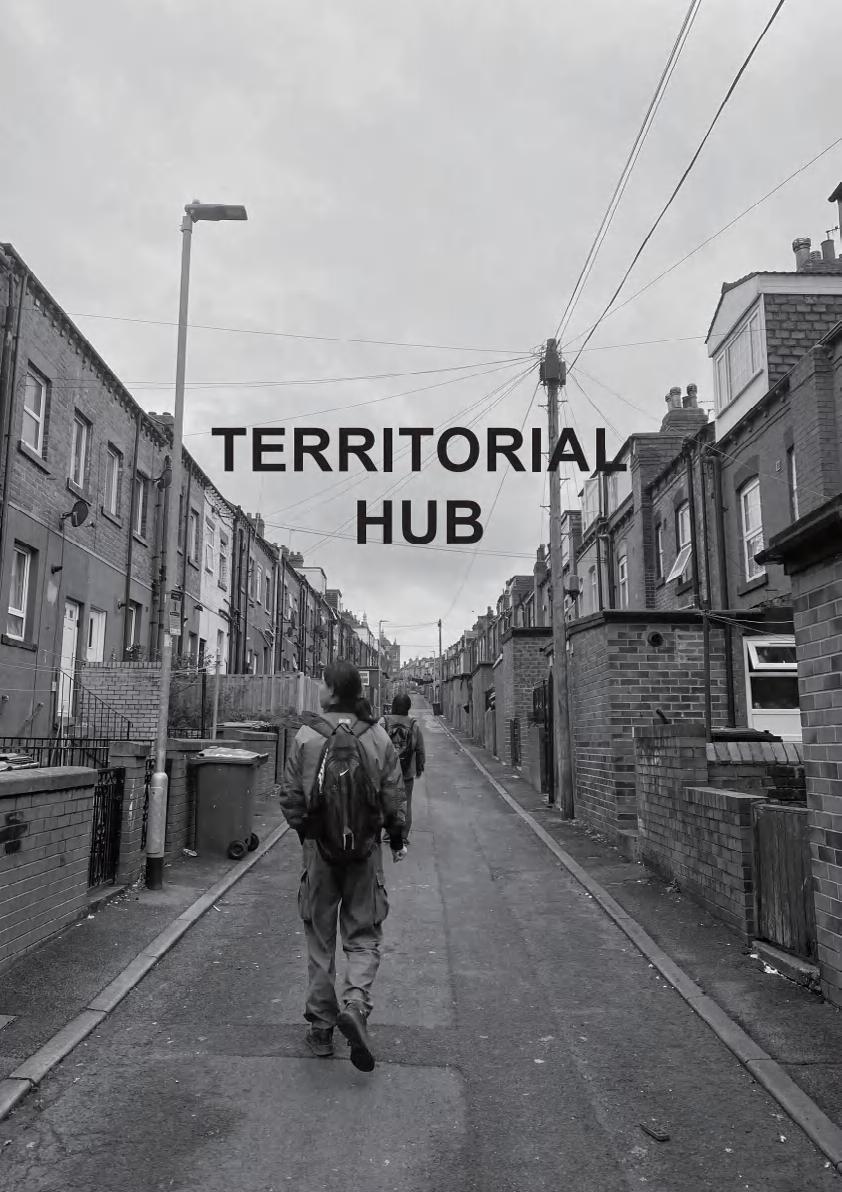
Graduation Project
Territorial Hubs for Retrofit Sovereignty: Regenerative Community Ecosystems Linking Housing, Food, and Energy Team member:
Yuyang Ding,Deming Liu, Runfeng Yin
This project focuses on the Bayswater community in Leeds, UK, using social housing retrofitting as a catalyst for community regeneration. Within the framework of the UK’s Net Zero policy, the initiative builds on existing schemes such as the Local Area Delivery (LAD) fund, Leeds’ Priority Neighbourhood programs, and lessons from the Holbeck retrofit. The aim is not only to upgrade housing energy performance but also to establish localized, regenerative systems that foster participation, local employment, and resilience. By moving from outsourced retrofits to community-led approaches, residents gain agency in shaping their environment, while policy memos supplement existing frameworks and inform wider application.
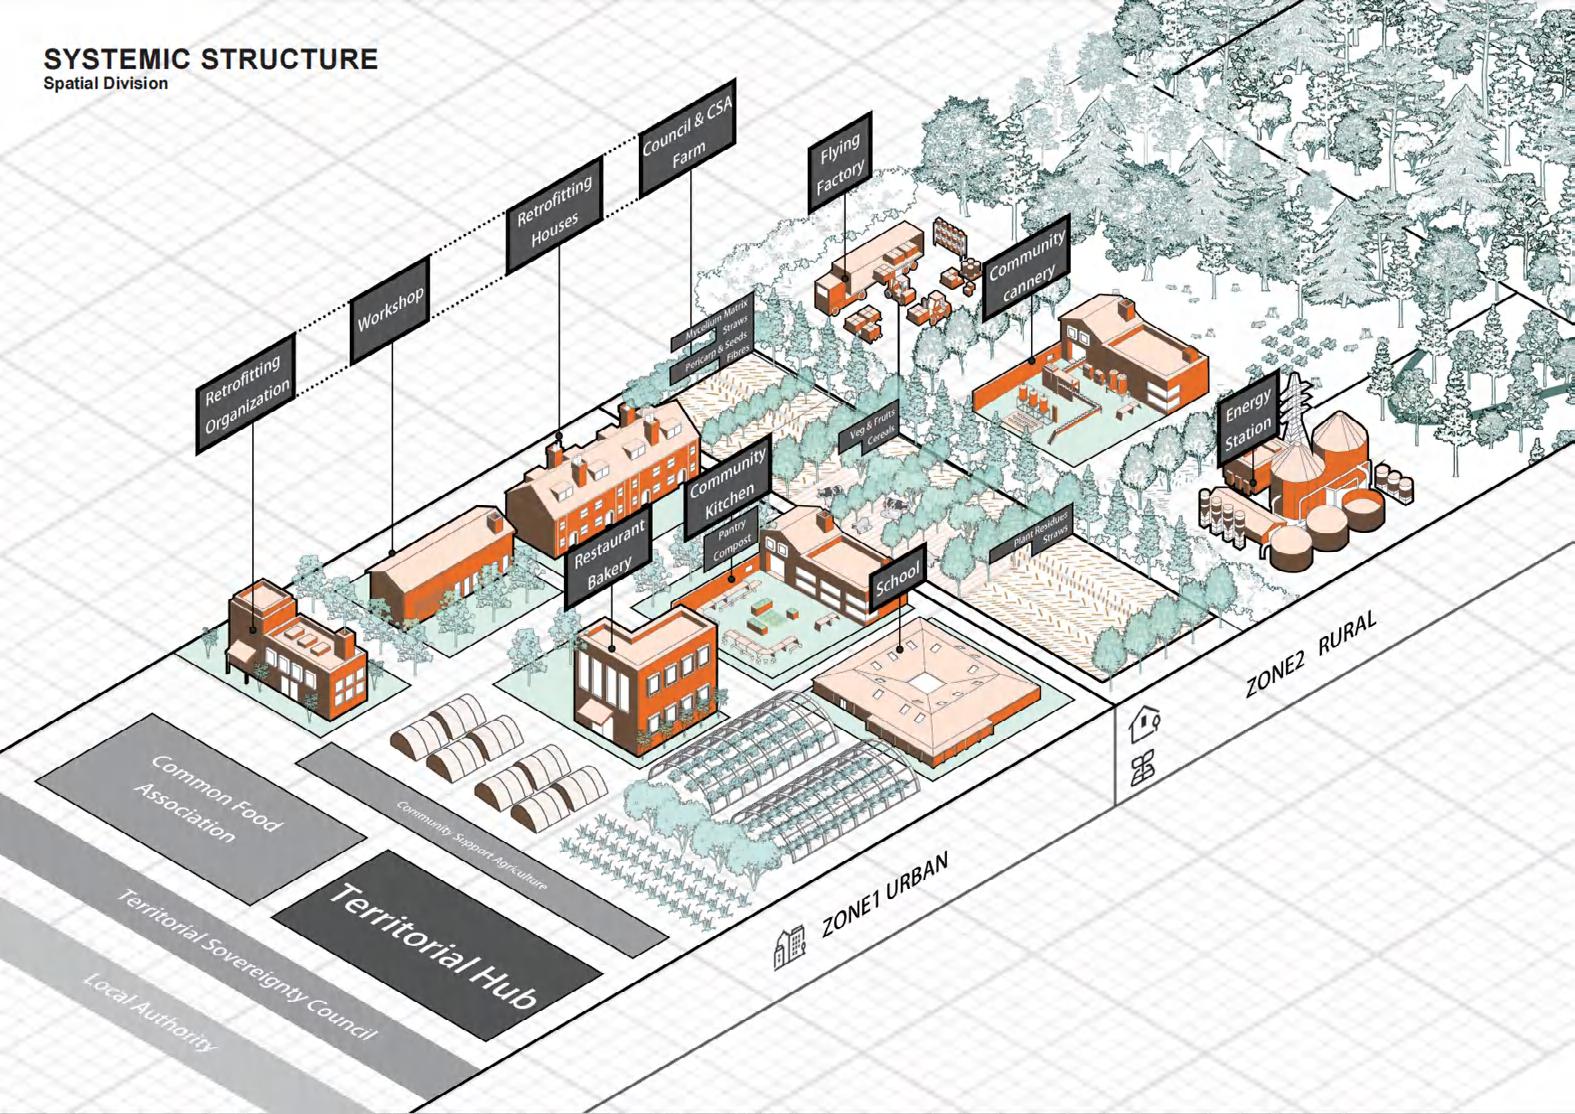
Territorial Hub are regenerative community ecosystems that link urban and rural areas. Through this model, we propose regional supply chains to integrate the production and distribution of food, materials and energy for social housing retrofitting and local community. We want to create a localized, self-governed, socio-ecological infrastructure for the community. The system incorporates housing association, workshops, cafés, council&CSA farms, community kitchens, schools and so on. Retrofit interventions prioritize locally sourced, bio-based insulation; community kitchens partner with schools to improve food education; and workshops provide both jobs and retrofit training, building technical capacity and social cohesion. Energy systems include rooftop solar panels and anaerobic digestion of kitchen waste, advancing circular resource flows. The model also addresses food and fuel poverty by linking neighbourhoods to wider rural ecosystems. Centering housing and food systems together, it challenges the urban–rural divide and advocates a transition to agroecological food networks under the principle of “retrofit sovereignty.” Bayswater is envisioned as a prototype within a 50-kilometer radius, integrating agriculture, social housing, and public enterprises. This includes new infrastructures such as retrofit hubs, land-based community kitchens, food hubs, community-supported agriculture, productive housing estates, composting centers, and agroforestry-based transitions. Advanced mapping tools are used to spatialize enterprises across this territory, embedding food and retrofit infrastructures as shared socio-ecological assets.
The project builds on AALU’s prior research, including “Living Retrofitting Urbanism” and the recent “Biobased Retrofitting: Cultivating Commons and Market Garden Renaissance” . It also draws from precedents such as the Wolves Lane Food Hub in London, Atelier Groot-Eiland in Brussels, and Agroecological Urbanism principles. Together, these models demonstrate how “community sovereignty” can be spatially and institutionally realized. By embedding participatory governance, ecological stewardship, and circular economic systems, the Territorial Hub offers a replicable, low-carbon, socially inclusive framework for sustainable housing retrofit. In this vision, social housing becomes not only a site of technical upgrade but the foundation for regenerative community ecosystems that link urban and rural resources, overcome fuel and food poverty, and cultivate resilient futures.
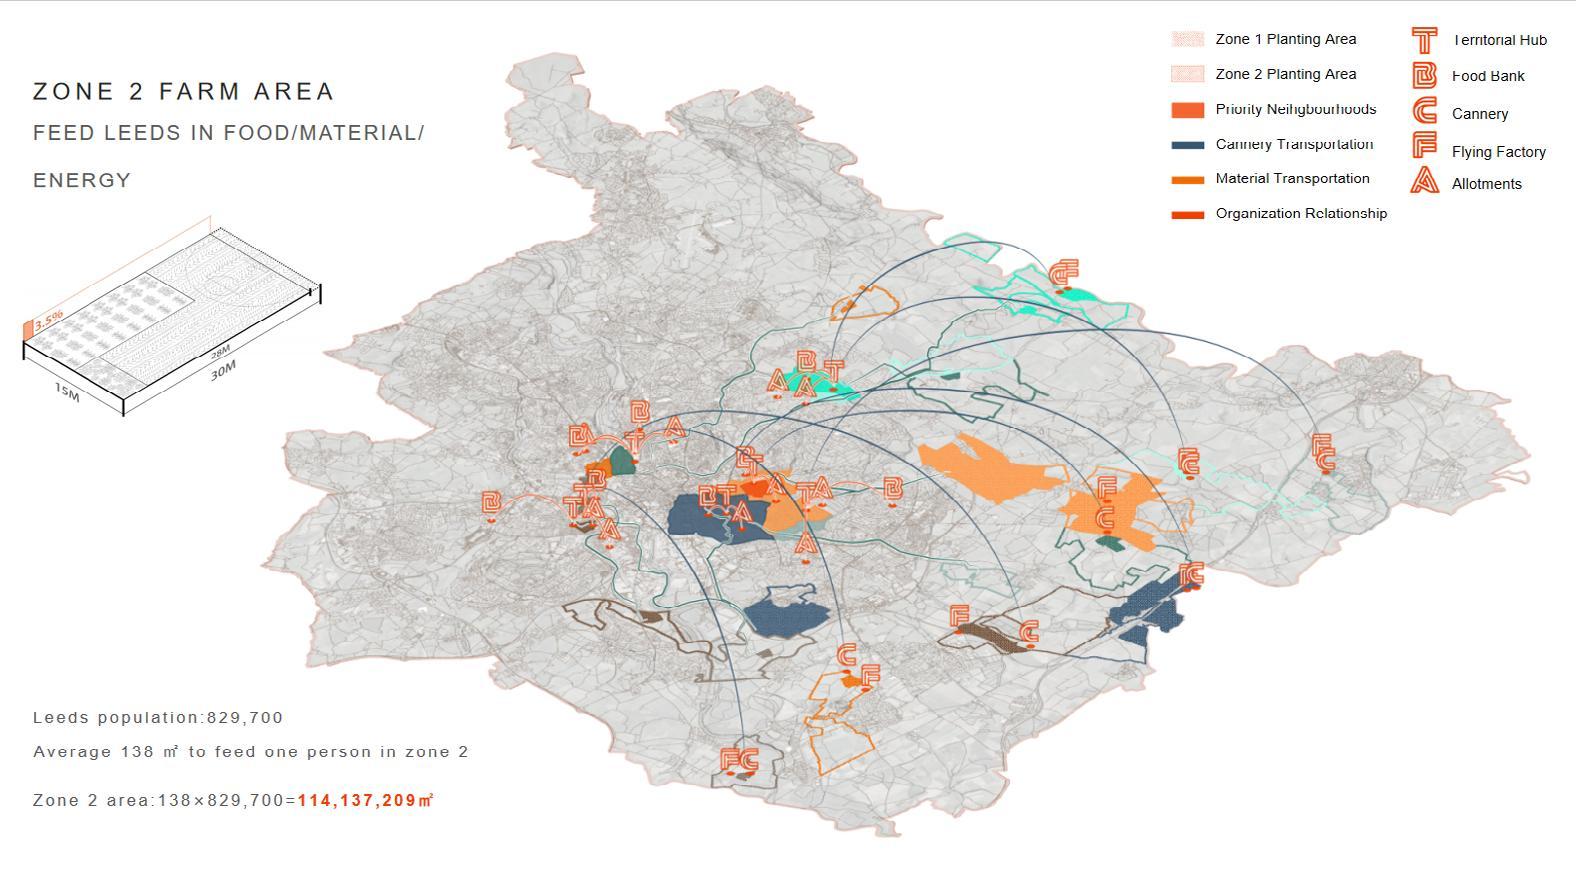
In the graduate design,we defined Urban and Rural area into 2 areas.This image shows two area and how different systems work including food system energy system,etc.
We caculated how much land we need in order to feed the citizens in leeds we divided different agricultural area in order to feed these people in priority neighbourhoods.