
URBAN PLANNING PORTFOLIO
August 2022- January 2025
AR. RUCHI PATHAK
Academy of Architecture, Mumbai
University of Illinois at Urbana Champaign
Contact-
ruchirp2@illinois.edu
+1 (447) 902-7069
Physical Planning, University of Illinois
1 SUITABILITY ANALYSIS USING GIS


Suitability analysis is a critical spatial evaluation process used to determine the most appropriate locations for development based on multiple environmental and infrastructural factors. In this study, the suitability of land for commercial development in and around Champaign County was assessed using layers such as soil type, water bodies, flood plains, and contours. These natural features play a crucial role in determining the feasibility and sustainability of any development. The contour analysis helped identify slope variations, with land having a slope between 1-6 degrees being most suitable for commercial use due to its stability and natural drainage capacity. Steeper slopes posed challenges for construction and accessibility. Soil analysis provided insights into factors such as permeability, moisture content, and structural stability, which are essential for determining the land’s load-bearing capacity and suitability for development. The presence of water bodies and flood plains was another critical consideration, as areas prone to flooding required buffer zones to mitigate risks and ensure long-term safety. Although proximity to water bodies can enhance property value and aesthetics, it also increases flood risks and demands additional drainage infrastructure. The integration of these layers allowed for the identification of highly suitable and unsuitable areas, with lighter-colored regions on the suitability map indicating optimal locations and darker areas representing constraints due to environmental limitations. This multi-criteria evaluation approach helped in making informed decisions regarding land use planning, ensuring that commercial developments are strategically placed in areas that balance accessibility, safety, and sustainability.
HOUSING
IN CHAMPAIGN
GIS For Planners, University of Illinois
2 GIS RESEARCH- UNDERSTANDING AFFORDABLE


The research project analyzed the spatial distribution of affordable housing in Champaign County, Illinois, and its proximity to essential services, including public transportation, healthcare facilities, educational institutions, and grocery stores. Given that Champaign is a mid-sized city with a diverse population of university students, low-income families, and essential workers, understanding the accessibility of these critical services was vital for promoting equity and improving residents’ quality of life. The study employed Geographic Information Systems (GIS) to map and analyze affordable housing locations, overlaying them with service data to identify accessibility patterns and gaps.

Spatial analysis techniques such as network distance analysis and multiple-criteria evaluation were used to assess connectivity and determine areas where affordable housing developments were needed to enhance accessibility. The research began with data collection from sources such as CCRPC, CCGISC, and Champaign County’s official records, followed by geospatial analysis using buffers and overlay techniques. The ultimate goal was to provide insights that could inform urban planning decisions, ensuring that affordable housing was equitably distributed and strategically located to minimize transportation costs and improve service accessibility for residents. This study served as a model for other small cities facing similar challenges in balancing affordability and accessibility in urban housing policy.
3
URBAN DESIGN- DART CONTAINER, URBANA
Physical Planning, University of Illinois

The redevelopment of the Dart Container site in Urbana focused on transforming a vacant industrial parcel into a dynamic mixed-use development that integrates multi-family residential units with innovation centers for startups. Given its strategic location near central Urbana and the University of Illinois, the site was analyzed for its suitability based on factors such as connectivity, environmental sustainability, and economic feasibility. The project applied transit-oriented development (TOD) principles to enhance accessibility while reducing car dependency, incorporating pedestrian pathways, bike lanes, and improved public transit options.
Sustainable urban design elements, including green infrastructure like bioswales, rain gardens, and retention ponds, were integrated to manage stormwater effectively and enhance the site’s environmental resilience. Additionally, a financial feasibility study demonstrated a strong internal rate of return (IRR) and net present value (NPV), reinforcing the project's long-term economic viability. The redevelopment aimed to address housing shortages, support local businesses, and promote community-driven growth, setting a benchmark for future urban projects in Urbana.
A comprehensive site analysis examined various environmental and infrastructural factors influencing the site's redevelopment potential. The existing land use, previously designated as heavy industrial (IN-2), was evaluated for conversion into a mixed-use zone that better aligns with Urbana’s evolving development needs. The study incorporated SWOT analysis, market research, and feasibility assessments to determine the site’s strengths, weaknesses, opportunities, and threats. The proposed urban design focused on a well-balanced integration of commercial and residential spaces, ensuring accessibility through an efficient street network and strategically placed transit hubs.
Additionally, storm water management played a crucial role in shaping the site’s infrastructure, with a retention pond, bio-swales, and permeable surfaces designed to mitigate runoff and enhance sustainability. The project not only aimed to revitalize the Dart Container site but also to serve as a model for sustainable and inclusive urban redevelopment, fostering economic growth while prioritizing environmental and social well-being.


URBAN DESIGN FOR CULTURAL CENTER
Group project Semester 9, Academy of Architecture


STUDY OF CRIME RATES STATISTICS USING R STUDIO
Urban and Regional Analysis, University of Illinois


The aim of the study is to find out which factors influence the crime rates in New York County the most. Factors such as literacy rates, poverty rates, population density, medium income etc. is taken into consideration. Demographic data such as average age, number of police stations, etc. is also taken into consideration. To understand the factors and its influence on crime rates, a regression model is the best method to get required results. Regression analysis in urban planning can be used to study and predict various models of data sets and information. The paper focuses on results drawn from this regression model as well as comparing data by creating various scatter plots, bar charts, box plots, etc.
Regression Model 1:
The dependent variable is the crime rate, influenced by multiple independent variables. Key predictors include population density, poverty rate, employment rate, literacy rate, income, age, and number of police stations. Population density and poverty rate are the most significant predictors, consistently affecting crime rates. The model explains 51.2% to 65.8% of the variation in crime rates, with the second model providing the best predictive balance. Employment rate, literacy rate, and number of police stations are not statistically significant in later models.
Regression Model 2 (Log Transformation):
Crime rate and independent variables are log-transformed for better interpretability and reduced skewness. Poverty rate and population density remain the strongest predictors of crime rates. Employment rate, literacy rate, income, and age do not have significant effects across models. The number of police stations is only significant in one model but loses significance when controlling for other variables. The adjusted R² values range from 0.691 to 0.771, indicating a stronger explanatory power than the first regression model.
Fig 1: Scatter Plot: Crime Rate vs. Income: The scatter plot shows a negative correlation between income and crime rate. As income increases, the crime rate tends to decrease, which suggests that higher-income neighborhoods may experience fewer crimes, potentially due to better resources or socio-economic stability.
Fig 2: Scatter Plot: Crime Rate vs. Population Density: There is a positive correlation between population density and crime rate. As population density increases, the crime rate tends to rise, indicating that areas with more people per square mile experience higher crime rates. This could be due to increased opportunities for crime in densely populated areas or other socio-economic factors.
Fig 3: Box Plot: Crime Rate by Poverty Rate Group: The Box Plot of Crime Rate by Poverty Rate Group provides a clear illustration of the relationship between poverty and crime rates. In areas with low poverty rates, crime levels are consistently lower, with very little variation. This suggests that communities with greater economic stability tend to experience less crime.
Regression Model 1
Regression Model 2
DEMOGRAPHIC AND ECONOMIC ANALYSIS FOR PEORIA
Urban and Regional Analysis, University of Illinois


The demographic and economic analysis of Peoria County, Illinois, combines statistical modeling and spatial analysis to assess population trends, economic disparities, and employment patterns. As the largest urban center along the Illinois River, Peoria has historically relied on manufacturing and agriculture but now faces population decline, economic shifts, and racial disparities. The study employs multiple projection models, including constant, geometric, linear, and percentage-based forecasting, to predict population changes. Shift-share and Location Quotient analyses identify key industries contributing to growth or decline, revealing that Peoria’s employment growth lags behind national trends. High poverty rates are concentrated in urban centers, particularly among Black and Hispanic residents, who also face significant income and employment disparities. Housing inequality further exacerbates these issues, with minority groups experiencing lower homeownership rates and higher rent burdens.
R Studio played a critical role in analyzing and visualizing these trends, enabling data cleaning, predictive modeling, and spatial mapping. Regression models were applied to quantify the impact of distance from the Central Business District (CBD) and subcenters on population and employment densities, revealing the centralization of economic activity around Peoria’s business district despite persistent poverty. 3D maps, generated using R’s GIS tools, highlight employment and population density variations, as well as disparities in job accessibility and economic opportunities. Addressing these challenges requires policies that promote equitable economic growth, affordable housing, and workforce retention to foster a more sustainable and inclusive future for Peoria County.


ADAPTIVE REUSE OF URBAN CENTER IN MUMBAI TO FOSTER COMMUNITY DEVELOPMENT AND SUSTAINABILITY
Architectural Thesis, Academy of Architecture


8
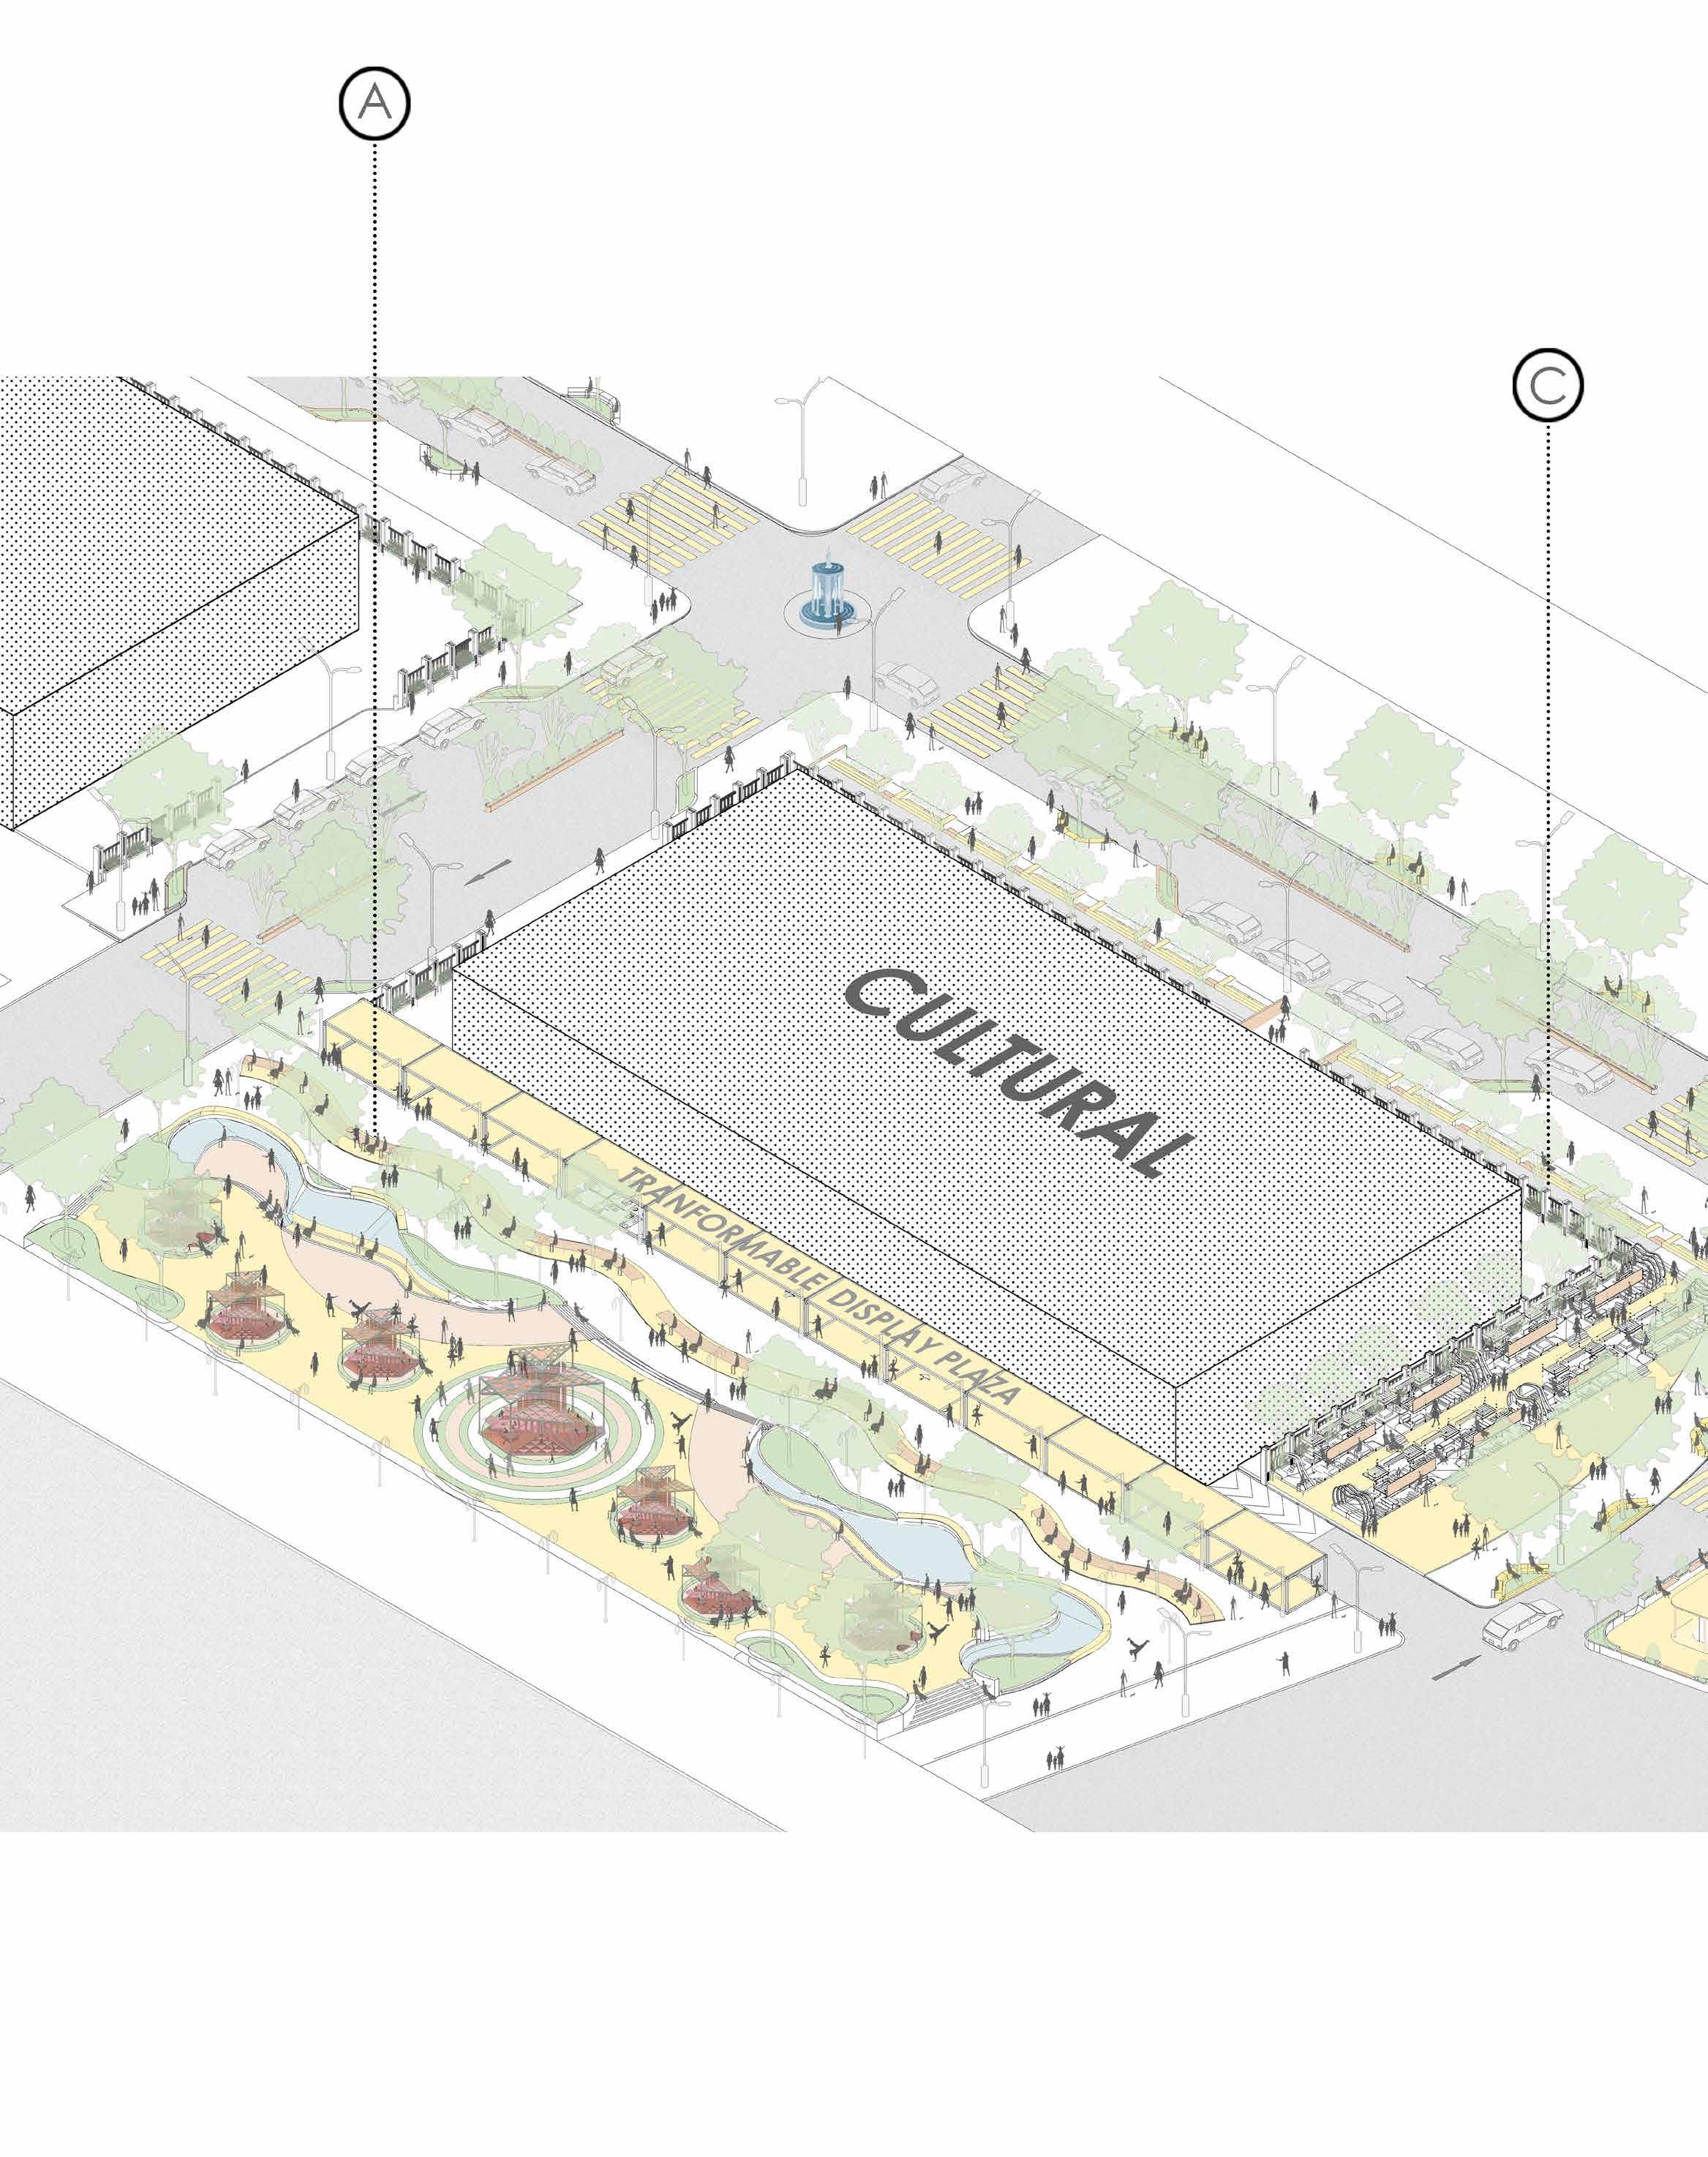
GRAPHICAL REPRESENTATION WORK
Internship Work for TAC, Mumbai.


Designed by- The Architecture Company
Graphics Published on - Arch Daily

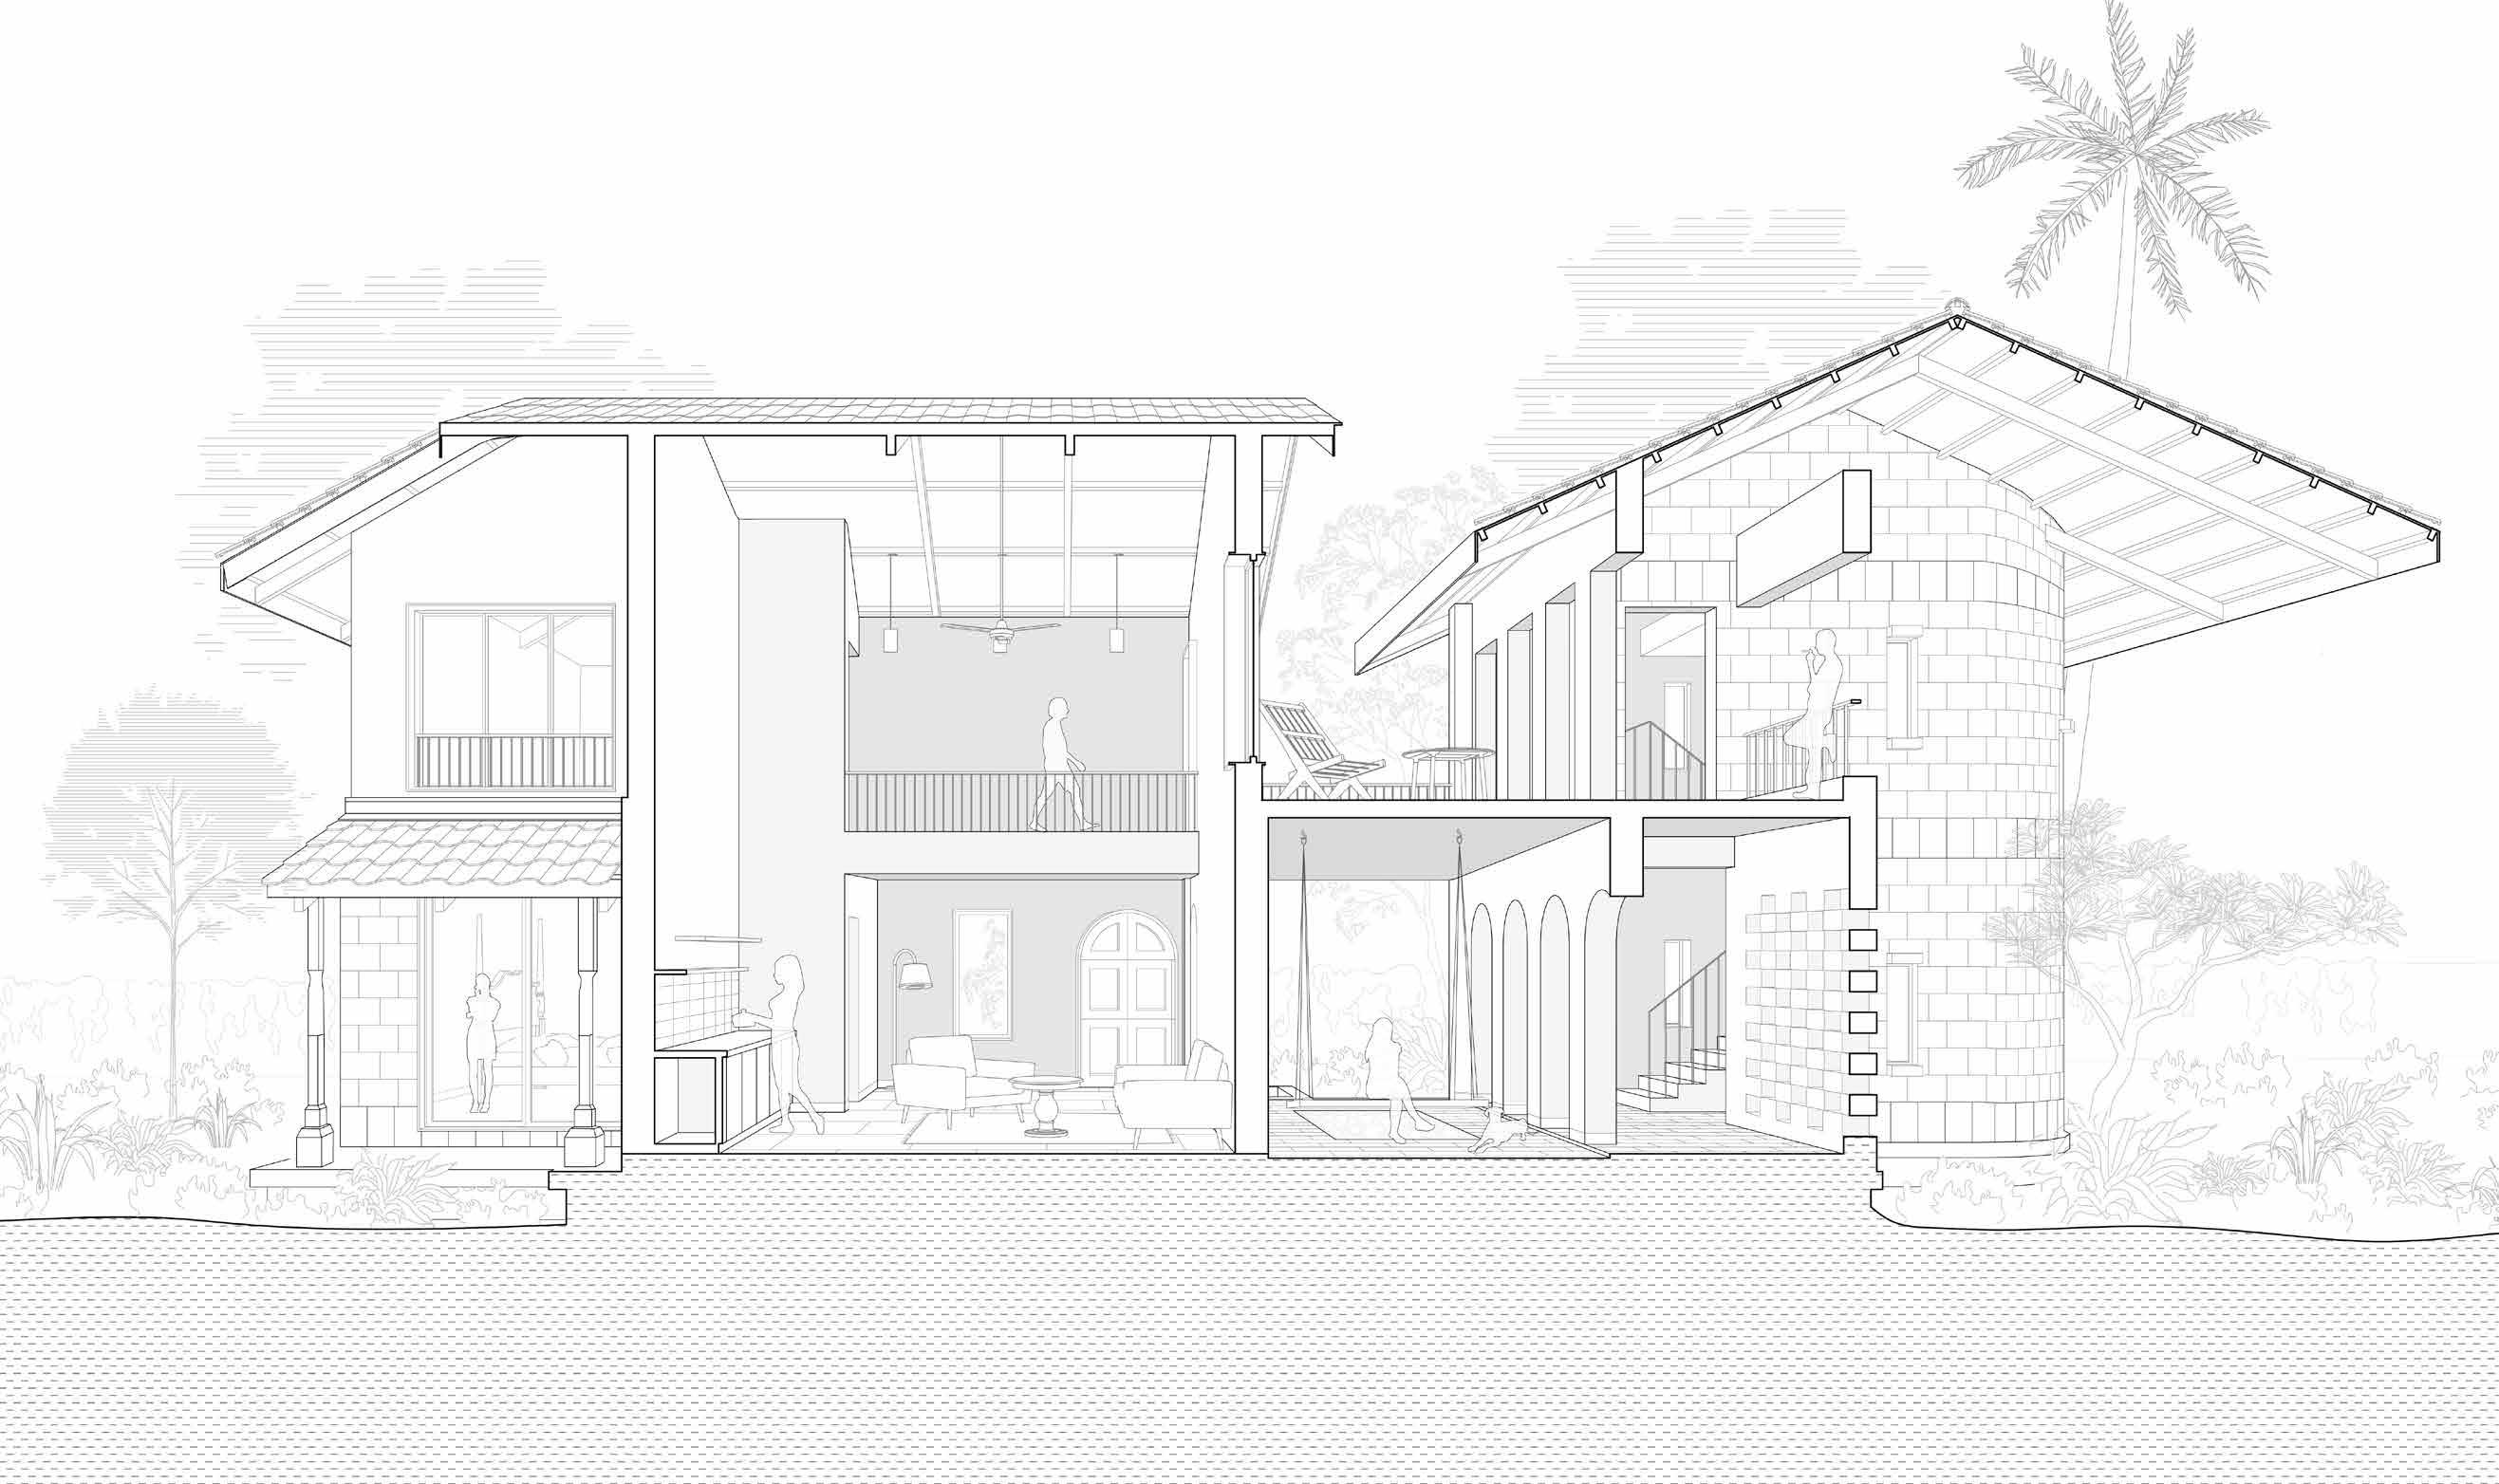
Maison Rouge.
(TAC).