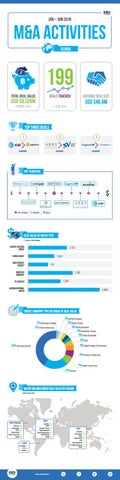
Jan – Jun 2018
M&A activities GLOBAL
199 Total deal value
deals tracked
USD $9,326m +88% YoY
average deal size
USD $46.9m
+1% YoY
top three deals 1
2
3
Acquiring
Acquiring
Acquiring
top 10 buyers
$
2
2
No. of Deals
1
Acquirer
1
11
2
2
1
3
1
$
$ Value
Deal Value by Buyer Type * Value in USD Million
Agency Holding Group
1,552 1,043
Consultancy Independent Agency
776
MarTech Company
1,785 1,292
PE-backed Unconventional Buyer
2,880
Target Company Type by Share of Deal Value 1% Branding & Design 1% Media Full-service
2% CRM/Promotion 2% Social Media 3% PR/Experiential 3% Production House 3% Media Specialist 4% B2B 5% Digital Design & Production
42% MarTech/AdTech
6% Creative Full-service 7% Digital Full-service 21% Others
MAJOR HOLDING GROUP DEAL VALUE BY REGION (Deal Value $m)
EMEA
North America Dentsu Omnicom WPP Hakuhodo MDC Partners Total
122 185 63 77 49 496
Dentsu WPP Havas Group M&C Saatchi Chell Worldwide BlueFocus Total
Latam Dentsu 3 IPG 35 Total 38
www.rthree.com
58 77 48 9 24 21 237
APAC Dentsu Omnicom WPP Hakuhodo IPG M&C Saatchi Publicis Groupe Total
48 20 17 55 7 21 15 183