
Background Information and Recommended Plan Components
RDMP Adopted 19 October 2022
Regional Demand Management Plan Review and Update
Final Report
Disclaimer:
This report has been prepared on behalf of and for the exclusive use of Rous County Council and its constituent councils and is subject to and issued in accordance with the agreement between Rous County Council and Hydrosphere Consulting. Hydrosphere Consulting accepts no liability or responsibility whatsoever for it in respect of any use of or reliance upon this report by any third party.
Copying this report without the permission of Rous County Council or Hydrosphere Consulting is not permitted.
Acknowledgement
Hydrosphere Consulting acknowledges the Bundjalung peoples, Traditional Custodians of the lands discussed in this report and pay tribute and respect to the Elders both past and present and emerging of the Bundjalung nations.
Hydrosphere Consulting Pty Ltd Suite 6, 26 54 River Street PO Box 7059, BALLINA NSW 2478 hydrosphere.com.au
© Copyright 2022 Hydrosphere Consulting

of Country:
JOB 22-003: DEVELOPMENT OF REGIONAL DEMAND MANAGEMENT PLAN: IBACKGROUND INFORMATION AND RECOMMENDED PLAN COMPONENTS REV DESCRIPTION AUTHORS REVIEW APPROVAL DATE 0 Draft for RCC and constituent council review Kate Menzies, Nicole Fokes Robyn Campbell Mick Howland Mick Howland 29 November 2021 1 RDMP Supporting Information Kate Menzies, Nicole Fokes Robyn Campbell Mick Howland Mick Howland 22 June 2022 2 Adopted Robyn Campbell 19 October 2022
EXECUTIVE SUMMARY
Hydrosphere Consulting has been engaged by Rous County Council (RCC) to review and update the Regional Demand Management Plan: 2019 - 2022 (RDMP, Hydrosphere Consulting, 2018) for the next four years (2023 – 2026) on behalf of RCC and its constituent councils (Ballina Shire Council - BaSC, Byron Shire Council - BySC, Lismore City Council – LCC and Richmond Valley Council – RVC). The first stage of this project involved gathering information from each Council, reviewing feedback on the delivery of the RDMP 2019 - 2022 and opportunities for the new RDMP, as well as outcomes of a broader review to recommend a suite of initiatives for the next four year plan timeframe.
The purpose of this report is to provide recommendations for the new RDMP 2023 - 2026. The outcomes of the following tasks have been considered in this report:
• Consultation with RCC and the constituent councils.
• Review of RDMP implementation progress.
• The demand management initiatives of other water utilities.
• Current indicators of demand and losses.
• Investigation of behaviour change applications in water supply demand management.
The RDMP 2019 – 2022 describes the water supply demand management initiatives to be implemented by RCC and the constituent councils between 2019 and 2022 and includes the following seven actions with associated tasks:
• Action 1: Monitoring, Evaluation and Reporting.
• Action 2: Water Loss Management.
• Action 3: Sustainable Water Partner Program (SWPP).
• Action 4: Smart Metering.
• Action 5: Recycled Water.
• Action 6: Rainwater Tank Rebates.
• Action 7: Community Engagement and Education: 7A: Households, 7B: Schools and 7C: High Residential Water Users.
The Rous Future Water Project 2060 identifies new water supply sources to ensure long term water supply security for the Rous region. RCC remains committed to responsible water use and ongoing initiatives aimed at reducing demand Ongoing review and update of demand management activities is a key component of the Future Water Project 2060 The objectives of demand management in the region are to reduce normal consumption and average supply requirements in order to reduce the urgency of water source augmentation. Demand management actions should also aim to increase awareness of the value of water and level of customer consumption. Innovative approaches should be used to improve the success of any actions over time. Pilot programs should be used to test uncertainties and prove effectiveness of potential new or
RDMP - Background information and recommended plan components Page I
modified actions. Sufficient resources should be allocated by each council to ensure successful outcomes. The focus areas for the new RDMP should be:
1. Collection and analysis of detailed demand data accurate identification of water demand in terms of customer sectors and uses, short and long term climate influences and other drivers of demand and improved understanding of components of water losses.
2. Water loss reduction Water losses are high in the regional water supply area. A targeted program of pressure management, active leak control, pipeline and asset management and leak repairs should be implemented by the individual councils. This should be supported by improved data collection and analysis and digital integration. Residential programs should also be designed to include components which support residents to identify and repair leaks.
3. Implementation of smart metering with a short term focus on planning and developing systems and internal resources to achieve the many benefits of digitalisation such as reduced water losses, cost efficiencies due to task automation, improved service reliability and increased customer understanding and involvement across the full range of council services over the longer term.
4. Customer engagement programs targeting key sectors, schools, older properties with inefficient fittings and fixtures, household leaks or high water users with increased customer involvement, understanding and ownership of water efficiency requirements.
5. Pilot programs focusing on changing behaviour of residents to use less water to complement other supply and demand measures.
6. Pilot programs to test the community desire, costs and benefits of residential retrofit programs for household and external water uses.
The new RDMP will specify amended demand management actions and tasks for each council. The following recommendations are provided for consideration by RCC and the constituent councils
Data Collection, Monitoring and Reporting
Improved data collection and analysis of all components of the water balance is required with improved systems to capture data.
Recommendation 1: Increased effort in demand monitoring tasks is required to develop greater understanding of the outcomes of demand management programs on residential and non-residential demand over time.
Recommendation 2: The status of RDMP tasks and data on customers, water supply and consumption should be reported by all councils on a bi annual basis through the Regional Liaison Committee meetings with standing agenda items including RDMP progress, demand indicators and sharing of lessons learned.
Recommendation 3: The councils should work together to develop and implement standardised definitions of connection types to ensure consistency across the region.
Recommendation 4: The councils should work together to develop and implement a standardised metering policy across the region to assist with monitoring and reporting.
RDMP
Page II
Background information and recommended plan components
Recommendation 5: If per capita indicators are adopted/developed, the population served in each area should be estimated as accurately as possible e.g. following the release of Census results and updated as required to correspond with seasonal influences and reporting periods.
Recommendation 6: Regional demand forecasts should be updated in accordance with the Rous Future Water Project 2060 actions with more accurate data collected through the RDMP implementation.
Recommendation 7: RCC should continue to coordinate monitoring and reporting with data provided by LWUs as required by the new RDMP.
Water Loss Management
As water losses are high (although variable) across the regional water supply area, water loss reduction should be a focus of the RDMP
Recommendation 8: Water loss management is a critical component of demand reduction and current levels of losses are high. Each council should provide sufficient resources to implement their WLMPs and set targets (based on best practice indicators) and timeframes for water loss reduction.
Recommendation 9: Each council should implement a water loss management program building on existing programs and infrastructure already installed. This should include data collection and water loss analysis, district flow metering and data analysis, pressure management, active leak identification, timely leak repairs and pipeline and asset management with consistent indicator definitions across the region.
Non-residential Programs
The new RDMP should include targeted and broader delivery of the SWPP as this expenditure has been cost effective and the program provides valuable customer engagement. Promotion to high water users and specific priority industry sectors should be a focus.
Recommendation 10: SWPP promotion should continue to include case studies and cross-promotion of successful water efficiency projects.
Recommendation 11: RCC should continue to coordinate the SWPP on behalf of the constituent councils.
Recommendation 12: Constituent councils should implement a water conservation program for high water users (non residential customers) in local supply areas.
Recommendation 13: Modifications to the SWPP and eligibility criteria should be considered to make it easier for smaller businesses that are willing to participate e.g. fixture/fitting replacement, removal or lowering of demand threshold, smart metering etc.
Recommendation 14: A method of ongoing monitoring and engagement should be developed with each participating business to measure the success of SWPP initiatives.
Recommendation 15: The councils should develop improvement plans and showcase projects (across council buildings, infrastructure, operations and services) to demonstrate leadership and encourage customer water efficiency.
RDMP Background information and recommended plan components Page III
Smart Metering
As there is considerable benefit expected to result from smart metering, including synergies with other RDMP objectives/actions as well as interest from customers, smart metering should be a focus of the RDMP.
Recommendation 16: BaSC and BySC should provide information to other councils on successes, challenges and recommendations from their smart metering programs.
Recommendation 17: RCC should implement smart metering for its retail customers and work with the constituent councils to extend the program across the region either as a regional or local approach with consideration of budget, timing and planning priorities.
Recommendation 18: Consumption targets should be developed as part of the smart metering program to provide meaningful and measurable responses from the community.
Recommendation 19: Full implementation of smart metering will require significant investment, staff resources, training and a significant amount of time. It is noted that the application and benefits of smart metering and infrastructure development are not restricted to the demand management functions of each council. Implementation should consider the lessons learned from other water utilities.
Recycled Water Use
As the non potable recycled water programs in BaSC and BySC are locally driven and are not influenced by regional approaches, it is recommended that these programs continue to be implemented outside the RDMP as a supply side measure to suit the local council circumstances. RCC will continue to investigate opportunities for indirect potable reuse and direct potable reuse as part of the Future Water Project 2060.
Recommendation 20: RCC should continue to promote non potable recycled water connections to BaSC and BySC businesses (where appropriate) as part of the SWPP with rebates as part of the SWPP.
Recommendation 21: BaSC and BySC should administer their own recycled water rebates if desired (given the local plumbing enquiries and compliance requirements within their respective jurisdictions).
Rebates and Incentives
The implementation of the national Water Efficiency Labelling Scheme (WELS), for the mandatory labelling of appliances and the BASIX for new developments will continue to increase the market uptake of water efficient fixtures and appliances, particularly showerheads and washing machines. The rebate program should be modified to include a broader range of products available through rebates to reflect the needs of residential and non residential customers
Recommendation 22: Rainwater tank rebates appear to be popular within the community, particularly during dry periods. Based on feedback received during the Future Water Project 2020 public exhibition, community feedback suggests that rainwater tanks should be a component of the region’s water supply. The rainwater tank rebates do not generally provide value for money for RCC and the community and there are limited water savings particularly during extended dry periods. However, the rainwater tank rebate program provides intangible benefits such as contact with
RDMP Background information and recommended plan components Page IV
customers and stormwater detention. Due to the low cost-effectiveness, it is recommended that alternative residential customer incentives are developed to achieve the objectives of customer engagement and support, water efficiency and cost effectiveness.
Recommendation 23: Pilot programs should be implemented to test the needs and benefits of residential retrofit programs. Pilot programs with audits and end use and fixture surveys should be implemented to allow RCC to establish baseline consumption and water use behaviour for different household types across the region, quantify potential water savings and develop targeted future incentive programs.
Recommendation 24: Incentives should be offered directly to high residential water users based on the outcomes of the pilot programs.
Recommendation 25: Programs should be considered for vulnerable or financially disadvantaged customers with older water-intensive products.
Recommendation 26: Marketing of any adopted rebate program and cross-promotion with other measures should be included to increase uptake and awareness.
Recommendation 27: As financial assistance can be used to encourage property owners to repair leaks, the undetected leak discount policies should continue with ongoing review of the expenditure and water savings. However, once a smart metering program is in place with more immediate identification of leaks, the policy should cease as leaks will be easily detected.
Residential Customer Programs
Average residential demand across the Rous supply region is higher than the NSW median although demand varies between the LGAs. The residential sector is the largest customer group in the RCC supply area with approximately 85% of connections and 76% of demand (excluding losses) (Hydrosphere Consulting, 2020c) and should continue to be a focus of the RDMP
Recommendation 28: The high residential user program should continue to be implemented using the tools developed for the RDMP 2019 2022.
Recommendation 29: A consistent regional water bill format should be considered including comparisons to regional targets and water saving advice. The bill format may need to be modified as part of the smart metering program. It should also be rigorously tested on customers before implementation as part of the residential component of the program.
Recommendation 30: RCC should continue to coordinate residential programs.
Recommendation 31: A customised pilot behaviour change program should be designed and implemented for a small sub set of the residential water supply customers in each of the four LGAs to add to the success of other water supply and demand reduction measures and ensure sustained water efficiency behaviours are identified and supported.
Education and Engagement
Education and engagement should be a key focus of the RDMP to improve the success of other demand management measures, increase water literacy and encourage water efficient behaviour.
RDMP Background information and recommended plan components Page V
Recommendation 32: RCC and the constituent councils should co-fund a regional resource for delivery of water cycle education programs including catchment health, water supply, wastewater management and stormwater management initially targeting schools but also wider community education.
Recommendation 33: RCC should continue to coordinate regional education programs.
Recommendation 34: Customer engagement should include actions that increase customer awareness of water consumption, encourage water efficient behaviours and promote the demand management program measures to increase the success of their implementation. Customer engagement would be enhanced once smart metering has been implemented.
Recommendation 35: Education activities are directly linked to the customer engagement program, encouraging and supporting water efficient behaviours. Education components should be costeffective and designed to reach as many customer sectors as possible. The information available to customers (e.g. through websites, customer service centres and bill inserts) should be reviewed and updated regularly with links to consistent centralised information (e.g. from The Water Conservancy or education websites). Other cost-effective methods include the use of social media for information dissemination. Education should be undertaken in parallel with other customer engagement activities such as water use audits. General education activities should include materials targeting households, non-residential customers and high residential and non-residential users.
Recommendation 36: As school students are the customers of the future and can encourage water efficiency in the home, a targeted and well resourced education program for primary and secondary schools should be developed and delivered directly by either internal or external staff.
Recommendation 37: Education activities should include tourism accommodation providers and facilities to target the large number of visitors to the region.
Recommendation 38: Ongoing sustainable and sensible water use should continue to be promoted through voluntary permanent water conservation measures as Level 0 in the drought restriction policy to assist with promoting sensible water use, provide a link to the drought restriction policy and support other program measures.
Pricing
There are strong links between water supply pricing and water usage.
Recommendation 39: RCC should review the bulk pricing structure in consultation with the constituent councils considering demand reduction signals and mechanisms to support other demand management measures.
Recommendation 40: The constituent councils should continue to set a pricing structure that encourages demand reduction and supports the initiatives in the RDMP
Agreed Measures
The recommendations were provided for consideration by RCC and the constituent councils at a workshop with the Regional Liaison Committee in December 2021. The measures agreed at this workshop have been further developed as actions in the RDMP 2023 2026 Not all recommendations are included in the new
RDMP Background information and recommended plan components Page VI
plan which has been developed considering available budgets and human resources of RCC and the constituent councils. Multiple recommendations are combined where appropriate in the design of the new RDMP actions.
Table 1 provides the link between the recommendations and agreed RDMP components. Table 2 provides a list of actions that will be implemented separately to the RDMP 2023 2026.
recommended
components Page VII
RDMP Background information and
plan
RDMP - Background information and recommended plan components Page IX Table 1: Recommendations and agreed RDMP components ID Component 1Increase DMR 2Regional Liaison Committee 3Standard definitions 4Standard metering 5Population served 6Forecasts 7RCC coordination of DMR 8Water loss resources and targets 9Water loss program implementation 10SWPP promotion 11RCC coordination of SWPP 12NRES program (local supply areas) 13SWPP modification 14SWPP outcomes monitoring 15RCC and LWU projects 16SM lessons learned 17RCC SM program 18Cons umption targets 19SM planning 20NRES recycled water rebates 21RES recycled water rebates 22RWT rebate 23Pilot program (consumption and end use) 24High water user incentives 25Vulnerable/ financially disadvantaged 26Marketing of incentive programs 27Undetected leak policies 28High residential water user program 29Bill format 30RCC coordination of RES program 31RES behaviour change pilot program 32Water cycl e education resource 33RCC coordination of education programs 34Customer awareness 35Community education 36School education 37Tourism sector education 38Permanent water conservation measures 39Bulk pricing review 40Increased usage c harges Monitoring, evaluation and reporting RDMP action status P C C L N N Customer data and consumption P C P P F O C L N N L L L L Water balance reporting P C P P O C L L N N L L Non-residential programs SWPP C L P C L P P P N N RCC and constituent council property audit C L L P L L N N L Residential customer programs Investigations C P P F N N P P L L L C P L L L L Incentive program C N N L P P P L P C L L L L L L Education and engagement Households C L L F F N N L L L P L P C L P C P P P High residential users C L L N N L L L P P P C L L C P P P Schools C N N P C P L P P Tourists C F F N N C P L P P P Priority component F Potential future RDMP action O Ongoing/ periodic action C Coordination role L Links to RDMP action N Not recommended
RDMP - Background information and recommended plan components Page X Table 2: Demand management actions to be implemented by RCC and the constituent councils separately to the RDMP ID Component 1Increase DMR 2Regional Liaison Committee 3Standard definitions 4Standard metering 5Population served 6Forecasts 7RCC coordination of DMR 8Water loss resources and targets 9Water loss program implementation 10SWPP promotion 11RCC coordination of SWPP 12NRES program (local supply areas) 13SWPP modification 14SWPP outcomes monitoring 15RCC and L WU projects 16SM lessons learned 17RCC SM program 18Consumption targets 19SM planning 20NRES recycled water rebates 21RES recycled water rebates 22RWT rebate 23Pilot program (consumption and end use) 24High water user incentives 25Vulnerable/ financially disadvantaged 26Marketing of incentive programs 27Undetected leak policies 28High residential water user program 29Bill format 30RCC coordi nation of RES program 31RES behaviour change pilot program 32Water cycle education resource 33RCC coordination of education programs 34Customer awareness 35Community education 36School education 37Tourism sector education 38Permanen t water conservation measures 39Bulk pricing review 40Increased usage charges Monitoring, evaluation and reporting Demand forecasts L C L L F P C L N N Water loss management RCC water loss management L C L L P P L N N L L Constituent council water loss management L C L L P P L N N L L Non residential programs Local non-residential customer program C P P L L N N L L L L L L Smart metering RCC retail customers L C L L F O L L L L P F P N N L L L L L L L L Constituent council customers L C L L F O L L L L L L F L N N L L L L L L L L Pricing Bulk pricing review C N N L L L L P Retail pricing review C N N L L L L L P P P Priority component F Potential future RDMP action O Ongoing/ periodic action C Coordination role L Links to RDMP action N Not recommended
RDMP Background information and recommended plan components Page i CONTENTS EXECUTIVE SUMMARY I 1. INTRODUCTION 1 2. DEVELOPMENT OF THE RDMP 2019 2022 3 3. FEEDBACK FROM COUNCILS 5 4. RDMP IMPLEMENTATION STATUS 7 5. REVIEW OF CURRENT PRACTICE 11 5.1 Customer engagement and education 17 5.2 Permanent Water Conservation 18 5.3 Rebates and Incentives 20 5.4 Undetected Leak Policy .................................................................................................................... 21 5.5 Water Loss Management 21 5.6 Pricing 22 5.7 Smart Meters ..................................................................................................................................... 23 5.8 Municipal Water Use 27 6. BENCHMARKING 28 6.1 Residential demand .......................................................................................................................... 28 6.2 Water Losses 28 6.3 Pricing 29 6.4 Expenditure ....................................................................................................................................... 30 7. BEHAVIOUR CHANGE 33 7.1 Current Behaviour Change Practice 33 7.2 Focus Groups 35 7.3 Recommended Approach 36 8. RECOMMENDED RDMP COMPONENTS 40 8.1 Recommended RDMP Objectives 40 8.2 Recommended RDMP Approach 40 8.3 Water Efficiency Targets 41 8.4 Target Customer Sectors 41 8.5 RDMP Focus Areas .......................................................................................................................... 41
REFERENCES 43
ABBREVIATIONS 46
APPENDIX 1 DEMAND MANAGEMENT MEASURES CONSIDERED IN THE DEVELOPMENT OF THE 2014 FUTURE WATER STRATEGY 49
APPENDIX 2 NOTES FROM MEETINGS WITH COUNCIL STAFF 59
APPENDIX 3 RDMP IMPLEMENTATION STATUS 61
APPENDIX 4 BENEFIT COST ANALYSIS ...................................................................................................81
APPENDIX 5 REGIONAL DEMAND DATA 91
APPENDIX 6 BEHAVIOUR CHANGE CURRENT PRACTICE AND LITERATURE REVIEW 97
APPENDIX 7 BEHAVIOUR CHANGE FOCUS GROUP REPORT AND OUTCOMES ................................99
FIGURES
Figure 1: Rous region every day water saving measures ............................................................................... 19
Figure 2: The four components of a mature digital water utility, from an internal focus (left) moving to an increasingly external focus (right) 26
Figure 3: RCC annual expenditure demand management 31
Figure 4: Options for bringing about change ................................................................................................... 33
Figure 5: The conditions surrounding voluntary behaviour change 34
Figure 6: The benefit of the implement, evaluate, learn and adapt process 38
Figure 7: The potable town water supply balance ........................................................................................... 92
Figure 8: Regional demand and connected properties: 2012/13 2019/20 94
Figure 9: Regional residential consumption and total demand per connection: 2012/13 2019/20 95
TABLES
Table 1: Recommendations and agreed RDMP components IX
Table 2: Demand management actions to be implemented by RCC and the constituent councils separately to the RDMP .......................................................................................................................................................... X
Table 3: Adopted demand management strategies 3
Table 4: Summary of demand management measures for selected NSW LWUs and south east Queensland 12
Table 5: Enablers (changes required) to enable benefits to be achieved from digital water metering ........... 25
Table 6: Comparison of average annual residential water demand in the region (2019/20) 28
RDMP Background information
recommended plan components Page ii
and
Table 7: Comparison of water losses (2019/20) 29
Table 8: Comparison of water supply tariffs in the region 30
Table 9: Comparison of demand management expenditure (total programs and administration/staff) 32
Table 10: Demand management measures implemented by RCC prior to 2014 52
Table 11: Potential new demand management measures considered in the 2014 Future Water Strategy 57
Table 12: Status of RDMP actions ................................................................................................................... 64
Table 13: Cost benefit analysis existing SWPP and rainwater tank rebates 84
Table 14: Demand management annualised costs TSC 86
Table 15: Cost benefit analysis rebates (CVC and CHCC) .......................................................................... 89
Table 16: Water supply connected properties (total regional and local supplies) 2019/20 93
Table 17: Permanent population served by water supplies 2019/20 93
Table 18: Potable urban water demand in the region (total regional and local supplies) 2019/20 ................ 94
RDMP Background information
recommended
components Page iii
and
plan
1. INTRODUCTION
Hydrosphere Consulting has been engaged by Rous County Council (RCC) to review and update the Regional Demand Management Plan: 2019 – 2022 (RDMP, Hydrosphere Consulting, 2018) for the next four years (2023 – 2026) on behalf of RCC and its constituent councils (Ballina Shire Council – BaSC, Byron Shire Council – BySC, Lismore City Council – LCC and Richmond Valley Council – RVC)
RCC provides bulk water to the following constituent council local government areas (LGA):
• BaSC, excluding Wardell and surrounds.
• BySC, excluding Mullumbimby.
• LCC, excluding Nimbin.
• RVC, excluding Casino and all land west of Coraki.
Bulk water supplied to these areas by RCC is delivered to the customer through the networks of each local Council (BaSC, BySC, LCC and RVC). RCC also provides water supply services to rural and urban connections direct from the bulk supply trunk main system (retail customers).
Demand management has been an integral part of RCC’s bulk water supply planning and management since 1995. These ongoing demand management initiatives have been successful in reducing water demand by approximately 50% over the last 25 years from average 484 kL/a/connected property (MWH, 2014a) to 248 kL/a/connected property (Hydrosphere Consulting, 2020c) despite an 80% increase in customer connections. Increased water efficiency and demand management strategies have reduced or eliminated many of the non essential uses of water from everyday life, meaning that it is now harder to achieve sustainable long term reductions in demand (this is termed ‘demand hardening’).
Appropriate urban water conservation is a required outcome of the NSW Best Practice Management of Water Supply and Sewerage Framework and the Water Management Act 2000 (as well as the National Water Initiative). In non metropolitan areas in NSW, water is supplied by the local water utility (LWU), which in most cases is the local council. Demand management and water conservation measures are implemented by LWUs using a suite of measures usually defined in a Demand Management Plan or in its Integrated Water Cycle Management (IWCM) Strategy.
The Best Practice Management Framework has been streamlined with checklists from the 2007 best practice guidelines superseded by the 2019 checklist for IWCM Strategies and 2014 Checklist for Strategic Business Plans. The checklists require demand management measures to be assessed including pricing (the responsibility of individual councils), a review of the current program and potential new non build water conservation measures with respect to their cost effectiveness (leakage reduction, pressure reduction, other losses, communication, permanent water conservation measures, retrofit etc.), the impacts of BASIX, open space irrigation, metering and billing.
The Rous Future Water Project 2060 identifies new water supply sources to ensure long term water supply security for the region. The Future Water Project builds on extensive investigations undertaken by RCC over the last few decades to identify potential source augmentation options and enable selection of a preferred long term strategy. The Future Water Project 2060 is RCC’s IWCM Strategy (Hydrosphere Consulting, 2021a) which documents the outcomes of detailed investigations undertaken regarding potential source
RDMP - Background information and recommended plan components Page 1
augmentation options and implementation scenarios. The constituent councils are also developing water supply strategies for the local supplies.
This report addresses the IWCM checklist requirements relating to water conservation measures. Demand data are also included in the regional demand forecast (Hydrosphere Consulting, 2020c).
The first stage of this project involved gathering information from each Council, reviewing feedback on the delivery of the RDMP 2019 2022 and opportunities for the new RDMP, as well as outcomes of a broader review to recommend a suite of initiatives for the next four year plan timeframe
The purpose of this report is to provide background information and recommendations for the new RDMP. The outcomes of the following tasks have been considered in this report:
• Consultation with RCC and the constituent councils.
• Review of RDMP implementation progress.
• The demand management initiatives of other water utilities.
• Current indicators of demand and losses
• Investigation of behaviour change applications in water supply demand management.
The new RDMP will specify amended demand management actions and tasks. This report provides a summary of the RDMP 2019 2022 and recommended changes based on the outcomes of the above tasks. The recommendations are highlighted in bold italic text throughout this document Not all recommendations will be adopted in the new plan which will be developed considering available budgets and human resources of RCC and the constituent councils. Multiple recommendations may be combined where appropriate in the design of the new RDMP actions.
Page 2
RDMP Background information and recommended plan components
2.
DEVELOPMENT
OF THE RDMP 2019 - 2022
As part of the development of the Rous Future Water Strategy in 2014 (MWH, 2014a), demand management options were reviewed including a strategic level cost benefit assessment. A benefit cost analysis of the demand management options (MWH, 2014b) weighed the cost of investment in demand management initiatives against the benefits accrued from three perspectives – the utility, the customer and the community (where the community combines both the utility and the customer). Assumptions for each measure including water savings, uptake and costs are provided in MWH (2014b). Any demand management measure with a marginal cost lower that the cost of source augmentation options being considered at that time were considered further as part of demand management cases (“Current Demand Management” and “Enhanced Demand Management”). The measures considered in 2014 are summarised in Appendix 1
Water efficiency was identified as Key Action 1 in the 2014 Future Water Strategy to affirm RCC’s ongoing commitment to the enhanced demand management initiatives with cost effective measures to achieve greater water efficiency. The 2014 Future Water Strategy (MWH, 2014a) predicted that enhanced demand initiatives will help delay and downsize future water sources required for the region. The enhanced demand management initiatives were reviewed by the Regional Water Supply Agreement Liaison Committee –Demand Management Working Group in 2017/18 and actions were optimised for the current (2019 – 2022) RDMP (Table 3, shaded green).
Table 3: Adopted demand management strategies
Demand management strategy
Residential initiatives
Rebates – rainwater tanks
Comments
Not considered cost effective in the 2014 Future Water Strategy but the program has broad community support.
Rebates – recycled water Program has been reviewed with consideration of recycled water scheme development.
Rebates – showerheads
Rebates have been offered since 1996. Water efficient showerheads are now readily available and the opportunity to replace inefficient showerheads is reduced.
Adopted strategies for RDMP 2019 –2022
Rainwater tank rebate program to continue in current form with active promotion.
Enhanced promotion of rebates where recycled water is available.
No additional action included in the RDMP 2019 - 2022
Water Efficiency Labelling Scheme (WELS), Building Sustainability Index (BASIX)
Programs are mandated by the NSW Government.
No additional action included in the RDMP 2019 - 2022
RDMP - Background information and recommended plan components Page 3
Demand management strategy Comments
Permanent low level restrictions
Not considered feasible with current legislation.
Adopted strategies for RDMP 2019 –2022
Increased promotion of voluntary measures (Voluntary Permanent Water Savings) is included in the RDMP 20192022
Non residential initiatives
Enhanced Blue and Green Business Program
The effectiveness of program has been reviewed and modifications have been developed.
Open space water efficiency
Constituent council initiatives
Water loss reduction
June 2016 study found low level of usage and low number of customers in the region.
Sustainable Water Partner Program (SWPP) targeting high water users with water efficiency plans, rebates, recognition program and increased engagement.
Not included in the RDMP 2019 - 2022
Local Water Utility (LWU) (constituent council) demand management plans
Strategic and regional approach to water loss management is critical to the success of the RDMP.
Not required as each council will implement actions from the RDMP.
Community Engagement and Education
Community engagement and education – schools
Community engagement and education – households
Programs have been successful but need to be matched to available resources.
Actions are required to increase understanding of household water consumption.
The RDMP actions will improve accuracy and understanding of water loss components and target leakage reduction.
Not included in the RDMP 2019 - 2022
Other initiatives
Smart metering
The status of current initiatives across the region and available technologies have been reviewed. Ongoing review of available technologies is required.
The RDMP 2019 - 2022 includes an overarching program of education to be delivered through schools.
Actions aim to provide increased awareness of consumption patterns and potential for water savings for all households and will also target residential customers with high consumption.
Smart metering program to be developed and optimised in the RDMP 2019 - 2022 as this is a potentially highly effective technology to identify leaks and high consumption.
RDMP - Background information and recommended plan components Page 4
Source: Hydrosphere Consulting (2018)
3. FEEDBACK FROM COUNCILS
Meetings were held with engineering, management, community engagement and operations staff from the councils to obtain feedback on the progress of the RDMP, challenges faced and actions to be included in the new RDMP. The outcomes of these meetings are provided in Appendix 2. The feedback from the RCC and constituent council staff can be summarised as follows:
• There is a lack of staff resources across the region which has delayed the implementation of RDMP actions.
• The councils generally agree that regional consistency is required for customer metering and definitions to aid in more accurate demand monitoring. There are significant challenges with developing a consistent system due to the variation in system capability, council policies and the lack of resources.
• The constituent councils provide limited community engagement regarding water saving measures and instead rely on and refer to information provided by RCC. During the drought of 2019/20, the councils were actively involved in communication of restrictions, particularly for local supplies.
• Only BaSC and RCC have a residential consumption target (160 L/person/day). Other councils indicated a need for smart metering before targets can be set, monitored and communicated appropriately.
• All councils are interested in smart metering as both a local and regional approach and have either implemented a local program (BaSC) or developed a pilot programs (BySC), planned to implement a local program (RCC) or are interested to see the outcomes of other programs before committing to the expenditure (LCC and RVC).
• Water loss reduction appears to be a key focus for each council but implementation is hampered by the lack of resources and the widespread nature and high cost of the program.
• BaSC has incorporated recycled water supply as a long term water source. BySC is implementing recycled water schemes on a local and opportunistic basis and is likely to focus on environmental flow releases in future. LCC and RVC are not planning to implement recycled water schemes. RCC will investigate potable water substitution as a long term component of the regional water supply strategy.
• Rebate and incentive programs are not actively promoted by the constituent councils and they rely on RCC to implement these programs. The constituent councils are unlikely to implement a rebate program for rainwater tanks in their LGAs if it is not managed by RCC. The low cost effectiveness of rainwater tank rebates is recognised but the councils also recognise the customer water savings and general community support for rainwater tanks. It is also recognised that an increased rebate would further reduce the cost effectiveness of the program.
• There is limited support for rebates for internal water efficient fixtures and fittings as these are mandated by NSW Government requirements for new developments and readily available on the market However, there is general support for a review of potential incentives with an increased understanding of water consumption patterns, cost effectiveness and expected success.
RDMP - Background information and recommended plan components Page 5
• There was general interest in supporting lower socio economic areas to improve water efficiency.
• There was general support for the re introduction of region wide school education programs addressing whole of catchment issues.
• There was some support expressed for a review of bulk water supply pricing to increase water efficiency signals.
• There is general support for RCC to lead and manage residential and non residential demand management initiatives across the region but also a need to provide clear responsibilities for implementation.
• While there is support for a delivery model where RCC leads the implementation of the proposed demand management initiatives, some actions remain the responsibility of the constituent councils. For example, actions such as implementing leakage detection, water loss management, pricing and smart metering are captured in internal business plans and budgets of the constituent councils and will be implemented alongside RCC’s demand management actions.
This feedback has been considered in the recommendations for the new RDMP.
RDMP Background
components Page 6
information and recommended plan
4. RDMP IMPLEMENTATION STATUS
The RDMP describes the water supply demand management initiatives to be implemented by RCC and the constituent councils between 2019 and 2022 and includes the following seven actions:
Action 1: Monitoring, Evaluation and Reporting
Action 2: Water Loss Management.
Action 3: Sustainable Water Partner Program (SWPP)
Action 4: Smart Metering
Action 5: Recycled Water.
Action 6: Rainwater Tank Rebates
Action 7: Community Engagement and Education: 7A: Households, 7B: Schools and 7C: High Residential Water Users
Each action included tasks to complete in order to fulfil the objectives of the actions A review of the progress of each action and its related tasks, expenditure and key performance indicators is provided in Appendix 3
Implementation of the RDMP actions has been hampered by a lack of human resources available within RCC (particularly during 2019/20 with a changeover of the Water Sustainability Officer) and the constituent councils (with staff changeover or deployment on other initiatives). Other actions (e.g. the SWPP and community engagement/ education) have required significant effort in the early planning and engagement stages including customer liaison and are only producing results in later years of the RDMP. Some implementation progress has been affected by COVID 19 restrictions. The implementation of standardised definitions of connection types and demand reporting across the region has been delayed by the lack of council resources which has had a flow on effect delaying other actions (e.g. water loss management and development of targets). The implementation of a regional approach to smart metering has not been successful as the councils have developed local programs and there has been a lack of regional coordination. Digital technology such as smart metering would improve the ability to monitor and report demand and increase customer interaction which are expected to result in more effective water saving measures. The take up of rebates and incentive schemes is likely to be higher during dry weather with the largest number of rebates provided during 2019/20 when extended dry periods were experienced
For the current rebates offered and the SWPP actions in the RDMP 2019 - 2022, the annualised costs per kL of water saved by the councils and their customers have been calculated based on the net present value (NPV) of the net expenditure and the predicted water savings. This calculation provides an indication of the relative investment for each action as a function of water saved to enable comparison between the actions on a cost basis. The data and calculations are provided in Appendix 4
The rainwater tank rebates do not provide a financial benefit to RCC (for expenditure of public funds) apart from the lowest level of rebate ($200 for a 3 kL tank without outdoor use only). The benefit to the customer generally increases as the tank size increases and indoor plumbing is included, but the benefit to RCC generally decreases, reflecting the increasing rebate offered. The SWPP is cost effective for the councils and customers which reflects the program’s focus on the actions with the largest water savings. The
RDMP - Background information and recommended plan components Page 7
achievable water savings for other programs (education, smart metering etc.) are uncertain. Significant variation is expected amongst customers, LGAs and would also be influenced by other measures implemented. Water savings from programs implemented by the constituent councils (smart meters, water loss management) will depend on investment, network configuration, customer mix, etc. The influence of tourists on water usage is a significant factor in the RCC region. Although some water savings can be hardwired, short term visitor behaviour is typically difficult to influence, unless there is a crisis such as a drought.
Similar findings have been reported for other LWUs (e.g. Tweed Shire Council (TSC), Clarence Valley and Coffs Harbour City Council) as discussed in Appendix 4
The following recommendations are provided from the review of the status of RDMP implementation and the benefit cost analysis undertaken for this project:
Recommendation:
• Increased effort in demand monitoring tasks is required to develop greater understanding of the outcomes of demand management programs on residential and non residential demand over time.
• The status of RDMP tasks and data on customers, water supply and consumption should be reported by all councils on a bi annual basis through the Regional Liaison Committee meetings with standing agenda items on RDMP progress, demand indicators and sharing of lessons learned.
• The councils should work together to develop and implement standardised definitions of connection types to ensure consistency across the region.
• The councils should work together to develop and implement a standardised metering policy across the region to assist with monitoring and reporting.
• If per capita indicators are adopted/developed, the population served in each area should be estimated as accurately as possible e.g. following the release of Census results and updated as required to correspond with reporting periods.
• Regional demand forecasts should be updated in accordance with the Rous Future Water Project 2060 actions with more accurate data collected through the RDMP implementation.
• RCC should continue to coordinate monitoring and reporting with data provided by LWUs as required by the new RDMP.
• Water loss management is a critical component of demand reduction and current levels of losses are high. Each council should provide sufficient resources to implement their WLMPs and set targets (based on best practice indicators) and timeframes for water loss reduction.
• SWPP promotion should continue to include case studies and cross-promotion of successful water efficiency projects.
• RCC should continue to coordinate the SWPP on behalf of the constituent councils.
• Constituent councils should implement a water conservation program for high water users (non residential customers) in local supply areas.
RDMP Background information and recommended plan components Page 8
• Modifications to SWPP and eligibility criteria should be considered to make it easier for smaller businesses that are willing to participate e.g. fixture/fitting replacement, removal or lowering of demand threshold, smart metering etc.
• A method of ongoing monitoring and engagement should be developed with each participating business to measure the success of SWPP initiatives.
• BaSC and BySC should provide information to other councils on successes, challenges and recommendations from their smart metering programs.
• RCC should implement smart metering for its retail customers and work with the constituent councils to extend the program across the region either as a regional or local approach with consideration of budget, timing and planning priorities.
• RCC should continue to promote non-potable recycled water connections to BaSC and BySC businesses (where appropriate) as part of the SWPP with rebates as part of the SWPP.
• BaSC and BySC should administer their own recycled water rebates if desired (given the local plumbing enquiries and compliance requirements within their respective jurisdictions).
• Rainwater tank rebates appear to be popular within the community, particularly during dry periods. Based on feedback received during the Future Water Project 2020 public exhibition, community feedback suggests that rainwater tanks should be a component of the region’s water supply. The rainwater tank rebates do not generally provide value for money for RCC and the community and there are limited water savings particularly during extended dry periods. However, the rainwater tank rebate program provides intangible benefits such as contact with customers and stormwater detention. Due to the low cost-effectiveness, it is recommended that alternative residential customer incentives are developed to achieve the objectives of customer engagement and support, water efficiency and cost effectiveness.
• Pilot programs should be implemented to test the needs and benefits of residential retrofit programs. Pilot programs with audits and end use and fixture surveys should be implemented to allow RCC to establish baseline consumption and water use behaviour for different household types across the region, quantify potential water savings and develop targeted future incentive programs
• Consumption targets should be developed as part of the smart metering program to provide meaningful and measurable responses from the community.
• The high residential user program should continue to be implemented using the tools developed for the RDMP 2019 - 2022.
• A consistent regional water bill format should be considered including comparisons to regional targets and water saving advice. The bill format may need to be modified as part of the smart metering program. It should also be rigorously tested on customers before implementation as part of the residential component of the program.
• RCC and the constituent councils should co fund a regional resource for delivery of water cycle education programs including catchment health, water supply, wastewater
RDMP Background information and recommended plan components Page 9
management and stormwater management initially targeting schools but also wider community education.
• RCC should continue to coordinate regional education programs.
• RCC should continue to coordinate residential programs.
• Education activities should include tourism accommodation providers and facilities to target the large number of visitors to the region.
RDMP Background information and recommended plan components Page 10
5. R EVIEW OF CURRENT PRACTICE
Hydrosphere Consulting (2020a) provided a comprehensive review of current practice for consideration by Tweed Shire Council (TSC) in its review of demand management initiatives Additional information has been collected from other LWUs to enable comparison with the Rous regional approach. Where data are adequate, RCC’s level of investment has been benchmarked against other LWUs considering factors such as demand and customer numbers (Section 6.4).
The review of current demand management practice conducted for TSC (Hydrosphere Consulting, 2020a) found that demand management programs are influenced by legislation, state and local government structure, human and financial resources, local needs/issues, climate influences, regulation and socio economic factors. Water utilities which are separate from the local council (such as Sydney Water and in Victoria where water utilities are supported by the state government) and metropolitan water utilities are often more supported by other levels of government and have more resources to implement demand management actions and different needs to regional water utilities such as RCC and the constituent councils. Given these influences and drivers, it is considered appropriate to focus this review on NSW non metropolitan water utilities with a similar climate to that of the Rous region (i.e. the NSW North Coast). Where relevant, comparisons to the experiences of other NSW LWUs which actively implement demand management initiatives
Demand management practice in south east Queensland has also been reviewed. Seqwater is the bulk water supply authority for south east Queensland and is responsible for sourcing, storing, treating and distribution of potable water to over 3.3 million people (Seqwater, 2020) compared to approximately 117,000 people in the constituent council areas. The Water Security Program (Seqwater, 2016) is Seqwater's plan for providing the region's drinking water over the next 30 years, including during times of drought and flood. The program details the demand management activities being implemented in the region. Demand management activities are implemented by Seqwater, south east Queensland water service providers (Unitywater and Urban Utilities), local government and the Queensland government. Seqwater operates a much larger water supply network than RCC and many of Seqwater’s customers live in metropolitan areas. For these reasons, the demand behaviour and demand management approach in south east Queensland are not directly comparable to the Rous region. Similar to NSW, the Queensland government legislation stipulates that water efficient taps and showers are required in all new residential buildings and water efficient toilets are required in all new buildings. Local governments are responsible for water conservation education and water efficiency in Council buildings, facilities and operations. Water service providers implement pressure and leakage management, metering and billing and water carter facilities such as fixed fill stations and metered hydrant standpipes to account for water use. They also provide information and community engagement about indoor and outdoor water efficiency These aspects of demand management are comparable to NSW LWUs
A summary of the demand management measured of NSW water utilities (local councils) and south east Queensland is provided in Table 4 and discussed in the following sections
RDMP - Background information and recommended plan components Page 11
Table 4: Summary of demand management measures for selected NSW LWUs and south-east Queensland
RCC and constituent councils Yes, mainly through website. Some community events e.g. Water Week, Residential high water users program. SWPP.
Yes Yes –rainwater tanks, SWPP
Yes – by constituent councils
WLMPs have been prepared but not fully implemented
Yes – by constituent councils
Dual reticulation available in Ballina, Lennox Head and Byron Bay
Yes – Ballina. RCC pilot program 2014 17 with 10 businesses. BySC pilot program 2021 – East Mullumbimby
Refer Section 4 and Appendix 3
Tweed Shire Council1 ‘Target 160’ campaign. Information on website.
Yes Showerhead, toilet and tapware rebates, top water user program
Yes No Yes Open space irrigation and industry usage
No TSC demand management plan was reviewed with a new program framework adopted March 2021.
Page 12
RDMP - Background information and recommended plan components
LWU Customer engagement and education
Permanent water conservation measures
Rebates and incentive programs
Undetected leak policy Water loss management Best-practice pricing Potable water substitution Smart meter program
Comments
Clarence Valley Council2
Information on website, facilities tours, Waterwise schools program
Yes Showerhead, toilet and rainwater tank rebates, water efficient partner program (>5 ML/a)
Yes Infrastructure renewal, WLMP to be developed.
Best-practice pricing
Coffs Harbour City Council2 Information on website, facilities tours, Waterwise schools program
Bellingen Shire Council3 Information on website, Waterwise schools program, Savewater Alliance
Yes Showerhead and toilet rebates, water efficient partner program (>5 ML/a)
Yes Infrastructure renewal, WLMP to be developed.
Yes Urban reuse for urban open space and agriculture
Pilot program to be developed and implemented
Regional Water Efficiency Plan adopted 2020 (shared bulk water supply)
Yes Washing machine rebate Yes Leak detection and repair, pressure management
Yes Urban reuse for urban open space and agriculture
Pilot program to be developed and implemented
Yes Dual reticulation for new residential development
No Unable to obtain additional information from Council
Page 13
RDMP - Background information and recommended plan components
LWU Customer engagement and education
Permanent water conservation measures
Rebates and incentive programs
Undetected leak policy Water loss management
Potable water substitution Smart meter program
Comments
Page 14
Permanent
Rebates and incentive
Undetected leak
Water
Best-practice
Potable
Smart
RDMP - Background information and recommended plan components
LWU Customer engagement and education
water conservation measures
programs
policy
loss management
pricing
water substitution
meter program Comments
Information on
Yes Showerhead, dual flush toilet and rainwater tank rebates Yes Metering reservoirs and
water loss User pays pricing Recycled
No
Nambucca Valley Council4
website
monitor
water from sewage treatment plant used for agricultural purposes
Limited investigation into demand management as water supply is considered to be secure5
Waterwise
Yes
Yes
Unknown
Kempsey Shire Council6
schools program
No
Unknown User pays pricing
Unknown Unable to obtain additional information from Council
spray gun heads, tap flow restrictors, showerheads), Business water efficiency program
Unknown
Yes - with significant price increases between 2003 and 2014 (step 1 usage charge in 2021/22 is $3.80 per kL)
Yes - open space irrigation and agriculture
at
Point to inform leak detection program.
5-year average residential demand is 121 kL/property p.a. which is attributed to high usage charges
Page 15
RDMP - Background information and recommended plan components
LWU Customer engagement and education
Permanent water conservation measures
Rebates and incentive programs
Undetected leak policy Water loss management Best-practice pricing Potable water substitution Smart meter program
Comments
Eurobodalla7 Information on website Yes Showerhead exchange, washing machine and dual flush toilet rebate, free installations of water saving devices (hose spray guns, pre-rinse
Active leak detection
Trial
Potato
Example south east Queensland Councils9,10,11
Information on website, school and community education programs and stakeholder engagement
No Conservation credits program and turf removal program
Yes Pressure and leakage management undertaken by water service providers, system loss programs
Tiered pricing Gold Coast desalination plant, western corridor recycled water scheme
No -
School and community education programs. Business education program. Community education program. Residential high water users program
No Incentive schemes and targeted marketing encouraging water-saving products.
Yes Water loss reduction program, pressure management, water meter replacement program
User pays pricing Recycled water schemes
supply water for irrigation of agricultural and sporting fields, parts of Seqwater have access to Gold Coast desalination plant
Smart water meter solutions project, Unitywater completed trial of smart meters and opted against them
-
Sources: 1- Hydrosphere Consulting (2020a), 2- Hydrosphere Consulting (2020b), 3 Bellingen Shire Council (2012), 4- Nambucca Valley Council (2021), 5 - pers. Comm. Richard Spain, (2021), 6 - Kempsey Shire Council (2021), 7 –Hydrosphere Consulting (2021b), 8 – Seqwater (2017), 9 - City of Gold Coast (2019), 10- Redland City Council (2014), 11- Logan City Council (2017).
Page 16
RDMP - Background information and recommended plan components
LWU Customer engagement and education
Permanent water conservation measures
Rebates and incentive programs
Undetected leak policy Water loss management
Best-practice pricing Potable water substitution Smart meter program
Comments
Seqwater8
5.1
Customer engagement and education
Since the millennium drought in Australia, it has been recognised that it is important to develop relationships with water customers to increase the effectiveness of water saving initiatives The Water Services Association of Australia (WSAA) has undertaken customer research which shows that water efficiency remains an important issue for Australian customers (even during non drought periods) and many want their water utility to support them to do more (WSAA, 2019a). Water demand education and awareness activities promote the uptake of water efficiency measures and highlight water wastage, but also engage the community to be better advocates for water conservation and protection, with the expectation that water is supplied, delivered and used efficiently. A substantial array of information on water saving tips is available on LWU websites. Social media is also becoming more common for communication of water topics. Seqwater has launched a three year community education and engagement program which will build community knowledge. The ‘Realities of Rain’ awareness campaign supports the three year program and asks people to use water wisely and prepare for the possibility of drought. The campaign includes an online hub with information, surveys, engagement opportunities and water conservation measures (Seqwater, 2021) Other large Australian water utilities have implemented similar customer engagement programs e.g. Hunter Water Love Water campaign, Sydney Water’s Customer Hub (Hydrosphere Consulting, 2020a).
Coffs Harbour City Council (CHCC), Clarence Valley Council (CVC), Kempsey Shire Council and Bellingen Shire Council have partnered with the NSW Department of Education and Cascade Environmental Education Centre to deliver the Waterwise Schools program (based on the program developed by Water Corporation, WA) which provides teaching and learning opportunities for primary schools. The Waterwise Schools Program provides participating schools with free promotional resources, competitions and a ‘waterwise’ accreditation if the schools include water education in their curriculum, participate in national water week, promote community awareness and have developed an action plan. The program is professionally delivered to schools via specialist water educators working for Cascade Environment Centre (Hydrosphere Consulting, 2020c).
The Gold Coast City Council ‘School Water Saver Program’ is available online only and includes worksheets, lesson plans, activity sheets and teaching resources for early childhood, primary and senior grade levels. The lessons discuss water as a valuable resource, the sources of water, using water wisely under urban demand management, alternative water sources such as recycled water and sustainability. Lesson plans for grades two, four and seven align with the Australian curriculum.
Seqwater delivers a comprehensive water education program and online portal called ‘Up a Dry Gully’, aimed at primary and secondary school teachers and students. Learning experiences are held at major Seqwater dams and water treatment plants and cater to primary and secondary schools, TAFE and university groups, as well as professional delegations and community groups.
The RDMP school education action involves external partners delivering school education programs rather than council resources with limited participation from schools.
Other common methods of raising awareness and promoting water efficiency include:
• Water saving information on water bills
• Tours of water supply and sewer facilities for schools and members of the public.
RDMP Background information and recommended plan components Page 17
• Consumption targets campaigns (e.g. TSC’s ‘Target 160’ [L/person/day] campaign)
• Water saving programs or audits targeting high residential or non residential users
• Assisting businesses (non residential customers) to prepare Water Efficiency Management Plans.
Recommendations:
• Customer engagement should include actions that increase customer awareness of water consumption, encourage water efficient behaviours and promote the demand management program measures to increase the success of their implementation. Customer engagement would be enhanced once smart metering has been implemented.
• Education activities are directly linked to the customer engagement program, encouraging and supporting water efficient behaviours. Education components should be cost effective and designed to reach as many customer sectors as possible. The information available to customers (e.g. through websites, customer service centres and bill inserts) should be reviewed and updated regularly with links to consistent information (e.g. from The Water Conservancy or education websites). Other cost effective methods include the use of social media for information dissemination. Education should be undertaken in parallel with other customer engagement activities such as audits. General education activities should include materials targeting households, non residential customers and high residential and non residential users.
• As school students are the customers of the future and can encourage water efficiency in the home, a targeted and well-resourced education program for primary and secondary schools should be developed and delivered directly by either internal or external staff.
5.2 Permanent W ater C onservation
Unlike other Australian states (e.g. Victoria, ACT), NSW legislation restricts the implementation of permanent water conservation actions to voluntary measures. Most NSW coastal water utilities have implemented permanent (voluntary) water efficiency measures, although the components are variable. For example:
• MidCoast Water has a ‘summer water savers’ voluntary program to help residents be waterwise during the summer through tips and promoting WELS.
• Permanent water conservation measures are imposed by many of the NSW local councils. The most common component of these measures is restrictions on unattended hoses during daytime (e.g. 10:00 am to 3:00 pm)
• Permanent water conservation measures were in place in south east Queensland from December 2009 until 2013 These were introduced by the former Queensland Water Commission (the agency formerly responsible for setting water restriction policy and coordinating water infrastructure projects in the state) following extended periods of drought and water restrictions in the preceding decade (Seqwater, 2016)
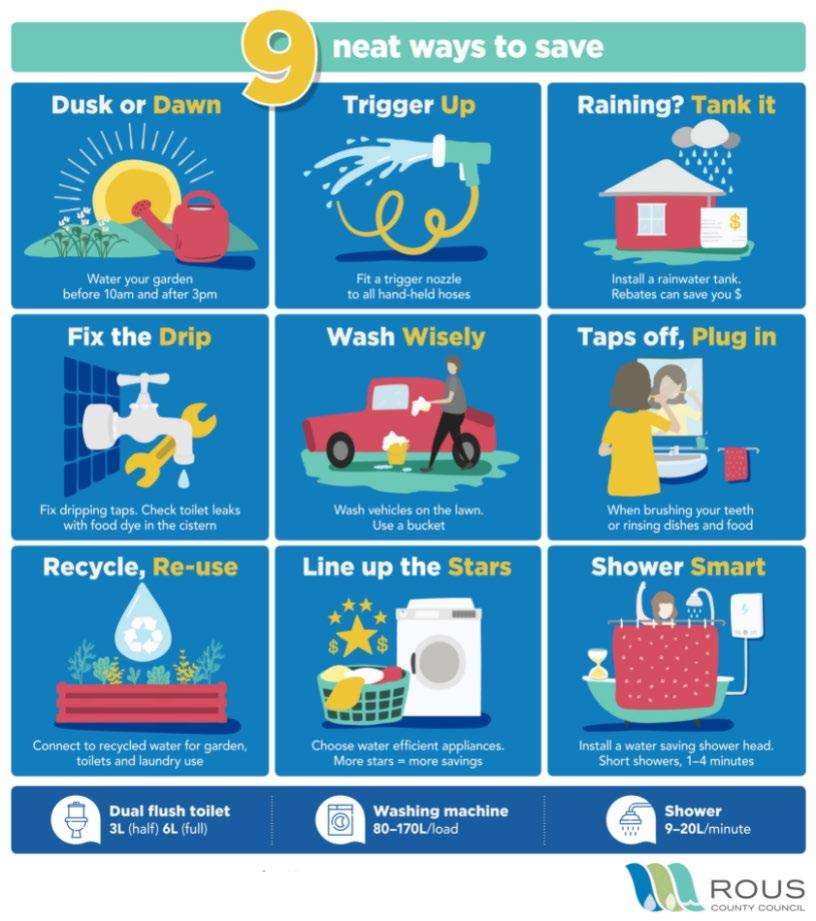
• RCC and the constituent councils have adopted “every day water saving measures” (Figure 1)
RDMP Background information and recommended plan components Page 18
Figure 1: Rous region every day water saving measures
Recommendation:
• Ongoing sustainable and sensible water use should continue to be promoted through voluntary permanent water conservation measures as Level 0 in the drought restriction policy to assist with promoting sensible water use, provide a link to the drought restriction policy and support other program measures.
RDMP Background information and recommended plan components Page 19
5.3 Rebates and I ncentives
There is a natural trend towards water efficient fixtures and fittings driven by market, regulation and customer preferences. Water efficient fittings and fixtures are now readily available and the benefits of replacing inefficient fittings and fixtures through rebates are therefore reduced. The reduced effectiveness of rebates is being recognised by most water utilities and in many cases these programs are being phased out or modified to increase uptake.
The rebate programs of NSW LWUs are continually evolving with market forces and community preferences. Rainwater tanks provide opportunities for reduction in demand during normal climatic conditions (i.e. when household rainwater tanks are refilled by rain). During droughts, the effectiveness of rainwater tanks diminishes with larger tanks able to store more water for dry periods. The BASIX requirements will address any demand reduction opportunities from rainwater tanks in new developments and rebates can assist with encouraging water efficiency in non BASIX houses. Many rainwater tanks in the Northern Rivers region failed in the drought of 2019/20 and customers relied on town water supplies during these times. In addition, rainwater tanks installed as part of BASIX for internal uses are required to include potable water top up systems.
In NSW, the use of a rainwater tank is not recommended by the State Government for drinking, cooking or personal washing if there is a potable supply available. Studies (e.g. McBeth, 2011) conclude that water use of houses with rainwater tanks is highly variable with water savings dependent on many factors, not simply the tank volume and connections. McBeth (2011) noted that people who install large tanks yet do not connect them for all of house use, seem to develop high water use habits, with high rates of demand for reticulated water when the tanks are empty. The analysis and evaluation of water meter data before and after installing a rainwater tank (by RCC as part of a 2020 rebate survey) reiterated the complexities of water consumption, demand and identifying opportunities to maximise water savings associated with rainwater tanks The RCC survey also found that 28% of the respondents would have purchased a rainwater tank without the rebate. The impact of an incentive on someone who would have made the change anyway (e.g. bought a rainwater tank) is called free riding in the behavioural economics literature Rainwater tank rebates are being phased out by many LWUs due to the low cost effectiveness (refer Appendix 4). Most water utilities include policies on rainwater tank use in urban areas even if there is no rebate offered. Many NSW councils offer other rebates including:
• New for old showerhead exchange/rebate
• Dual flush toilets
• Taps/tapware
• Aerators/flow controllers.
• Outdoor watering fittings. There are many products on the market designed to reduce water use through either inadvertent wastage (e.g. a hose connection bursting off the hose) or reduced consumption (e.g. through design of sprinkler heads). The Water Conservancy website (Smart Approved WaterMark - The Water Conservancy ) provides information on certified water efficient products for leaks, glasswashers, greywater, pool and spa, garden, plumbing, watering, cleaning, car washing, bathroom, rainwater and analytics.
RDMP - Background information and recommended plan components Page 20
Sydney Water is proposing a stronger focus on water conservation and efficiency (with investment of $23 million p,a. which is considered to be a low cost for Sydney Water) through measures such as (DPIE, 2021):
• Supporting households to save water, such as buy back programs for inefficient appliances, installation incentives and maintenance services for rainwater tanks, free repairs to leaky taps and fittings, and helping people to use water more wisely (and make better use of stormwater) in their gardens.
• Encouraging businesses to save water, including water saving action plans and audits, replacement programs for inefficient commercial appliances and help to find and fix leaks.
Recommendations:
• Incentives should be offered directly to high residential water users based on the outcomes of the pilot programs
• Programs should be considered for vulnerable or financially disadvantaged customers with older water intensive products.
• Marketing of any adopted rebate program and cross-promotion with other measures should be included to increase uptake and awareness.
5.4 Undetected L eak P olicy
Many water utilities provide reductions for high water bills due to undetected leaks. The aim is to incentivise customers to fix leaks they might otherwise ignore RCC, LCC, RVC have adopted similar policies with varying conditions and refund amounts) Some LWUs also apply a process to alert customers of higher than normal water meter readings
Recommendation:
• As the financial assistance can be used to encourage property owners to repair leaks, the undetected leak discount policies should continue with ongoing review of the expenditure and water savings. However, once a smart metering program is in place with more immediate identification of leaks, the policy should cease as leaks will be easily detected.
5.5 Water Loss M anagement
The International Water Association Water Loss Taskforce (WSAA, 2019b) has developed Four Pillars of Leakage Control. The pillars represent best practice for reducing real losses and promote four different strategies that can be used to minimise leakage. These include:
• Pressure management the rate of leakage and new burst increases with pressure (including cyclic pressures).
• Active leakage control requires monitoring of flows in a metered area to identify leaks and repair before they become a greater issue.
• Pipeline and assets management includes material selection, installation, maintenance, rehabilitation and replacement, and commonly associated with renewals.
• Speed and quality of repairs repairs should be done quickly and to a suitable standard.
RDMP Background information and recommended plan components Page 21
Mains renewals are usually targeted and the elimination of background leakage is an unaccounted benefit of this expenditure. As it is neither practical nor cost effective to renew all mains, some leakage is unavoidable. The implementation of pressure management has a positive impact on the other strategies used to control leakage (e.g. active leakage control, asset management and repairs) and can be used to reduce the annual ongoing costs of the leakage program. Sectorisation of the system to create district metered areas or zones is another method of facilitating leak detection Some councils separately meter districts allowing them to detect potential leaks and estimate their general location when analysing water balances. District metering areas (DMAs) are made up of a discrete number of properties and are usually bounded by closed valves so they can be monitored and managed as separate areas. DMAs are used in most countries around the World and they have been extensively proven to assist in reducing leakage in a water supply network (Watercare, undated). Emerging trends targeting reducing water losses from leaks include installing smart meters in houses and cloud based management software e.g. TaKaDu which shows real time data of meters and uses predictive analytics to detect potential leaks.
Pressure management is a fundamental strategy to leakage control. It is widely accepted that pressure management has the benefit of reducing NRW and frequency of bursts and leaks (WSAA, 2019b). In 2011, WSAA completed a three year study into leakage and pressure management, finding that pressure management has a three fold benefit water conservation, reducing costs to the water utility and improving outcomes for the customer. Pressure reduction is most commonly achieved through the implementation of DMAs coupled with pressure zoning.
While active leakage control assists with early detection, not all water supply systems are actively monitored. Digital monitoring and smart meters are increasingly being trialled and used for this purpose. To complement the technology solution, some water utilities are making it easier for customers to monitor their own consumption, report leaks and ensure the process is streamlined to reduce the impact on the customer (Hydrosphere Consulting, 2020a) This would be particularly relevant to a behaviour change program (Section 7) where people are encouraged to detect, fix and report leaks.
Recommendation:
• Each council should implement a water loss management program building on existing programs and infrastructure already installed including data collection and water loss analysis, district flow metering and data analysis, pressure management, active leak identification, timely leak repairs and pipeline and asset management with consistent indicator definitions across the region
5.6 Pricing
The NSW Government’s best practice pricing policy includes the following components (NSW Office of Water, July 2014):
• Full cost recovery consistent with financial plan, positive economic real rate of return (ERRR)
• Volumetric pricing with no free allowance, two part tariff fixed availability charge and one usage charge (per kL) for all water use (residential and non residential).
RDMP Background information and recommended plan components Page 22
• A significant proportion of revenue is recovered from volumetric prices target of 75% residential revenue from usage charges for larger (>4,000 connected properties) LWUs and 50% for smaller LWUs
• All free standing and multi unit residential developments (both strata and non strata) built after July 2007 have separate meters.
• Billing at least three times per year. User pays pricing is now almost universal in Australian cities and the use of inclining block tariffs sends stronger pricing signals to urban high water consumers (refer Section 6.3)
RCC’s bulk water sales revenue from the constituent councils and direct retail customers is calculated on the gross dollar yield required to fund bulk water supply activities. The constituent council contributions to the required revenue are calculated based on prior year consumption. This bulk pricing structure does not support water efficiency measures as there is no direct signal to customers related to consumption and no incentive for the constituent councils to reduce overall consumption or water losses.
Recommendation:
• RCC should review the bulk pricing structure in consultation with the constituent councils considering demand reduction signals and mechanisms to support other demand management measures.
5.7 Smart M eters
Currently manual reading of customer water meters is undertaken for the majority of the Rous region on a quarterly basis While this may be adequate for billing requirements it provides limited information on actual water use behaviour and leakage. In some areas, customer meters are remote or difficult to access and remote meter reading is employed in these areas
A smart meter is a normal water meter connected to a data logger. It can allow for the continuous monitoring of water consumption for the water utility and the customer to assist in demand management. Smart metering remotely collects water flow data that would otherwise require a manual reading through a data logger. It sends the water data via a signal where it can be viewed in a web interface in near real time. Loggers can either be connected to existing meters or integrated purpose built smart water meters that have mechanical or electronic flow measuring, volume recording and communications capabilities in one device. Many communications networks are designed for higher throughputs, data capacity, network speeds and instant access such as those used for mobile phones. Newer wireless network technologies are designed for low power devices sending small amounts of data at regular intervals. The three broad categories of network systems are (Water Directorate, 2017):
• 3G or 4G LTE networks which have a built in SIM card which communicates with the nearest cell tower in range.
• Low Power Wide Area Networks designed to provide long range communications to widely distributed low cost and low power (battery powered) sensors.
• Single vendor systems such as Taggle and Itron which own, maintain and operate wireless radio networks that make data collection from their devices possible through low power and long range
RDMP Background information and recommended plan components Page 23
communications. Radio receivers are strategically placed across the network. Low cost transmitters connected to water meters or integrated smart meters communicate data at regular intervals to receivers. Data is then passed on to the corresponding cloud server from where it can be forwarded to SCADA, GIS, etc.
New software developments allow users more flexibility with a variety of logging devices that are able to deliver data to different portals via specialised integration middleware. Connectors convert the file format exported by the logging device or network server to suit the file format accepted by the display platform, data hosting, and other systems. The software or website portal is the place where data collected by the loggers can be viewed and analysed (Water Directorate, 2017).
Smart metering and “big data” have the potential to increase efficiency and productivity in the water industry through reduction in under billing caused by undetected meter degradation, earlier identification of leaks and frequent, timely and actionable provision of information empowering customers to better control and understand their water use. Beal and Flynn (2013) found that the role that digital water metering technology such as smart metering and intelligent water networks, including information/communications technology, has in terms of operational efficiency, demand management, customer service and staff resource optimisation is increasingly recognised by water utilities, research institutes and governments in developed nations. However, in practice this has not necessarily translated into a solid business case, especially for many of the smaller water utilities. There is also limited understanding of the benefits of the technology by the customer who is the end user of this technology. However, moving toward the digital age of water management is widely considered to be an inevitable reality and in order to most effectively adopt information/communications technology as an enabler for smart water management, the practical, economic, social and environmental implications of implementation need to be understood
A report on smart water metering technology was commissioned by the NSW Water Directorate (Water Directorate, 2017) to assist NSW local water utilities in their decision making process for future smart metering projects. The report provides an overview of the current smart meter technologies in the market and assesses their reliability, performance and opportunities for urban and rural applications. Water Directorate (2017) found that the interoperability offered by “Internet of Things” technologies makes it easier than ever for utilities to implement a smart metering project in stages. A utility could choose to implement a smart metering system for just one area now and integrate remaining areas later, as budgets become available and particular needs arise including water meter replacements due to old age. Water Directorate (2017) also included an overall evaluation matrix which rates cost, maintenance, security, lifespan, flexibility, and integration abilities of the different smart metering technologies available.
Many Australian and overseas water utilities have implemented smart metering programs on a wide scale (e.g. Watercare, NZ, SA Water, Mackay Regional Council, Hunter Water, Cairns Regional Council).
In order to better understand the scope for water savings and wider regional implementation, a pilot of smart water metering was conducted by RCC with high water users (greater than 5 ML/a) from 2014 to 2017. Ten non residential customers were selected to be involved in the Smart Metering Pilot Program including council owned and operated facilities. A review of the pilot program identified the need to:
• Select customers who are motivated and have the right approach.
• Ensure customers have high water usage and water meter sites are suitable for a smart meter.
RDMP Background information
recommended plan components Page 24
and
• Engage customers by clearly defining what is involved, the roles and responsibilities and communication processes.
• Provide adequate and ongoing training.
• Maintain regular contact with participants. The smart metering pilot project was effective in obtaining water savings between 10 15% for those customers who were adequately engaged and motivated (Hydrosphere Consulting, 2018).
A review of demand management options by Stantec (2021) noted that water savings attributed to smart meters may be the result of communication and engagement with the customers rather than from the use of the smart meters alone. Monks et al. (2019) identified seventy five benefits of digital water metering. Of these, fifty seven were potential benefits to the water utilities and forty were of potential benefit to customers, with twenty two benefits common to both customers and water businesses. Eight system, process, or resource changes were identified by Monks et al. (2019) to achieve successful digital water metering. The changes required to achieve the benefits were also listed against each benefit (eight enablers) to provide a framework in which water utilities might focus attention to identify those benefits that are relevant to their operation and customers. The eight enablers (changes required to enable the various benefits to be achieved) are listed in Table 5
Table 5: Enablers (changes required) to enable benefits to be achieved from digital water metering
Source: Monks et al. (2019)
WSAA also identified the many benefits of digitalisation and also challenges and risks as shown in Figure 2 These recent studies have concluded that realising the full potential of digitalisation requires a more integrated council business, both internally and externally. This has implications for not only the business structure and supporting business tools but the culture and skills required to deliver them. Externally, the changing nature of customer interactions and expectations are moving towards ever greater transparency and the need to source information in real time where possible (WSAA, 2018). The progressive development of digitalisation was identified by WSAA through the development of a Digital Utility Roadmap in which a four part approach to digital maturity is proposed (refer Figure 2). WSAA advocates preparing the internal business for digitalisation before jumping to an external focus to improve the ability to store, manage or extract the maximum value from the data collected and systems installed.
RDMP Background information and recommended plan components Page 25
Figure 2: The four components of a mature digital water utility, from an internal focus (left) moving to an increasingly external focus (right)
Source: WSAA (2018)
A detailed study undertaken for RCC and its constituent councils (Reid and ecodata, 2019) also considered that the water utilities should not be committing to a fleet wide smart meter solution in the short term due to the limited technologies and vendors with a proven track record at that time. However, in the near future there will be more mature and non proprietary technology options and several service providers to choose from. Many LWUs, including Sydney Water and the Melbourne water supply authorities, have all reached the same conclusion and are continuing to trial and pilot technologies while they develop strategies and plans to accommodate and make the best use of smart meter data in their businesses This will ensure that data can be used in a planned and orderly manner with maximum value extracted for the benefit of all business units and customers. Comprehensive digital utility transformation and “Internet of Things” strategies need to be developed, approved and promulgated well before committing to a smart metering solution.
WSAA (2018) believes the most critical risk for the digital utility is people, both in terms of change management and access to skills. Digitalisation presents some level of business disruption and it is essential that the change is well managed by staff. This includes good communication, consideration of cultural aspects and ensuring the right skill set to support the business moving forward. Skill shortage is an emerging risk as many businesses (not just water) simultaneously embrace the digital age and data analysts become in high demand. This is possibly more acute because the skills likely to be valuable in a mature digital utility such as IT, technology and data analysis have not traditionally been core business functions for water
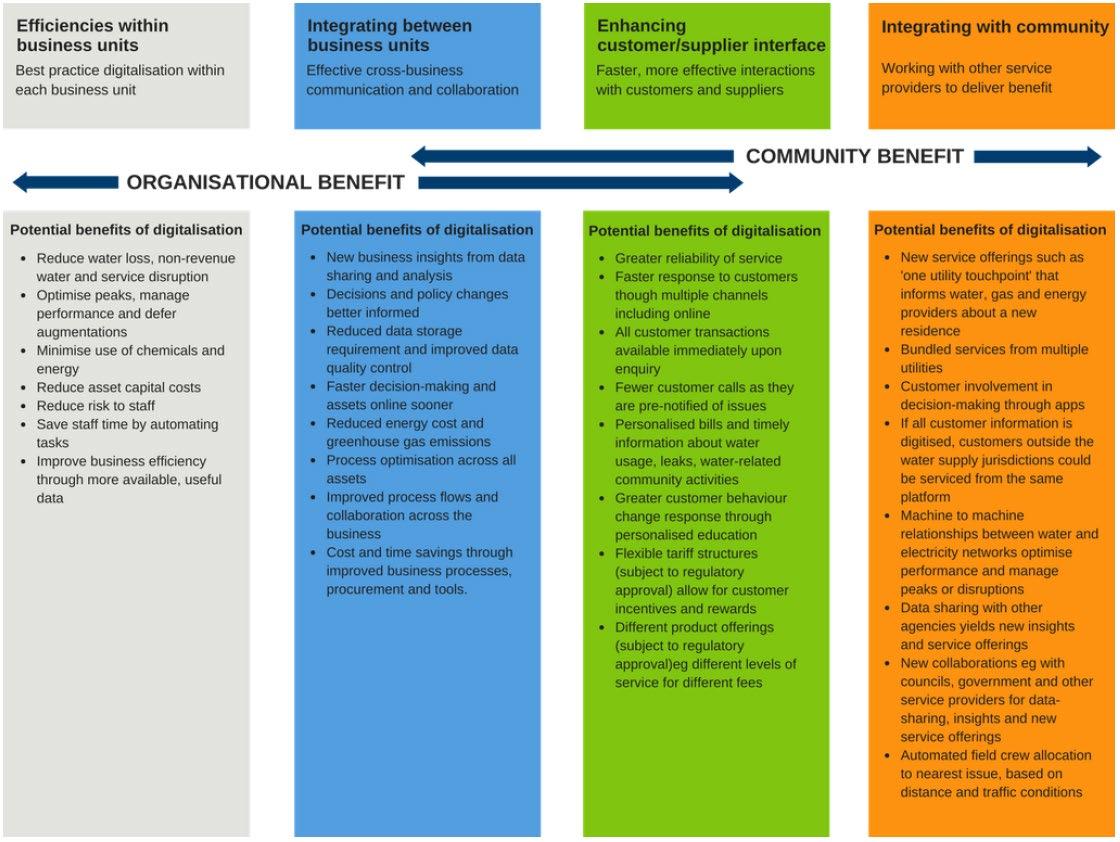
RDMP Background information and recommended plan components Page 26
utilities. The digital age is challenging water utilities to expand skill sets and engage with a new set of experts to extract maximum value for customers and businesses.
Recommendation:
• Full implementation of smart metering will require significant investment, staff resources, training and a significant amount of time. It is noted that the application and benefits of smart metering and infrastructure development are not restricted to the demand management functions of each council. A staged implementation process is recommended following the lessons learned from other water utilities.
5.8 Municipal Water Use
Some NSW Councils are recognising the need to provide leadership to the wider community in water efficiency measures. TSC, CVC and CHCC are developing actions as part of water efficiency planning that relate to efficient use of water for irrigation to showcase opportunities to the community and lead by example. Other municipal councils have investigated ways to minimise water consumption during activities such as infrastructure maintenance, open space irrigation and facilities management.
Recommendation:
• The councils should develop improvement plans and showcase projects (across council buildings, infrastructure, operations and services) to demonstrate leadership and encourage customer water efficiency
RDMP Background information and recommended plan components Page 27
6. BENCHMARKING
6.1 Residential demand
A comparison of average residential water demand in the Rous region in 2019/20 with other LWUs is given in Table 6 from LWU performance indicator data published by the NSW Government (2021). In 2019/20, residents in Byron Shire had the highest demand in the region. Residents in Lismore and Clarence Valley had significantly lower demand than other LWUs Residential demand in the Rous region is higher than some neighbouring LWUs and higher than the NSW median. Data on average residential demand for the region between 2012/13 and 2019/20 is provided in Appendix 5. Residential demand has remained relatively constant over the last eight years with an average of 182 kL/property/a. The residential sector is the largest customer group in the RCC supply area with approximately 85% of connections and 76% of demand (excluding losses) (Hydrosphere Consulting, 2020c)
Table 6: Comparison of average annual residential water demand in the region (2019/20)
LWU
No. of residential water supply connected properties
Average annual residential water supplied (kL/property/a)
Ballina 14,698 168 Byron 9,518 200 Lismore 13,673 127 Richmond Valley 6,614 157
Median (Rous region) 11,596 163 Clarence Valley 24,612 115 Coffs Harbour 28,797 151 Tweed 32,544 177
Weighted NSW median1 21,069 156 Gold Coast 249,000 175
Source – NSW LWUs: NSW Government (2021). Reported performance indicator W12 - Average volume of residential water supplied per property. Includes potable and non potable water, recycled water and stormwater use.
Source – Gold Coast: BOM (2021)
1. The weighted median is the median of the available validated data for the indicator with the number of connected properties applied as weights.
6.2 Water L osses
A comparison of water loss indicators in the Rous region with other LWUs is given in Table 7 Definitions and additional data are provided in Appendix 5 Water losses in the Rous region are generally higher than neighbouring LWUs and the NSW median The total NRW in 2019/20 for the Rous region (including 207 ML/a for RCC) is reported as 2,104 ML/a (15.2% of total water supplied) Data on regional NRW for the region between 2012/13 and 2019/20 is provided in Appendix 2 The eight year average regional NRW is 2,214 ML/a (15.7% of total supply)
RDMP - Background information and recommended plan components Page 28
Table 7: Comparison of water losses (2019/20)
LWU Real losses (leakage) (L/d per service connection)
Leakage (kL/km/ day)
Main breaks per 100 km
Real losses (leakage) - (ML)
NRW (ML) NRW (L/day per connected property)
ILI1
Ballina 116 4.20 N/R 598 687 115 2.13
Byron 49 2.14 13 215 317 79 0.99
Lismore 78 3.09 53 391 593 106 1.11
Richmond Valley N/R 3.18 43 231 300 112 N/R Median (Rous bulk councils) 78 3.14 43 311 455 109 1.11
Clarence Valley 30 0.45 86 237 744 83 0.25
Coffs Harbour 44 1.58 11 421 459 44 0.43
Tweed 96 3.57 9 938 1,151 94 1.23
Weighted NSW median 58 2.34 12 540 687 82 0.77
1. ILI - the Infrastructure Leakage Index (ILI) is used as an indicator of how effectively real losses are being managed at the current operating pressure while accounting for other factors such as length of mains, number of service connections and customer meter location. The ILI is calculated from the ratio of the Current Annual Real Losses (CARL) to the Un-Avoidable Real Losses (UARL). CARL is the annual real losses divided by the number of service connections and percent of time the system is under pressure. UARL is a function of length of mains, number of service connections and average system pressure. An ILI of 1.0 indicates that only unavoidable losses are occurring and that optimum leakage management is in place.
Source: NSW Government (2021). N/R = not reported
6.3 Pricing
Pricing was not considered in previous regional demand management plans as water supply tariffs are set by the individual councils to achieve full cost recovery and related best practice requirements (Section 5.6). A comparison of water supply pricing in the Rous region with other LWUs is given in Table 8 Pricing is significantly higher in Lismore than other LWUs which may be the reason for lower demand (Table 6).
RDMP - Background information and recommended plan components Page 29
Table 8:
Comparison of water supply tariffs in the region
LWU 2019/20 2020/21 2021/22 Availability charge, AC ($ p.a.)1
Usage charge, UC step 1 (c/kL)
Res revenue from UC (%)2
AC ($ p.a.)1 UC step 1 (c/kL)
Res revenue from UC (%)
AC ($ p.a.)1 UC step 1 (c/kL)
UC step 2 (c/kL)
RCC 168 243 N/R 175 253 N/R 179 263Byron 187 260 72% 190 280 73% 196 288Ballina 204 229 65% 209 235 63% 216 243 365 Lismore 292 402 67% 303 409 67% 326 444Richmond Valley 161 245 73% 169 257 N/R 180 274 417 Median (Rous region)
187 253 70 190 257 - 196 274Clarence Valley 122 249 80 124 253 N/R 127 2.59 386 Coffs Harbour 147 305 77 149 3.18 77 152 3.25 488 Tweed 179 220 73 179 3.10 75 182 3.16 474 1. For 20mm service.
2. The NSW Government Best Practice Guidelines require 75% of residential revenue from usage charges for larger LWUs. Source: 2019/20 data - NSW Government (2021). 2020/21 and 2021/22 data – Council revenue policies and BOM (2022). N/R = not reported
Recommendation:
• The constituent councils should continue to set a pricing structure that encourages demand reduction and supports the initiatives in the RDMP.
6.4 Expenditure
RCC’s annual expenditure on demand management programs, administration and staff costs is shown on Figure 3. Between 2011 and 2016, RCC’s average expenditure was $371,500 p.a. Due to staff turnover, the expenditure decreased in 2017 and 2018 ($116,500 p.a.). The average expenditure for the RDMP 20192022 is $296,000 p.a.
RCC’s historical and budget future expenditure on demand management programs has been compared to the expenditure of TSC, CHCC and CVC in Table 9. The highest expenditure is highlighted red for each column in Table 9 RCC’s historical and future budget expenditure are higher than the average of the other LWUs (total, per property and per ML basis).
RDMP - Background information and recommended plan components Page 30
$450,000
$400,000
$350,000
$300,000
$250,000
$200,000
$150,000
$100,000
$50,000
Annual expenditure DM programs Administration/staff
$500,000 2011 2012 2013 2014 2015 2016 2017 2018 2019 2020 2021 2022
$0
Figure 3: RCC annual expenditure – demand management
Historical expenditure to 2021 is shown as solid blue and orange. Budget expenditure for 2022 is shown hatched.
RDMP - Background information and recommended plan components Page 31
CHCC 29,000 6,123 $147,000 $5.07 $24.01 $133,000 $4.59 $21.72 $206,000 $7.10 $33.64
CVC 25,000 5,295 $45,000 $1.80 $8.50 $89,000 $3.56 $16.81 $210,000 $8.40 $39.66
TSC 34,000 9,937 $322,000 $9.47 $32.40 $121,000 $3.56 $12.18 $166,045 $4.88 $16.71 RCC 43,000 10,727 $343,000 $7.98 $31.98 $211,000 $4.91 $19.67 $363,100 $8.44 $33.85
Average 32,750 8,021 $214,250 $6.08 $24.22 $138,500 $4.15 $17.59 $236,286 $7.21 $30.97
1. Source: NSW Government (2021)
2. No data for TSC 2013, 2014.
3. No data for CHCC and CVC for 2020
4. No data for RCC for 2023, 2024
The highest expenditure is highlighted red for each column.
Page 32
RDMP - Background information and recommended plan components
Table 9: Comparison of demand management expenditure (total programs and administration/staff)
$
$
LWU Total connected properties (2019/20)1 Total water supplied ML (2019/20)1 Average historical expenditure (2013 –2016)2 Average historical expenditure (2017 –2021)3 Average budget future expenditure (20222024)4
$/property $/ML
$/property $/ML $ $/property $/ML
7. BEHAVIOUR CHANGE
RCC is considering inclusion of a behaviour change program in the new RDMP. Specialist input provided by Liz Ampt of Concepts of Change has been summarised in the following sections
Behaviour change actions aim to produce a measurable and persistent reduction in water use in all households in the region The focus on voluntary behaviour change measures (Figure 4) recognises that infrastructure measures (engineering solutions) and top down demand measures should not be used in isolation and can be more difficult to implement successfully
Infrastructure measures (supply measures)
Voluntary behaviour change
Individual Goals or Drivers
Often needs Information and Tools of Change
Figure 4: Options for bringing about change
Source: Ampt (2012)
The tasks undertaken to date are:
Top down measures (demand measures) regulation pricing education/marketing technology or engineering
• Agree what we want to achieve – discussions with RCC and constituent councils.
• Build a picture of the situation through a literature review (Appendix 6) and focus groups (Appendix 7).
• Develop suggested approach emerging from these tasks and a recommended package of initiatives for inclusion in the RDMP (Section 7.3)
7.1 Current Behaviour Change Practice
In Australia, the voluntary behaviour change approach has been defined as ‘helping people to help themselves bring about change to an aspect of water use that has bothered them’ (e.g. Ampt et al., 2013). The underlying principles of the approach are summarised in Figure 5 which illustrates the processes involved in making sustainable voluntary behaviour change at an individual level but in the context of the household and community.
RDMP - Background information and recommended plan components Page 33
Figure 5: The conditions surrounding voluntary behaviour change
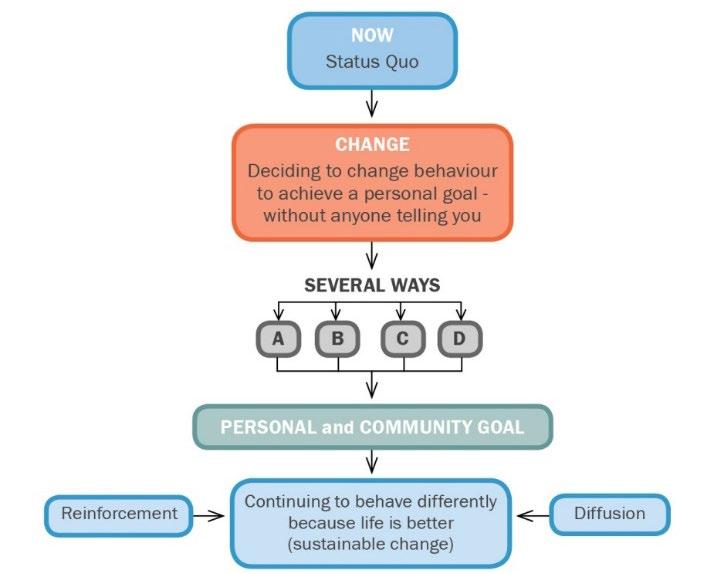
Source: Ampt (2003)
Voluntary behaviour change measures are those that allow the people who are targeted for change to find an issue (and reason) they would like to change their behaviour, and then to work out a solution that suits their lifestyle. As part of the program, this change is usually facilitated and accompanied by resources that assist change.
The strengths of this approach are:
• It is known to bring about high levels of behaviour change (refer Appendix 6).
• Since the targeted people are working out solutions that suit their lifestyle, they are more likely to continue the change in the long term
• Many changes cost the program organisers and the participants very little (e.g. allowing people to source information in a way that suits them rather than providing rebates)
• Participants can articulate the changes they have made in ways that explain the benefits they have experienced in their own terms.
• Because of the above, people are much more likely to use word of mouth to encourage further change. ‘Trusted others’ spreading a message is one of the strongest tools of change.
• The facilitation approach allows people to ask questions and gain relevant information which helps give them reasons for change, e.g. ‘how would I know how much water I’m using in the shower?’ might lead to them being given answers or resources (that suit them) to find the answer.
RDMP Background information and recommended plan components Page 34
The main weaknesses of the voluntary behaviour change approach include:
• The approach is generally seen to be more cost intensive than simply providing information or regulating although longer term cost benefit evaluation has shown very positive results (Ampt et al., 2013)
• It can be hard to understand that adding this approach to top down measures will result in higher levels of change
Recent research into voluntary behaviour change concluded that changes are most likely to be adopted and continued if the consumer makes a decision based on the ease of change to their lifestyle. Many voluntary behaviour changes programs have been implemented around Australia with varying results. The Water Corporation in WA created a behaving change ‘H2ome Smart Service’ program called the ‘Great Southern Project’, which was the most tangibly successful project documented in the literature review (Appendix 6) The program was completed over a nine-month period in 2011/2012, with the aim to support participants to take personal responsibility for changing their water consumption behaviour. A targeted group received information letters and a series of phone calls to discuss household water usage, provide guidance, advise changes and communicate new targets other people had committed to Over the period of the project, the estimated net savings were 60 L/person/day, an overall 21% reduction. The changes were a progressive experience for the participant and the positive message of change was passed through the community due to awareness of the project in the media, social diffusion and access to available tools Other Australian water utilities have implemented programs from a top down approach through community education campaigns, providing online tips and pledge campaigns. The recommended strategy to implement successful behaviour change is to employ an adaptive framework with top down approaches, suitable supply measures and voluntary behaviour change programs. A customised program will successfully allow individuals and households to create scenarios where they choose their own reasons for change and create their own plan for change using available tools.
The review of current behaviour change practice (Appendix 6) shows the importance of customising the program by allowing individuals and households to:
• Create a situation where they are facilitated to choose their own reasons for change.
• Form their own plan for change using both existing and potentially new tools. Research also provides lessons for which behaviours are likely to be more easily targeted in a behaviour change program as well as the need to continue to liaise with customers as their perceptions are often significantly different to those of water authorities. The literature review (Appendix 6) provides examples of state of the art programs throughout Australia with WA Water Corporation leading in behaviour change programs, with other states implementing tools that could also be incorporated in a program for the RCC region.
7.2 Focus Groups
As part of the investigation of potential behaviour change actions, focus groups were held with customers from each of the four LGAs Appendix 7 documents the recruitment process, outlines the discussion guide and the outcomes of the sessions. The process and outcomes are summarised below.
RDMP Background information and recommended plan components Page 35
The purpose of the discussions was to build a picture of the similarities and differences between customer perceptions, views and behaviour in the four council areas. The specific aims of the groups were to:
• Understand opportunities for change as well as issues and challenges.
• Understand perceptions of who provides the water, and where it comes from.
• Understand use of water.
• Understand if there is a behaviour they would like to change.
• Identify target groups.
• Get reactions to a water behaviour change program.
• Identify ‘tools’ for change’ (e.g. leaflets, online, courses).
• Listen for ideas of ways people think it might be implemented.
• Listen for ways they would prefer information sharing (about the project) and storytelling (within the community).
The key topics which were reviewed and discussed included water use around the house, water saving behaviour, discussion of volumes each participant estimates they used, discussion around ‘the purple pipes’ (recycled water), what actions the participants did differently during water restrictions, where they would find water saving tips, if they knew about smart meters, ask if they knew who supplied their water, and if they would permit their meter to be read.
The use of water around the house varied depending on life stage and household occupancy (between households with children, single person households and empty nester households). Most groups did not know the volume or frequency in which they used water for discretionary uses (e.g. watering gardens). Many could identify behaviour changes they had adopted previously (habits from childhood, growing up on tank water and being conscious) and participants were motivated to share ways they had or were making changes. This was identified as a significant action, as word of mouth is often an important factor in encouraging change. When participants were told that the regional daily demand target is 160 L/person, most participants could not visualise this volume, however participants were interested to understand how much water was used during relevant activities (e.g. average shower, washing up). During the drought, many participants adopted water saving changes, however, most did not continue after the drought had ended. Water saving program ideas were discussed and many were receptive. Smart meters were not well known but some participants were receptive of the concept. Most participants were unsure where to obtain information relating to water resources, information or tips. Similarly, most participants were unable to identify who supplied their water, which indicates that branding of any behaviour change, or education programs is very important.
7.3 Recommended Approach
The aim of a behaviour change program is to change the behaviour of residents to use less water and achieve a target (say 160 L/person/day) in the participating households in the first instance. Later in the staged approach, this target would be for the whole region. A particular target may also be reducing water loss (leakage) The recommended approach is to add the voluntary behaviour change approach to the current supply and top down measures implemented across the region which will continue to play an
RDMP Background information and recommended plan components Page 36
important role. The option of a ‘voluntary behaviour change’ approach which uses an individual’s goals and drivers to ‘help people to help themselves’ is recommended to complement these supply and top-down measures. Once the behaviour change approach becomes an option, the infrastructure measures will be easier for people to understand, and the right balance of top down measures will also be easier to implement.
Experience and other evidence from the literature review (Section 7.1 and Appendix 6) suggests that the following principles should be used to develop this voluntary behaviour change approach to achieve sustained change:
• A co design approach
• An approach based on ‘implement, evaluate, learn and adapt’
• A program of individual conversations with individuals and households about their water use, complemented by available tools (including information) to assist them with change.
A co design approach is one where people who will use a particular service or product are involved in the design of that service or product. This means that the design of the package of measures and the way they are introduced needs to include the key stakeholders (RCC, the constituent councils) as well as the residents who will be targeted. The focus groups and discussions with the councils suggests that there are sufficient differences between council areas (and residents) that this process should be undertaken in each council area separately. After an initial approach has been planned, a focus group in each of the target areas would help refine the details of the intervention and the likely tools that will be needed to assist long term change. A tool is anything that assists a person or household to make a change:
• Information e.g. the impact of water losses in a household, how to detect leaks, how much water is used in a shower This could be delivered on paper or via specific links to a website. Information needs to be specific to the needs of the person (i.e. if they want to understand how much water is used in the shower, they do not need large amounts of information on other issues)
• Services e.g. water use audits.
• Technology e.g. smart metering, low flow shower heads
A strategy that involves implementing, evaluating, learning and adapting would include defining outcome measures and the method of evaluation (impact vs process) and exploring opportunities where ‘uncertainty’ and ‘flexibility’ are embraced. This will reduce risk in future resource allocation and decision making and scaling up will be easier when appropriate (Figure 6). By adapting and being flexible in the first stage of implementation, uncertainty will reduce over time making resource allocation more reliable. Similarly, flexibility can reduce over time because there will be more knowledge about the way the initiative fits the application.
RDMP Background information and recommended plan components Page 37
Uncertainty
Flexibility
Resource allocation Intervention Fit
Figure 6: The benefit of the implement, evaluate, learn and adapt process
The recommended approach is to begin as a pilot program for future larger programs or initiatives which fits well into a staged framework. Since the aim is to start with a small study, modify as needed, and then roll it out, it is recommended that each council nominate a small, clearly defined target group of households. Ideally this group has some type of social interaction so that behaviour can be reinforced by ‘trusted others’ rather than only the program’s representatives. Examples might be:
• Working with particular groups to involve First Nations communities (e.g. local Aboriginal land councils or corporations). The approach needs to be tailored to the community.
• Choosing an interactive community group such as:
o A club (e.g. Rotary).
o An over 50s community/estate.
o A school community.
o People associated with a community centre.
The target group could be of any size, but ideally should involve at least 50 – 100 households so that sufficient data is obtained to measure the success of the program. In each case the target should include all people in the nominated group, not a sub sample. Where possible, a control group should also be selected.
Once the target group has been selected, the following steps would be involved:
• Group discussions to determine the best initial approach.
• Use the initial approach to let people know about the program.
• Initial measurement of water use at the target households.
• Initial conversation with one person from each target household.
• Feedback given to the household in a form decided on at the outset of the program.
• At least one, but preferably two follow up conversations.
• At the end of the coaching/conversation phase, participants would receive feedback on the overall achievements of the program in their area.
For each household in the target area data would be collected including:
• Number of people in the household
RDMP - Background information and recommended plan components Page 38
• Water use for a nominated period for simplicity, this period could be quarterly to match meter readings but extra reads should be undertaken to provide a more rigorous analysis
• Ideally water use for previous years at that household would be compared so that seasonal variation could be accounted for
The measurement of water use has two purposes monitoring the success of the program and making it possible to give participants feedback on their own water use and to compare it to others in their region. Measurement would be recorded before the commencement of the program, during its implementation and after. Ideally, these details should be obtained for all households in the target area (whether they participate or not) so that good forecasts for a roll out program would be available.
The time frame for implementing a pilot program will depend largely on the frequency with which meter reads can be done. At least 12 months would be needed to get sufficient data as well as feedback data. Participants also need to have sufficient time to implement the actions they have agreed to.
The cost of these initiatives includes the following components:
• Input from council staff and a either a consultant or dedicated staff member to set up the program (including finding targets, liaising with the group, working out approaches, etc.).
• Training of conversationalists
• Preparation of any tools that might be needed for specific council areas These are sometimes already available or can be used (with permission and minor alterations) from other programs in Australia
• Conversations.
• Analysis of data and preparation of feedback
• Additional meter reads (if needed)
• Reporting.
The costs for set up, analysis and preparation of tools would largely be fixed, while implementation costs (including preparation of feedback) will depend on the size of the target group. It is likely that the set up costs (most of which could contribute to future programs) would be $100,000 $120,000 but could be reduced with collaboration between councils and use of council staff resources. Based on previous projects, the additional cost for program implementation would be about $160 $170 per participating household.
Recommendation:
• A customised pilot behaviour change program should be designed and implemented for a small sub set of the residential water supply customers in each of the four LGAs to contribute to the success of other water supply and demand reduction measures and ensure sustained water efficiency behaviours are identified and supported.
RDMP Background information and recommended plan components Page 39
8. RECOMMENDED RDMP COMPONENTS
8.1 Recommended RDMP Objectives
The objectives of demand management in the region are to reduce normal consumption and average supply requirements in order to reduce the urgency of water source augmentation. The RDMP actions should also aim to increase awareness of the value of water and level of customer consumption. Innovative approaches should be used to improve the success of the RDMP actions over time. Pilot programs should be used to test uncertainties and prove effectiveness of potential new or modified actions. Sufficient resources should be allocated by each council to ensure successful outcomes
8.2 Recommended RDMP Approach
The RDMP should:
• Provide an effective, flexible and adaptable approach to efficient water use.
• Build on successes of previous water efficiency actions.
• Learn from previous experiences.
• Utilise a consistent regional approach (where appropriate).
• Align with best practice requirements and methods
• Align with community desires.
• Demonstrate leadership through council actions
• Include a strong community engagement focus.
• Continue to further develop the region’s water conservation culture to stimulate the community, particularly high water users, to take action.
• Develop more comprehensive understanding of water demand trends to inform demand management planning through reporting, monitoring and evaluation and alignment with best practice.
Future reduction in demand is likely to be more difficult to achieve. To address this, the RDMP should include:
• Increased communication, promotion and customer engagement to increase uptake of the programs.
• Improved implementation and reporting processes to support the available resources for delivery of the actions.
• A stronger regional focus to achieve improved implementation and commitment to the actions.
RDMP - Background information and recommended plan components Page 40
8.3 Wa
ter Efficiency Targets
Clear and achievable targets can improve community understanding of water efficiency requirements as well as provide a measure of success to be monitored. RDMP targets should be developed and presented for each council and the region and should include:
• NRW (% and volume).
• Residential consumption.
• Key Performance Indicators (KPIs) to provide a measure of the success of the outcomes of the RDMP actions.
The development of targets was included as an action in the RDMP 2019 2022 but the limited data available and consistency across the region has proved to be a significant roadblock. Quarterly meter reading and billing does not provide adequate monitoring of reporting of customer based targets but can be used to monitor demand on a quarterly and annual basis and provide an indication of regional success. Smart metering will be required to support customer targets in the long term. Targets should be developed as data collection improves over the life of the RDMP Effective mechanisms will be required to monitor, report and evaluate the success of the demand management initiatives.
8.4 Target Customer Sectors
The RDMP should target the major customer sectors to ensure a broad focus and the highest water users to ensure maximum water savings:
• Residential customers as largest customer group.
• Council water uses to provide leadership.
• Water losses to reduce avoidable wastage.
• High residential water users to assist residents to improve water efficiency and reduce water/sewer bills
• High non residential water users to assist businesses and community groups to improve water efficiency and reduce water/sewer bills.
• Schools and the wider community to promote water efficiency measures.
• Targeted programs should be included to support the customers that cannot afford to reduce consumption.
8.5 RDMP Focus Areas
The focus areas for the RDMP should be:
1. Collection and analysis of detailed demand data accurate identification of water demand in terms of customer sectors and uses, short and long term climate influences and other drivers of demand and improved understanding of components of water losses.
2. Water loss reduction Water losses are high in the regional water supply area. A targeted program of pressure management, active leak control, pipeline and asset management and leak repairs
RDMP Background information and recommended plan components Page 41
should be implemented by the individual councils. This should be supported by improved data collection and analysis and digital integration. Residential programs should also be designed to include components which support residents to identify and repair leaks.
3. Implementation of smart metering with a short term focus on planning and developing systems and internal resources to achieve the many benefits of digitalisation such as reduced water losses, cost efficiencies due to task automation, improved service reliability and increased customer understanding and involvement across the full range of council services over the longer term.
4. Customer engagement programs targeting key sectors, schools, older properties with inefficient fittings and fixtures, household leaks or high water users with increased customer involvement, understanding and ownership of water efficiency requirements.
5. Pilot programs focusing on behaviour change to complement other supply and demand measures
6. Pilot programs to test the community desire, costs and benefits of residential retrofit programs for household and external water uses.
RDMP Background
recommended
components Page 42
information and
plan
REFERENCES
Ampt, E. (2003) Understanding Voluntary Travel Behaviour Change in Proceedings 26th Australasian Transport Research Forum, Wellington, NZ, pp.48 60.
Ampt, E. (2012) Voluntary Behaviour Change: an innovative way of gaining cost efficiencies, Waste Awareness, WasteMINZ, NZ 141, May 2012.
Ampt, E. (2021a) Behaviour Change Current Practice and Literature Review for Hydrosphere/Rous County Council, November 2021.
Ampt, E. (2021b) Focus Group Report and Outcomes for Hydrosphere/Rous County Council, October 2021.
Ampt, E., Neal, B., MacKellar, P. and Glyn Davies, R. (2013) Lessons on Behaviour Change Programs to Reduce Water Demand, Water Management 167(8):442 447.
Beal, C. D. and Flynn, J. (2013) The 2013 Australian Review of Smart Metering and Intelligent Water Networks. Report prepared for WSAA by the Smart Water Research Centre, Griffith University, September 2013.
Bellingen Shire Council (2012) Bellingen Shire Council Demand Management Plan
BOM (2021) National performance report 2019 20: urban water utilities, Part B, Bureau of Meteorology, Melbourne http://www.bom.gov.au/water/npr/, access November 2021.
BOM (2022) National performance report 2020–21: urban water utilities, Part B, Complete dataset, Bureau of Meteorology, Melbourne. National performance reports: Water Information: Bureau of Meteorology (bom.gov.au), accessed 2/2/22.
Brisbane City Council (2021) Water smart homes available at: https://www.brisbane.qld.gov.au/clean and green/natural environment and water/water/water smart homes, accessed August 2021
City of Gold Coast (2019) City of Gold Coast Water Netserv Plan Part A
City of Gold Coast (2021) Water supply, available at: https://www.goldcoast.qld.gov.au/Services/Water sewerage/Water supply, accessed August 2021.
Clarence Valley Council (2021) Water and sewage: Rebate program, available at: https://www.clarence.nsw.gov.au/Environment/Water and sewage/Rebate programs, accessed August 2021
Detection Services Pty Ltd (2015) Lismore City Council Water Loss Management Plan Lismore City Water Reticulation.
Detection Services Pty Ltd (2019a) Lismore City Council Water Loss Management Plan – Update.
Detection Services Pty Ltd (2019b) Ballina Shire Council Water Loss Management Plan. June 2019, V1.
Detection Services Pty Ltd (2019c) Byron Shire Council Water Loss Management Plan. June 2019, V1.
Detection Services Pty Ltd (2019d) Richmond Valley Council Water Loss Management Plan. June 2019, V1.
Detection Services Pty Ltd (2019e) Rous County Council Water Loss Management Plan. August 2019, V2.
RDMP - Background information and recommended plan components Page 43
DPIE (2021) Draft Greater Sydney Water Strategy - Water for a resilient Sydney, September 2021.
Hydrosphere Consulting (2013) Northern Rivers Regional Bulk Water Supply Study
Hydrosphere Consulting (2018) Regional Demand Management Plan: 2019 – 2022
Hydrosphere Consulting (2020a) Review of Tweed Demand Management Strategy Prepared for Tweed Shire Council, May 2020.
Hydrosphere Consulting (2020b) Clarence Valley and Coffs Harbour Regional Water Supply Water Efficiency Strategic Plan: Background Information, May 2020
Hydrosphere Consulting (2020c) Rous County Council Bulk Water Supply - Demand Forecast: 2020 – 2060, October 2020.
Hydrosphere Consulting (2020c) Clarence Valley and Coffs Harbour Regional Water Supply. Water Efficiency Strategic Plan, October 2020
Hydrosphere Consulting (2021a) Rous Regional Supply: Future Water Project 2060, Integrated Water Cycle Management Strategy, July 2021.
Hydrosphere Consulting (2021b) Integrated Water Cycle Management Strategy and Strategic Business Plan, 2021 Review, Eurobodalla Shire Council (draft).
Kempsey Shire Council (2021) Water and sewage, available at: https://beta.kempsey.nsw.gov.au/Services/Water sewerage, accessed August 2021
Logan City Council (2017) Water Netserv Plan 2017 2021 Part A
Logan City Council (2021) Water and sewage, available at https://www.logan.qld.gov.au/water and sewage.
McBeth (2011) Savings from Residential Rainwater Tanks on the NSW Far North Coast Monks, I., Stewart, R. A., Sahn, O., Keller, R. (2019) Revealing Unreported Benefits of Digital Water Metering: Literature Review and Expert Opinions
MWH (2014a) Future Water Strategy Integrated Water Planning Process. Prepared for Rous Water, July 2014.
MWH (2014b) Evaluation of demand management measures technical note. Future Water Strategy. Prepared for Rous Water, July 2014.
Nambucca Valley Council (2021) Water supply in the Nambucca Valley, available at: https://www.nambucca.nsw.gov.au/cp_themes/default/page.asp?p=DOC IIF 72 65 47#currentrestrictions, accessed September 2021
National Water Commission (2014) National Performance Framework: 2013 14 urban performance reporting indicators and definitions handbook
NSW Government (2021) LWU performance monitoring data and reports https://www.industry.nsw.gov.au/water/water utilities/lwu performance monitoring data, accessed October 2021.
NSW Office of Water (July 2014) Water Supply and Sewerage Strategic Business Planning and Financial Planning Check List
RDMP - Background information and recommended plan components Page 44
RCC (2020) Engaging high residential water users and households
Redland City Council (2014) Redland Water Netserv Plan Part A
REID and ecoDATA (2019) Rous County Council and Constituent Councils Smart Metering Report, 27 October 2019.
Stantec (2021) Independent Review of ISF Rous Sustainable Water Program Submission
Seqwater (2017) Water for Life South East Queensland’s Water Security Program 2016 – 2046
Seqwater (2018) Fact Sheet: South East Queensland’s Water Security Program.
Seqwater (2020) 2020 Water Security Program Annual Report
Seqwater (2021) Seqwater website, available at: https://www.seqwater.com.au/, accessed September 2021
Sunshine Coast Council (2021) Water Conservation, available at: https://www.sunshinecoast.qld.gov.au/Development/Building and Plumbing/Onsite Treatment and Greywater/Water Conservation, accessed August 2021.
Urban Utilities (2021) https://urbanutilities.com.au/residential/help and advice/save water at home
Unity Water (2021) Education, available at https://www.unitywater.com/community/education, accessed August 2021.
Water Directorate (2017) Report on Smart Metering Technology.
Watercare (undated) Auckland water efficiency strategy 2017 to 2020.
WSAA (2018) Harnessing the Digital Economy. A discussion paper for the Australia and New Zealand Water Industry.
WSAA (2019a) Water Efficient Australia
WSSA (2019b) Reducing Leakage in Australia
RDMP - Background information and recommended plan components Page 45
A BBREVIATIONS
$/kL Dollars per kL
BaSC Ballina Shire Council
BASIX Building Sustainability Index
BySC Byron Shire Council
c/kL Cents per kilolitre
CHCC Coffs Harbour City Council
CRM Customer relationship management (system)
CVC Clarence Valley Council
DEEC Dorroughby Environment Centre
DMA District metering area
ILI Infrastructure leakage index (ILI) is used as an indicator of how effectively real losses are being managed at the current operating pressure while accounting for other factors such as length of mains, number of service connections and customer meter location. The ILI is calculated from the ratio of the Current Annual Real Losses (CARL) to the Un Avoidable Real Losses (UARL). CARL is the annual real losses divided by the number of service connections and percent of time the system is under pressure. UARL is a function of length of mains, number of service connections and average system pressure. An ILI of 1.0 indicates that only unavoidable losses are occurring and that optimum leakage management is in place (NSW Government, 2021).
IWCM Integrated Water Cycle Management
kL Kilolitre (1,000 litres)
kL/a kilolitres per annum (year)
kL/d kilolitres per day
km kilometre
KPI Key performance indicator
LCC Lismore City Council
L Litre
L/connection/day Litres per connection per day
L/day Litres per day
LGA Local government area
LWU Local water utility
ML Megalitre (1 million litres)
ML/a Megalitres per annum (year)
RDMP - Background information and recommended plan components Page 46
NPV Net present value
NRW Non revenue water
RCC Rous County Council
RDMP Regional Demand Management Plan
RVC Richmond Valley Council
RWT Rainwater tank
SWPP Sustainable water partner program
TRB Typical residential bill
TSC Tweed Shire Council
WELS Water Efficiency Labelling Scheme
RDMP Background information and recommended plan components Page 47
APPENDIX 1 DEMAND MANAGEMENT MEASURES CONSIDERED IN THE DEVELOPMENT OF THE 2014 FUTURE WATER STRATEGY
RDMP Background information and recommended plan components Page 49
RDMP Background information and recommended plan components Page 51
Table 10: Demand management measures implemented by RCC prior to 2014
Measure Description Comments (2014)
Water utility benefit cost ratio
Community benefit cost ratio
Total community annualised cost ($/kL)
Estimated water savings (ML/a)
Residential home retrofit program
Residential plumbing inspections and retrofitwater efficient showerheads, tap aerators, check leaks, adjust toilet flush volume.
Program 1 – 1997 – 1999: 1,874 households, program 2 – 2001 – 2008: 3,902 households. Later delivered as part of NSW Government Enviro Saver program (subsidised).
Rainwater tank rebate
Varying funding levels since program inception (2003 onwards). Additional rebates were offered for larger tank sizes and if connected to toilets and washing machine.
Uptake diminished significantly since the state government rebate ended. Increasing rebate may improve uptake. Although numbers have dropped, most applicants reported that the existence of the rebate influences their decision to install a tank.
3.8 1.2 $5.80 70
Dual flush toilet rebate
Rebates of $50 offered to customers for the replacement of a single flush toilet or cistern with a dual flush model. Between 2004 and 2013, 1,762 rebates were paid.
Other influences (e.g. toilet repair, renovation) also trigger replacement of toilets.
6.8 1.2 $2.70 30
Page 52
RDMP - Background information and recommended plan components
No plans to reintroduce Not assessed Not assessed Not assessed Not assessed
Measure Description
Comments (2014)
Water utility benefit cost ratio
Community benefit cost ratio
Total community annualised cost ($/kL)
Estimated water savings (ML/a)
Washing machine rebate
$50 rebate between 2003 and 2008, rebate was stopped in July 2008 due to budget constraints and the fact that the majority of new machines on the market were water efficient front or top loaders. The NSW government offered a similar rebate until June 2011.
Majority of washing machines on the market already water efficient.
Not assessed Not assessed Not assessed Not assessed
Mulch rebate
A rebate on garden mulch was offered 20072009. The rebate offered was $20 rebate for each full $50 spent on mulch, up to $100 rebate per household.
The rebate was very popular and had good publicity. A program like this also provides an important link between water efficient behaviour, particularly outdoor uses and a link between voluntary permanent water saving measures and incentives.
Not assessed Not assessed Not assessed Not assessed
Outdoor water efficiency packs
Showerhead rebate
Water saving garden packs were sold at a reduced cost to town water customers in the region ($10 for a $30 value)
50% of the combined cost of the showerhead and installation up to a maximum rebate of $50, average rebate amount $40. 2004-2014.
As above Not assessed Not assessed Not assessed Not assessed
Rebate influenced <50% of customers. 14.2 10.3 $0.60 10
Page 53
RDMP - Background information and recommended plan components
Measure Description
Water saving products rebate
Since 2011, rebates given for 29 Every Drop Water Savers, 18 swimming pool covers and 2 Cisternlink Aquasavers. Limited promotion
Comments (2014)
Water utility benefit cost ratio
Community benefit cost ratio
Total community annualised cost ($/kL)
Estimated water savings (ML/a)
Program was not as successful as other rebate programs potentially due to a lack of understanding or acceptance of these products in the community. Consider changing to focus on a specific product such as pool covers only or consider alternative products.
Not assessed Not assessed Not assessed Not assessed
Water loss reduction Implementation of 2012 Regional Water Loss Management report.
Excellent opportunity to reduce water use at a LWU level. Will require LWUs to implement Water Loss Program.
Not assessed Not assessed Not assessed Not assessed
Blue and Green Business Program
Designed to develop partnerships with non residential water users and result in on ground works to reduce potable water demand. Cost to RCC and the NSW Climate Change Fund $161,559 to provide savings of 55 ML/a over 3 years. Up to May 2012, 48 businesses had participated in the program.
Scope to add elements to deliver greater savings, increase involvement from LWUs to facilitate customer engagement, focus on major users
2.7 1.1 $1.80 70
Page 54
RDMP - Background information and recommended plan components
Measure Description
School and community education
A number of existing education programs undertaken by RCC targeting early childhood, primary school students, secondary school students, tertiary students and the general community. Media programs are generally focussed on the promotion of rebate schemes. RCC also participated in major community events reaching approximately 1,800 people.
Comments (2014)
Water utility benefit cost ratio
Community benefit cost ratio
Total community annualised cost ($/kL)
Estimated water savings (ML/a)
Continues to be essential part of program and evolves to suit changing curriculum and technology. Future community education/engagement must better integrate behaviour related messages with other programs and look for more effective technological solutions to deliver the messages to more specific target audiences.
3.0 3.7 $1.70 20
Voluntary permanent water saving measures
No enforceable measures unless required by water shortages. Designed to promote water efficient behaviour
Source: Adapted from MWH (2014)
Examine the implementation of mandatory measures in accordance with best practice requirements.
46.0 46.0 $0.10 50
Page 55
RDMP - Background information and recommended plan components
Table 11: Potential new demand management measures considered in the 2014 Future Water Strategy
Measure Description
LWU demand management plans
Councils to develop their own local plans. LWUs have direct access to their customer base and therefore have greater ability to influence major water users, open space irrigation, Council and LWU facilities as well as managing leakage within the LWU reticulation network.
Water utility benefit cost ratio
Community benefit cost ratio
Total community annualised cost ($/kL) Water savings (ML/a)
Enhanced Blue and Green Business Program
Audit and smart metering targeting customers >5 ML/a. Rebates provided for up to 50% of water efficiency measures implemented as a result of the audit.
11.4 7.0 $0.40 190
Pool cover rebate Provide rebate of up to $100 for pool covers for residential customers. 1.4 0.4 $9.10 1.0
Enhanced school and community education Various aims and components. 3.1 4.0 $0.70 70
Outdoor water efficiency packs
Produce water saving packs ($30) and sell them at a reduced cost ($10) to customers in the region. Program also includes a $20 rebate for every $50 spent on mulch, up to $100 rebate per household.
3.6 1.9 $4.30 5.0
Page 57
RDMP - Background information and recommended plan components
Not assessed Not assessed Not assessed Not assessed
Measure Description
Water loss reduction
LWUs to implement recommendations of 2012 Water Loss Management report. RCC to work with LWUs to develop targets related to best practice based on either NRW (%) or Infrastructure Leakage Index (ILI). These will then be agreed by LWUs as part of the Service Level Agreement. Water loss reduction is more of an operational issue and should be considered separately from the demand management measures in the future.
Water utility benefit cost ratio
Community benefit cost ratio
Total community annualised cost ($/kL)
Water savings (ML/a)
4.3 4.3 $0.48 591
Open space water efficiency
Irrigation audit of all open space sites and sporting ovals/fields, examine the potential for water savings through water efficient landscaping, evapotranspiration controllers and/or rain sensors and provide rebate for measures.
Two tiered pricing Review of LWU pricing structures as part of the individual Demand Management Plans.
Permanent low level restrictions
Enhanced rainwater tank rebate
Source: Adapted from MWH (2014)
3.6 2.2 $1.40 80
Not assessed
Not assessed Not assessed Not assessed
Mandatory permanent low level restrictions to replace the current voluntary measures. 46.0 46.0 $0.10 50
Offer the same level of funding that was offered when RCC experienced the highest level of rainwater tank rebate applications.
2.0 0.4 $5.70 140
Page 58
RDMP - Background information and recommended plan components
APPENDIX 2 NOTES FROM MEETINGS WITH COUNCIL STAFF

RDMP Background information and recommended plan components Page 59
REGIONAL DEMAND AND DROUGHT MANAGEMENT PLANS –REVIEW AND UPDATE
Meeting with Ballina Shire Council 30 September 2021
Attendance:
Ballina Shire Council (BaSC) Belinda Fayle (BF), Catherine Jost (CJ), Tara McGready (TM), Thomas Lees (TL)
Rous County Council (RCC) Kirralee Donovan (KD)
Hydrosphere Consulting Robyn Campbell (RC)
Discussion:
Customer management system:
• BF has worked with GIS team to spatially represent meter data
• Older unit blocks have one strata meter but coded by no. of units e.g. RST12. New blocks have master and sub meters. New stratas now require sub metering
• Most non res customers are individually metered. Approx. 4% yet to be sub metered.

• New tenancy act units need to be separately metered and pass on user charges.
• Performance reporting categories and definitions are used.
• Water billing register is not stand alone sits off rates system (Authority). BaSC will implement stand along system but there are currently inconsistencies between rates and water billing data
Communications:
• No ongoing communication strategy but issues are targeted e.g. drought through media, Community Connect, extra newsletters, water talk section (provided by RCC)
• National Water Week info from RCC or additional info.
• Water usage data on back of rates notice.
• Social media used to cross promote.
• Ballina Water website being merged into BaSC website
• Opportunity to make all website info and water saving tips consistent across all Council websites.
Drought engagement:
• Not high knowledge of RCC during drought, no RCC social media, tools were outdated and needed modernising.
• Social media needed as well as signs, letters etc.
• Ageing population but increasing use of social media.
• Limited print media, rely on Community Connect.
• Need to be flexible, combination of tools.
• Regular media kits from RCC during drought were good key messages, artwork, media releases etc.
• Consider SMS service similar to BOM, bushfire warnings.
Issues during drought:
• Exemptions were issued to some businesses but needed to develop consistent rules for region e.g. mobile car wash. Some businesses had different rules in different LGAs.
Page 1
• Many enquiries about access to water to fill RWTs, high water carter demand and delays. Need to consider how to meet demand. Rural customers are generally not on BaSC or RCC supply so can get forgotton until they need to access water during drought. RCC introduced water fill stations which were well received although these came during drought
• Enforcement of restrictions evidence needs to be collected, some warning letters were issued on basis of reports (friendly reminder) but no PINs issued Need commonality across region for enforcement If there was consistency across LGAs, BaSC would have appetite for enforcement with adequate resourcing this is going to be an issue if there isn’t dedicated resourcing. Maybe a shared resource?
• Enforcement can’t be resourced internally. Ballina Rangers were tasked with compliance another job on top of their normal work.
• Level 1 and 2 should be more about education, notices. Maybe only enforcement at Level 3+. What evidence is required to enforce restrictions?
• RCC restrictions were triggered earlier than dam level trigger, flexibility in plan but difficult to communicate/enforce Community was interested in dam level and following dam level on website but not always real time BaSC was waiting for RCC to advise if restrictions would be commenced Need lead time to communicate restrictions. Consider including inflow to dam as well as dam level.
• Rain experienced in urban areas between level 1 and 2 did not increase dam level as it did not rain in dam catchment. Consider publishing rainfall recorded at dam and inflow.
Wardell:
• Same restrictions as region.
• Very high demand due to use of filling stations RWT top ups (increased from normal 2 per day to 40 truck fills per day). Three BaSC filling stations managed by RCC.
• Increased groundwater extraction affected surface water availability e.g. farm dams, stock watering. BaSC considering supply of recycled water for stock use.
• Marom Creek weir level dropped with zero inflow never dropped before
• BaSC records daily weir pool level, manual against datum, plus inflow from DPI gauge upstream. Demand measured as WTP outflow.
• Secure yield assessment reported in CWT report (a climate change consideration was included although uncertain if this was based on the recommended climate change projection).
• No progress on augmentation
• IWCM gap analysis has been undertaken.
Smart meters (SM):
• Taggle system with repeaters/radio towers on reservoirs.
• New connection policy on exhibition. SM required for ≥ 32 mm meters, ≥ 3 units and recycled connections. Also opt in system for other customers
• Leak alerts based on night flow over a trigger level. Customers can opt in to hourly usage data provided weekly/monthly etc.
• Some larger customers have found leaks
• Additional maintenance requirements and technical expertise required for telecommunications devices/systems. Larger systems need increased resources, external person required to manage data.
• BaSC will consider other technology and systems e.g. maybe connect to RCC system.
• SMs are very useful in SWPP for leak detection e.g. caravan park
• Some limitations with billing, data supply, reporting etc. with Taggle system. Council has manipulated data and improved outputs.
Page 2
Recycled water:
• Customers outside policy area/new development areas can connect e.g. identified through DAs
• Retrofit is difficult unless major changes to house. Indoor connection is required to save water. Rebates are not high enough to encourage retrofit.
• Recycled water charge is 80% of potable usage charge.
• BaSC providing connection to West Ballina major users with new main. Some developments were conditioned for recycled water use. Can connect to residential subdivisions, car yards etc. at West Ballina as well. Potential targets for SWPP.
• Recycled water should continue to be promoted for growth areas in RDMP.
• BaSC original target was 80% of DWF, stable source of water. DPIE requirements for high water quality have been met.
• Indirect potable reuse could be considered as a source augmentation option instead of dual reticulation. Source augmentation options not included in RDMP.
Water loss management:
• Infrastructure for PRZs installed but not properly commissioned will be recommissioned.
• West Ballina pilot has identified leaks, also boundary valves audited and re seated to reduce leaks.
• Investigating how low night pressure can be. Fire services requirements to be considered. Aim to reduce avoidable losses.
• If water savings are experienced, PRVs will be rolled out across shire based on West Ballina pilot program.
• Meter replacement program backlog being completed. NRW expected to reduce in next meter reads.
RWT rebates:
• High during drought.
• Lots of variables to consider indoor/outdoor use etc. High cost of installation for unknown/low savings, low return on investment but still community desire for the program. Rebates are not sufficient to encourage installation.
• High cost of administration to process applications.
• Policy on auto top up of RWTs is required as part of rebate.
Education:
• Potentially reinstate resource for school education, could be combined with other catchment/water cycle education e.g. wastewater, waste, rivers etc. RCC role with council contributions or separate Council roles?
• Catchment trailer is not used much but is a good useful resource.
• Current program for environmental education grants but needs to be continuous source of funds.
• BaSC did facility tours pre COVID e.g. recycled water plant.
• Teachers are keen if it fits with the curriculum prefer external resource to deliver rather than teacher delivering prepared materials.
Growth:
• BaSC urban growth strategy is being reviewed to integrate with LGMS and local strategic planning statement North Coast Regional Plan is also being reviewed.
• Current growth estimates cover 25 years in new release areas and infill/densifying. Beyond 2045 to be considered in updated estimates.
Page 3
Data requested:
• Table of restriction exemptions/allowed activities.
• IWCM gap analysis.
• Number of customers connected to recycled water since 1 July 2019 new request.
Page 4
REGIONAL DEMAND AND DROUGHT MANAGEMENT PLANS –REVIEW AND UPDATE
Meeting with Byron Shire Council 29 September 2021
Attendance:
Byron Shire Council (BySC) Cameron Clark (CC), Dean Baulch (DB), Jason Stanley (JS), Anjila Finan (AF), Neil Ulrick (NU)
Rous County Council (RCC) Kirralee Donovan (KD)
Hydrosphere Consulting Robyn Campbell (RC)
Discussion:
Customer management system:
• Data on customers and consumption is available from billing/rates department. Lots of number crunching undertaken by AF to separate into customer types (definitions and categorisation follow performance reporting framework).
• Quarterly consumption readings are not useful during drought.
• Standard customer types are based on trade waste categories but not always correct if there is mixed usage e.g. Habitat. Need rates categories split up for different purposes e.g. recycled connections. Currently only one rates code but can have other factors applied for categorisation. Better definition of customer types and improved system are considered to be very important with many data applications Recycled water may provide opportunity to review and re classify connections.
Management during recent drought:
• Centralised admin resource required for customer approvals/exemptions, special circumstances this was very time consuming and needed consistency across region.
• Commenced template for non res water efficiency plans with each council to resource their development and liaison with customers. Will be a big job.
• Information provided to customers through BySC website with RCC coordination e.g. signs. Communication materials needed to be prepared from scratch so some delays experienced. Common themes across region was good. Need to be more prepared including resourcing and materials available.
Demand management plan implementation:
• WLMP developed with RCC. BySC has relatively good leakage. Some WLMP recommendations not yet implemented. PRV trials in Mullumbimby provided good results. PRVs to be implemented in other supply areas when resources available.
• Recycled water filling stations (4) are now available.
• Recycled water strategy is being reviewed to comply with STP consent conditions. With transfer from Ocean Shores STP to BV STP, more water will be available for recycling (5 10 years) Will be environmental flows focus but also target big water users and filling stations will offset some potable water demand. Draft strategy can be provided.
Page 1
• Draft policy for connection to recycled water where recycled water is available and in large new developments (e.g. West Byron).
• Smart meters trial in East Mullumbimby (270 customers), approx. 80% complete, delayed due to COVID. Uses Water Group units and existing mobile network although other technology will be considered. Scope of pilot and uses of data still being reviewed. Meters are picking up leaks and high usage. Data is analysed by Council, rates staff contact customer if a leak detected. More details and future rollout plans can be obtained from Andrew Swan.
• RWT rebates data for Mullum provided by AF. 779 to date. 20 in 19/20 and 26 in 20/21. Low uptake.
• Meter replacement program is going well, replacing older meters and ones with high consumption, consumption is generally increasing (reducing NRW).
• Future focus areas will be WLM PRVs in other areas, dealing with rural customers and smart meters.
Resourcing:
• Need more resources for WLMP implementation and recycled water, potentially a dedicated BySC resource. Currently drought and demand management is undertaken by existing staff and sub contractors
Other issues:
• Leaks across rural properties long lengths of pipe, distance between meters and connections, access across adjoining properties, reading of master and slave meters but there can be leaks between. Need a regional metering guideline for consistency and standards, also info on ownership and responsibilities. BySC will remove rural customers from the network where possible.
• Targets quarterly consumption data only, can be averaged for properties and persons. Some dual/granny flats are not separately metered, some businesses change category. Smart metering and verification of customer data is required to ensure targets and data are meaningful.
• Use of population served is difficult with transient population, approx. one third is not permanent population. Lots of rural connected properties with different consumption rates. Population isn’t a good indicator to base targets on, too difficult and not meaningful.
Mullumbimby:
• Full connection to Rous supply is being developed, approx. 12 months, will reduce drought risk, regional restriction regime will be implemented. Laverty’s gap weir supply and WTP arrangements to be determined.
Lessons learnt at Mullumbimby during drought:
• Resourcing of governance and compliance components were a challenge, policing breaches etc, tankers illegally filling from hydrants. Operational staff were doing a lot of the compliance/ enforcement work although inadequately trained and resourced to deal with conflict situations. Hesitancy from Council compliance and legal team to enforce restrictions, need resources, training and policy for enforcement
• Good consistent messaging to customers regarding consumption targets but difficult to monitor achievement of targets without smart meters.
• Some confusion about Mullum being different to regional regime.
• Residents were trying to save water which showed in quarterly consumption data.
• Businesses struggled to save water and comply with restrictions which were not clear or enforced.
• Need to determine enforcement requirements for WEPs. Consider a “carrot” approach for businesses that are trying (e.g. star rating).
Page 2
• WEP template required. WEPs will take time and resources. Preparedness required. Could start with Council facilities.
Data requested:
• New filling stations recycled water, locations, approved uses provided 6/10/21.
• Draft recycled water strategy provided 6/10/21.
• Draft recycled water connection policy provided 6/10/21.
• Andrew Swan’s contact details to discuss smart metering pilot provided 6/10/21.
• Number of customers connected to recycled water since 1 July 2019 new request.
Page 3
REGIONAL DEMAND AND DROUGHT MANAGEMENT PLANS –REVIEW AND UPDATE
Meeting with Lismore City Council 13 October 2021
Attendance:
Lismore City Council (LCC) Anthony Magarry (AM), Scott Turner (ST)
Rous County Council (RCC) Kirralee Donovan (KD)
Hydrosphere Consulting Robyn Campbell (RC), Nicole Fokes (NF)
Discussion:
LCC is currently very short staffed in Water and Wastewater Dept Manager, Strategic Engineer, Investigations Engineer and Operations Engineer positions have been vacant for over a year.
Customer management systems
• Not aware of any issues with consistency or information about customer classifications or consumption Data on average consumption is considered to be accurate enough
• LCC agrees that regional consistency is needed for customer definitions, metering etc.
Customer engagement
• LCC hasn’t been doing any customer engagement activities for last 3 4 years. There used to be a combined role across Water and Waste Departments but now this position covers waste education only. However water consumption is falling so it means public is getting the message.
Nimbin Water Supply
• The drought was more focused on Nimbin water supply which was within 8 10 weeks of having to start trucking water. Most of communications was focused there, instead of in Lismore. As there isn’t a dedicated person driving proactive measures and programs, LCC was only able to be reactive
• Nimbin was at level 4 restrictions during drought. Nimbin has a small supply and they progressed through Level 2 3 4 restrictions very quickly Many rural customers, who aren’t connected to water supply, were trucking water from Nimbin supply from fill points. This led to faster reduction of levels at Mulgum Creek weir. Amount of water being taken out by LCC roadworks and rural customers at the fill point highlighted the impact on Mulgum Creek. Also many Byron and Tweed carters use this point as it is closest. LCC need to consider whether to continue to allow water carters to fill from Nimbin fill point. LCC will build Water Treatment Plant at Nimbin within 18 months.
• More houses have been approved in Nimbin and the community believes they will run out of water. Community confusion about secure yield definition and supply availability in normal conditions. Community is also concerned about lack of environmental flows from weir during drought for downstream users in Mulgum Creek. LCC will aim to make water supply system as efficient as possible but can’t control licensing etc.
• LCC has a licence for bore extraction near swimming pool in Nimbin but requires more testing to determine the capacity LCC can extract water or how much can be used to supplement water supply. Initial test was done in 2018. Connection to Rous supply is considered too expensive.
Page 1
Demand Management
• LCC has no consumption target, internally or for the community. Consumption is low in region but LCC happy to consider targets.
• LCC has considered rolling out smart meter program recently and about five years ago. Numbers don’t indicate it is worthwhile, compared to what benefit LCC might receive. However, need smart meters for monitoring targets. LCC will consider rolling out smart meter program but would like to see outcomes of other pilot programs.
• LCC had a program for water loss management but this stalled for at least 1 year due to lack of resources. Once staffing issue is resolved within department LCC want to keep all these types of programs running.
• RCC has have been working with Norco in the sustainable water partner program with some opportunities identified Also Summit Gym and Pool complex in Goonellabah and SCU upgraded pool filter systems with quite significant savings.
• LCC has no intention to implement recycled water.
• LCC hasn’t actively promoted rainwater tank rebates due to lack of resources In Nimbin area, this would be advantageous due to concerns about water supply. RCC offers this rebate to Nimbin already every financial year, RCC invoices LCC for any rebates received in Nimbin.
• All new properties now must have water efficient fixtures so probably limited value in providing rebates.
• Focus on lower socioeconomic areas might be a benefit of rebates.
• LCC would like to reactivate schools education program e.g. using catchment trailer.
Drought Management
• During the 2019 drought period, LCC community was calling for earlier intervention of restrictions. LCC doesn’t make decisions on that independently but defer to RCC as owner of bulk supply. From LCC perspective, there was generally feeling that restrictions could have been applied a lot earlier. Believed to be due to community awareness that other parts of the state were in drought, so they wanted to ‘do their bit’.
• No feedback about success of communications or media. KD to talk to LCC’s Communications Coordinator, Peter Weekes to obtain feedback.
• Non residential water efficiency plans. At level 3, every non res customer has to develop a plan how they are going to meet restriction targets to be implemented at level 4. LCC agrees that more guidance, early planning, templates, maybe focusing on council business even outside of restrictions is required Providing templates would be a good idea
• Enforcement LCC rangers’ approach for enforcing restrictions was to issue a warning first. Enforcement must be part of it, but we need consistent approach across region.
Data requested
• Information on secure yield investigations undertaken since 2014 NSW Urban Water Services study.
• Previous reviews of smart metering
Page 2
REGIONAL DEMAND AND DROUGHT MANAGEMENT PLANS –REVIEW AND UPDATE
Meeting with Rous County Council 7 October 2021
Attendance:
Rous County Council (RCC) Kirralee Donovan (KD), Michael McKenzie (MM), Andrew Logan (AL), Sam Curran (SC), Phil Rudd (PR), Tom Lloyd (TL)
Hydrosphere Consulting Robyn Campbell (RC), Nicole Fokes (NF)
Discussion:
Demand management focus
• There appears to be a desire from constituent councils and community that RCC leads demand management and does demand reduction instead of water source allocation. Feedback after future water strategy was that RCC had full control but responsibilities of constituent councils need to be clearer.
• There is a lot of misinformation and lack of understanding how much work RCC has done over time. Are we going to see reductions going forward? RCC wants to focus on best bang for buck outcomes A lot of work was done in 2014 strategy development but this is hidden in technical memos not available to public. Perhaps we need infographic to convey why we are targeting some of those things, education / re education campaign.
• Plan development should list the various options, the savings estimated, and what effort is involved, rank them, draw the line so we can compare all options. Community will understand there is finite number of resources that we can invest. We have done this historically but how accurate? e.g. if we rule out rainwater tanks, we need to show what we have considered.
• Need to understand what best practice is to show level of investment, compared to other water utilities and use this to support decision making.
• Demand management means different things to different people. What are we trying to achieve? Reduction in consumption per person / per share? Improved water efficiency? Substitution e.g., recycled water? Taking pressure of potable supply? Is recycled water a good option? Are we trying to achieve climate independence? Need to communicate benefits and risks associated with actions.
• Intention for Demand Management is twofold first was to reduce need/delay supply augmentation. The other component is peak day demand reduction. Can we actively reduce need for augmentation with demand management? Need to be sure actions will happen
• Maybe include an innovation component pilot programs etc. (e.g. refit programs). Pilot programs should be targeted in areas that we think could get most success.
Smart metering
• Separate program RCC has committed to. Demand management plan needs to look at how we are going to use smart metering data and customer engagement around that. That should be the focus going ahead. We don’t know what technology we are using yet
• RCC wants to propose consistent smart metering across region LCC has said they don’t have enough funding to implement SM
• The old plan did aim to get consistent roll out of technology across region. RCC has hired new project manager for Smart Metering (Graham Bell) 2 yr. program. Going to tender in first half of
Page 1
next year. Back end is getting customers to be utilising it. Resource intensive. To empower customers means they are aware of their usage. Program and engagement aspect is key after the technology is installed.
• Consistency in involvement of constituent councils is required e.g. smart metering will provide lots of great opportunities for region.
• Smart metering is going to be useful in improving understanding
Water loss management
• RCC has water loss under control for retail customer and bulk supply but there is still a need to demonstrate how RCC is dealing with it. Still need to measure and evaluate what that looks like going ahead.
• Water loss reduction is the biggest opportunity for the region. Asking customers to save water but lots of water being lost at source. Water loss management is continual effort, consistently losing about 16% of water supplied. RCC could actively monitor constituent council programs and report.
• Demand Management program should recognise the fact that this is the best option from a cost point of view and that constituent councils are responsible.
Rebates
• Rainwater tank effectiveness need to be clear on value for money and make sure councils are clear if they want to keep that program going and are aware of costs. RCC should focus on what we can control and be effective in.
• Financial cost (how much money we offer vs reward we get) but low in benefits.
• RCC did audit of 100 top water users. Outdoor usage wasn’t a big driver for consumption, more based on number of residents. Market has dictated change in behaviour not rebates. If we can’t demonstrate benefit of program, then we need to prioritise where we invest, spend the money where we expect to get the benefit. That is where there is an opportunity for pilot program. What is the real make up of water consumption (e.g. Airbnb in Byron vs Lismore vs Casino etc)? Behaviour patterns in our footprint.
• Rebate programs recycled water / rainwater tanks might not be best bang for buck, but other benefit we get from rebates is customer contacts, details, and opportunities to directly connect with constituent council customers. This is important, particularly in behaviour change work.
• If we are going to set an annual budget, we need to stick to it. If we chose areas where we get most bang for buck, then we need to set hard limits on other rebate programs as to what expenditure we are going to commit to.
Sustainable water partner program
• Greater investment in business program would provide more benefit going forward.
• Sustainable water partner program for businesses recommendation is we need smart metering to provide more understanding where water is being used. Planning is done with specialist water consultant to tell us we need monitoring and smart metering prior to being told we can justify works (e.g., Caravan Park, business operation).
Monitoring and reporting
• Customer definition issue needs to be resolved. But do we have ability to enforce it? We have offered help to change system to categorise customers. But seems too hard. Some require changes to corporate systems, and councils aren’t willing to do it. For demand forecasting, customer definitions don’t matter as much. But with demand management, even to understand customers better, the consistency is necessary. There is a lot of scale and complexity with the issue. Needs additional resources.
Page 2
• Also categorisation of water use in drought. How do we go about applying restrictions when we don’t have standard categories. Are there alternatives / is there a separate system outside of billing?
• SEQ used successful program monitor unlawful use of water in drought. Predicated on having smart metering. The census showed average person per dwelling is consistent. But looking at households with 3 or 4 times that water use should be investigated. People were aware at how much water was being lost in the system. People wanted to see the issue addressed
Pricing
• Outside of RDMP, RCC could look at how we are charging for water, consider opportunity cost component of how we charge. Need to figure out how important it is, or not.
• The current funding model is that if they all reduce demand, there is no net gain for them. Is there any scope at changing funding model to consumption based bulk supply pricing? Otherwise, councils don’t have financial benefit to reducing water loss. Could leave current pricing as it is, and then introduce opportunity costs. Instead of nominal change, we could have penalty charge on top of that, because it’s bringing forward RCC capital works program.
Drought management feedback
• A lot of work to figure out how to calculate if we were achieving targets / trigger levels. There were a lot of operational issues. We don’t have in our plan clear guidance on how aggressively we need to run our sources when we hit trigger levels. We get alarms during night time, which get ignored as we don’t want to overwhelm our operators. In terms of plans, it would be good to have guidance around operational rules. Models assume that when we hit 95% we are going to use Wilsons River and ECD. When ECD was low in Oct / Nov we preserved it for high demand in Jan / Feb. Also other operational issues like not dropping dam level and risking algae growth. Operational guidance may be outside the plan We need procedure / operating rules that are supported by drought management plan so, it’s consistent.
• Goldsim modelling is based on how many times we go into drought. Always seek to maximise resources as much as we can. Our biggest focus should be on demand levels to ensure that we are going to survive drought. Should be focused more on demand then sources of water. Demand management strategy better utilisation of forecasting, where are we going to be in 2 weeks, 3 weeks etc. we can project where we are going. Duration of drought is more concerning.
• We need to look at how long Rocky Creek Dam would last, without other sources. That will be what we use the GoldSim model for. We could potentially look at different ways of operating. The plan should assume status quo with Wilsons River source licence.
• Always going to be guessing what climatic conditions are in 2, 3 or 4 weeks, need to have risk based approach. Always needs to take degree of sound judgement.
• Plan to consider implementation progress of Future Water Project RCC has a drought management project manager starting and that person’s role is to get Woodburn bores ready and then turn attention to Wilsons River source, particularly around emergency scenario. This will be addressed in the next 6 12 months.
• Need to consider availability of back up sources for operating rules.
• Low dam inflows triggered restrictions. Inflow measurements are taken manually from Rocky Creek v notch weir Levels don’t drop rapidly enough to warrant telemetered monitoring but it wouldn’t be hard to do, just need resources.
• RCC could display more real time data online for community / public. Catchment rainfall is important too. Councils were watching the dam levels but waiting for something from Rous to say that ‘we are getting close’ or ‘we are going into restrictions’. Maybe based on predicted rainfall to
Page 3
provide updates like ‘we think this Is going to happen, so be ready’. Or ‘this is how we are going to be ready for it’.
• Current drought management plan has clear operational readiness triggers but may need to be earlier. RCC used an email template with new updates of info each time. During level 2, RCC used a combination of dam level trend (trigger point) and when that might click over using BOM forecast, then set a date for everyone to work towards. RCC can communicate that date to everyone to be ready by. Need to be clear about where we are at those trigger levels and need to be clear about communication. Feedback was that messaging was clear and well received but maybe lead up that was uncertain. Consider BOM forecasts or worst case scenario of no rain/inflow. Could be a Situation Report (SitRep) to be clear about outcomes of meetings and make sure this is communicated.
• GoldSim is a good tool for balancing out cost and drought security. As we bring on the system, benefit of tool will be better information in balancing out risk and cost, looking at drought planning. Which one of the droughts are we in now, where are we going? We are at 50%, based on probability and what forecast looks like, what is the probability we will be at 30%, 20% and by when? GoldSim model is too rough to predict this, there is always a degree of uncertainty. GoldSim can give you a band of probability of where you might be in 3 months (worst case, average case, best case scenario). If we aren’t meeting demand triggers, we roll onto next one, regardless of what dam levels are. GoldSim will be more of an emergency management tool. Need to be more informed about how soon we can get things up and running. That is what we want to do with Woodburn bores, desal and Wilsons River source. They may take a lot longer than expected to be activated
• When we get to level 1 restrictions, RCC will manage consistent messaging included in SLA.
• It would be helpful to have appropriate templates with different scenarios considered for businesses. RCC doesn’t have direct contact with the customers but can provide consistent management guidance for businesses. If we develop those plans, considering there is no monitoring, how do we monitor if they are meeting requirements? How are they monitored / measured / enforced at levels before level 3? What are the best tools to be using?
• RCC staff members for Weeds / Biosecurity in each LGA could be trained up to enforced water restrictions
• We could do similar practices as SEQ such as random audits. Look at what demand should be, and what demand currently is and audit households which fall outside.
Page 4
REGIONAL DEMAND AND DROUGHT MANAGEMENT PLANS –REVIEW AND UPDATE
Meeting with Richmond Valley Council 8 October 2021
Attendance:
Richmond Valley Council (RVC) Jenna Hazelwood (JH), Johan Schoonwinkel (JS), David Timms (DT), Craig Connolly (CC), Sharon Davidson (SD), Sandeep Chugh (SC)
Rous County Council (RCC) Kirralee Donovan (KD)
Hydrosphere Consulting Robyn Campbell (RC), Nicole Fokes (NF)
Discussion:
Customer management systems
• Actions in old plan was to get consistent customer and consumption data across the region, which has been difficult because everyone has a different system. RVC tariff based system is designed for rates billing not water supply but modifications to system have been trialled with rates staff and this is improving.
• Metering and particularly multi res or multi non res break down of customers is available in tariff structure there is a breakdown of property of (e.g. 2 5 units) which is helpful. But splitting consumption into categories is difficult due to strata metering systems (not all individually metered) Some of the units have individual meters inside and then a master meter which is flagged in the system. Some have master, internal or just internal or just outside meters. Some have individual meters but no master meters. Can get a bit complicated in caravans park and holiday sites. Risk of doubling up data (actual vs consumption)
• RVC is keen on region wide consistent approach. Should be based on standardised system from DPIE but this is also flagged for review.
Customer engagement
• RVC doesn’t have a dedicated officer who is committed to customer engagement. There is an officer doing waste education, but she might not have capacity (3 days pw)
• Currently not a lot on demand management on RVC website Not a lot of education materials from RCC in the past but more lately. RVC might rely on what RCC puts out and then put those things on RVC website.
• Need to be careful about message between the two areas (Casino and MLRR) as they are different.
• Casino’s restrictions match RCC plan but triggers are different (based on upstream user restrictions etc.).
• DPIE has also announced they are going to standardise water restrictions across the state.
Demand management
• RDMP applies to Casino as well. Starting to get zone meters operational (installed in 2010 as part of WLMP) but installation was problematic. Casino and Evans Head commenced Meter zones will be used for water balance No WLMP update since 2010.
• Monthly report on supply from Rous on water that goes through bulk meters but RCC billing is confusing charged based on average of previous year’s consumption. RCC pricing doesn’t help to
Page 1
reduce demand. Getting bills that are retrospective does not help with understanding demand management targets.
• RVC used to use RCC monthly data and try do water balance to try and see what the water loss is but there are issues in RVC billing system looks like water is produced in 1 town and the rest of the towns have larger losses. New water balance data spreadsheets should help. ‘Sanity check’ using Rous’s monthly data with sales vs water produced to gather water losses RVC will have to work through this.
• Smart metering is only way can get understanding of where water can be saved / leaks that can be flagged. RVC is trying to determine if its worthwhile spending the money to go with smart metering. Idea was to install in smaller town and use as pilot to see if there are benefits. RCC flagged that they might do a pilot program in Broadwater, as part of a partnership. Need info on RCC’s program. RVC wants to use the same technology as RCC.
• With non res large water consuming businesses, the RCC SWPP program is delivered in 3 phases planning, implementation and then RCC rebates business for water saving projects identified. Large water consuming business e.g. Broadwater Mill and Cape Byron Power operations are complex and water saving opportunities can’t be identified without smart metering. Cape Byron Power has installed 3 smart meters and is a good example of a business who is getting value from smart metering so they can make their own decisions internally. They have gone with a group called Outpost Central which doesn’t require any radio antennas to be installed (run off 3G, 4G, 5G network). Taggle needs separate radio antenna to be installed.
• RCC will use direct retail customers as a pilot for SM but will be applied to res and non res. If there is a regional smart metering scheme meter would only be installed on main meter out the front. Then it would business working with council if they needed additional internal smart meters installed across operations. Alternatively, it would need to be initiative of the business to install smart meter.
• RCC is working with Reflections exec board to use smart metering at holiday parks, comprehensive water saving plans for eight caravan parks. Work that has come out of those plans can be split into two categories. First is upgrade of fixtures and fittings and looking at leaks across park. The second component is planning. No regional SM program, so if those businesses are progressing with smart metering, they want to use as a pilot for all parks across NSW. If they push forward with self managed system, they are at risk of a council managed systems overriding what they have put forward if the system is different to what they have opted for. Difficult to justify cost to business when in 2 5 years down track, it gets over ridden.
• RVC is interested in exploring regional approach to SM. If we want to get business to take initiative to invest in it themselves, they need clarity. Need a regional approach to get consistency.
• Limited opportunity for recycled water for RVC. Evans Head is only treatment plant that would be capable of producing recycled water but there is not a lot of opportunity for reuse
• RVC is interested in continuing RWT rebate program every rainwater tank helps but its up to RCC if they see that value. RVC won’t push rebate on their own but want to be a partner with RCC and would stop rebates if RCC stopped. RCC also offers rebates in Casino
• Most of the showerheads and other rebates have run its course. Everyone probably has efficient shower head. Change in rental provisions require landlords to have water efficient appliances.
• Fixtures for outdoor use are more discretionary. Not everyone has trigger nozzle or low flow sprinkler etc. Potentially community appetite for other types of rebates.
• Everyday water savings are not advertised or communicated to community. RVC hasn’t done a lot of advertising or communicating this with residents. The only time RVC does these communications is during drought. Drought management plan for Casino not progressed past draft which is why no active communication. RVC Sustainability Manager (Carla Dzendolet) recently appointed so this will change under her direction. Waste education officer falls within that group so she could contribute. RVC has identified need for more communication and is developing environmental
Page 2
sustainability strategic plan. There will be some opportunity to do demand management work as well, just not as big of a priority right now. Interested in a shared education resource like water education officer role. RVC understands it is something that needs to happen. Water is usually left behind because water is not as big of an issue compared to waste. It’s hard because you want to save water but water sales are a large part of income.
• RVC wants smart metering but is mindful of resources required for customer interface, interpretation, advise, make it user friendly, ongoing maintenance. So would become RVC set of infrastructure, including customer interface. Need a lot of interpretation, presentation, resources to provide help to customers. Want to be careful about what systems they chose.
• School education component. There was a task in the RDMP to provide all info to third party provider to deliver school education if/when the school or teacher wants. Direct programs are resource intensive. As a regional approach it may work, if there is interest on a regional basis. Whole of catchment sustainability education covering water, river, waste, etc. could be useful. Bit wider than demand management plan. Would need more contributions from each council for a centralised resource. This has value. There is value in school education because children integrate behaviours into households No case studies on benefit cost analysis on that sort of education on what it achieves vs what it costs Hard to measure outcomes from those programs and hard to quantify benefits.
• RVC acknowledges limited progress in RDMP implementation due to lack of resources and it’s hard to know what did work and didn’t work.
• Some desire to target lower socio economic aspects. Maybe looking at focusing on intensive help / higher rebates to lower socio economic areas. RVC communities can struggle with understanding and managing water consumption, which leads to higher water bills and then people defaulting on payment so lots of people are in water debt.
Drought Management
• There was some confusion about when Casino went into restrictions. Council messaging was clear, then media caused confusion about who was on restrictions etc. Overall, the comms around drought were well received. Local newspaper, socials, newsletter, notices sent out in rates notices. It did get confusing at the start, but it sorted itself out. All rate payers got memo around general use of water, more than about restrictions.
• Casino got to level 3 restrictions but didn’t critically analysis what the restrictions achieved. Kept an eye on consumption and how it changed but didn’t go back to analyse Tracked trends based on production data from water treatment plant. As drought extended, also had people from rural areas taking water.
• RVC did a fair bit of work to be consistent with granting exemptions, series of meetings with constituent councils, and adopted a level of consistency for what would be approved, what wouldn’t, and why. That worked well. Didn’t get a lot of complaints and only a few exemptions that weren’t granted. Most were valid and were granted with conditions.
• Policing of restriction levels comms to all staff that if they saw residents or businesses doing the wrong thing, responsibility of any council officer in the field or rangers was to report There were some repeat offenders but didn’t get to stage where anyone received infringement notices. The rangers’ priority was to educate. The ranger will have first and second verbal discussion to educate. If they are caught on the third occasion, they would have issued an infringement notice. Rangers get a call from public but then ranger would be reluctant to issue an infringement because they don’t have evidence. Rangers would do drive by and random checks on these offenders. Most people understood that everyone was in serious drought. Generally, community was good. RVC never copped backlash and was gently reminding people to do the right thing. Based on what was happening out west, it was a wakeup call for the community.
Page 3
• Other considerations with Drought Management plan will be difficult to get businesses to put water saving management plans in place with limited RVC resources. May be work that can be done before we get into a drought. It would be important to get agreement with meatworks, as they were getting concerned with what would happen to them if they ran out of water. In the first part of the drought, their consumption goes up, but as it goes deeper into the drought, their workload would decrease.
• Whatever help that councils could give each other to help develop drought water saving plans, would be appreciated. No one from RVC had been involved in development which would be intensive. Template and process that had been documented would have made it easier, but still resource intensive. Could have list of businesses or organisations documented. As soon as it looks like restrictions are going into place, know what you are up against Need better procedures in place.
• Water carting people in MLRR area either came up to Casino or carted from other LGAs RVC got disaster funding to install filling stations. Station in Woodburn now (operated by RVC), so for next drought RVC can monitor that demand. That it is for smaller users, not for water carters, 3000L max per transaction. Works with credit card system and petrol pump system. Targets private smaller landholders.
• Namoona (Casino fill point) had utes and trailers waiting non stop, 7 days a week. It does service carters at times, but not encouraged. Maybe 3 or 4 that would have filled up from that point as well.
• During the drought, there was a lot of resources tied up with water quality / blue green algae spikes. That’s where resources were focused.
Casino water supply
• Casino strategic planning currently doing scoping study and yield assessment. Have gone through modelling phase and identified yield shortage but since then WaterNSW has flagged that they will provide additional data (Toonumbar releases) to compare to RVC data but hard to say whether that will change the findings. RVC not sure about timeframe.
• Limited options for augmentation bores, raising weir, off stream storage or WaterNSW link into Toonumbar Dam. RCC connection option is last resort as very expensive and limited benefit for Rous.
• IWCM Strategy pilot project is being planned out with DPIE.
Page 4
REGIONAL DEMAND MANAGEMENT PLAN – WORKSHOP
Regional Liaiso n Committee Meeting 1 6 December 2021
Attendance:
Ballina Shire Council (BaSC) Bridget Walker, Belinda Fayle
Byron Shire Council (BySC) Cameron Clarke, Pablo Orams
Lismore City Council (LCC) Scott Turner
Richmond Valley Council (RVC) Johan Schoonwinkel, David Timms
Rous County Council (RCC) Phil Rudd, Andrew Logan, Kirralee Donovan, Graeme Bell
Hydrosphere Consulting Robyn Campbell, Nicole Fokes
Concepts of Change Liz Ampt (online)
Discussion:
Robyn delivered a presentation on project findings consultation and research outcomes (attached).
Liz delivered a presentation (attached) on the behaviour change components. The group discussed the program and had the following comments:
The group agreed that a behaviour change program would be effective as there was a clear lack of community awareness around water supply and usage It was helpful to understand the different communities’ perceptions and how this feeds into the design of the demand management actions. The group discussed the model adopted by NEWaste (stage and local government funded) have a separate branded entity which provided education programs. It was agreed that branding is important and there is a need to make water supply demand management more prominent in the community.
Monitoring, evaluation and reporting:
The group agreed to share information and collaborate at regular Regional Liaison Committee meetings (RLC)
It was suggested that RCC would coordinate quarterly or six monthly RLC meetings with standing agenda items RDMP action status, lessons learned, progress etc.
BySC has a dedicated Data Analyst and they offered to share methodologies/systems as a point of reference for other LWUs
It was agreed that it is necessary to develop common customer and demand definitions for baseline reporting However, there was concern that there isn’t much internal drive to change definitions (e.g., IT, Rates, Billing Dept). It was suggested that tasks for LWUs in RDMP needed to have a deadline / dollar amount. The RDMP will include an action to develop a consistent system for customer definitions, metering, water supply components etc.
Water loss management:
The constituent councils agreed that water loss management will be implemented locally and through LWU processes, not through the RDMP
RCC has adopted its WLMP for implementation over next 4 years.
Page 1
Non residential programs:
Local SWPP actions (local water supply customers) will not be included in RDMP constituent councils will learn from SWPP and potentially implement in later years, if identified through strategic planning (IWCM etc.).
RCC could design a program (through pilot program, or smaller group) or a sector in non residential community and determine sector based needs. This could make it easier for smaller businesses to participate
Smart metering:
BaSC and BySC agreed to share information on their smart metering programs (lessons learnt, successes, recommendations)
RCC is working on smart meter program for its own retail customers and will share specs with LWUs
The councils agreed to review RCC spec and data from lessons learnt of active smart meter programs in the region (BaSC and BySC) and consider for future implementation
The advantages of smart metering for other RDMP actions was acknowledged
Recycled water use
Recycled water policy for retrofit and incentives for residential customers will be implemented by BaSC and BySC separate to the RDMP.
Rebates and incentives:
All councils agreed to phase out RWT rebate and replace with a more cost effective and efficient customer incentive
The group suggested to phase the rebate out of a four year period. There were suggestions to put a cap on rebates (to existing budget) for the first year of the phase out period, potentially decreasing each year. The program would work on a first come first serve basis
It was highlighted that customers engaging with RCC for RWT rebates was an important source of data collection. Necessary to replace this program with something that has the same customer connection outcome
There were support for incentives / rebates to targeted groups (lower socio economic groups etc) It was also suggested that the phase out period could be integrated with the behaviour change program outcomes
Residential customer programs:
Proposed pilot program for Behaviour Change Program and residential customers was supported. Results from each Behaviour Change focus group indicated each LGA has a different view of water consumption, so a pilot per LGA would successfully encapsulate varying demographics etc.
Education and engagement:
The group supported a region wide water education officer (covering the whole water cycle) generally focusing on school education.
RCC recently purchased a site to turn into an environmental education centre and they discussed this as a centralised location for education programs
The group agreed it was difficult to provide education to tourists. There were suggestions that a information pack could be provided to Airbnbs, caravan parks etc.
Alternatively, RCC / Council comms officers could discuss directly with comms officers of caravan parks / holiday rentals
Page 2
Another suggestion was to provide smart metering, so that tourist premises could overlay usage data with occupancy.
Pricing:
Review bulk pricing across two years (being completed in separate project) but referenced in RDMP
It was agreed that LWU pricing review will not be included in the RDMP but will be reviewed regularly and after bulk pricing review has been completed to promote water conservation.
Page 3
DEVELOPMENT OF REGIONAL DEMAND MANAGEMENT PLAN 2023 -2026
Regional Liaison Committee Workshop


16 December 2021

AND NEXT STEPS 1. Introductions 2. Background research and consultation outcomes 3. Behaviour change 4. RCC retail customers smart metering 5. Recommended RDMP components 6. Discussion and agreement on RDMP components Next Steps: This workshop -agreed RDMP actions Draft RDMP for review -12 Jan 2022 Draft RDMP for public exhibition -2 March 2022 RCC adoption -30 May 2022 17/12/2021Regional Liaison Committee workshop 2
AGENDA
WE HEARD Current lack of resources in constituent councils (and during 2017-2018 in Rous), particularly for water loss management Regional consistency is supported for monitoring, reporting and community engagement Community engagement is mostly undertaken by Rous Constituent councils are unlikely to implement a rebate program if not delivered by Rous General interest in region-wide education Support for review of bulk supply pricing Support for Rous leading and managing demand management across region Need for clear responsibilities for RDMP implementation 17/12/2021Regional Liaison Committee workshop 3
WHAT
RDMP IMPLEMENTATION STATUS
Implementation hampered by lack of resources
WLMPs prepared but minimal implementation
Some actions (e.g. SWPP) require significant effort in early planning and engagement and are only producing results in later years
Some challenges with recycled water rebates (limited opportunity, low incentive for retrofit)
Local smart metering programs in Ballina and Byron Shires, limited regional approach
Higher take-up of rainwater tank rebates during drought (33% higher than 3 year average)
Regional Liaison Committee workshop
17/12/2021
4
RDMP
17/12/2021Regional Liaison Committee workshop 5 Complete, 11 Ongoing, 12 Not started, 16 In progress, 7 Actions in RDMP 2019 –2022 –status at 2021
IMPLEMENTATION STATUS
COST-BENEFIT ANALYSIS
Rainwater tank rebates do not provide financial benefit (apart from lowest level of rebate)
Customer benefit increases with rebate amount but benefit to Rous decreases
SWPP is cost-effective as it focuses on actions with demonstrable water savings
Intangible benefits of other programs (education, engagement, monitoring)
Water savings from capital programs (smart metering, water loss management) depend on investment, network configuration, customer mix etc.
Regional Liaison Committee workshop
17/12/2021
6
CURRENT PRACTICE –OTHER LWUS
Demand management in Rous region is similar to other non-metropolitan LWUs (e.g. Tweed, Clarence, Coffs, Eurobodalla) but more intensive than other councils
Most other councils have wider rebate programs (more fittings/fixtures and support offered)
Some other councils (Clarence, Coffs) include more intensive education programs
Most councils have implemented leak detection and largely rely on mains renewal and meter replacement for water loss management
Most councils are considering smart metering but limited implementation to date apart from some pilot programs
17/12/2021
7
Regional Liaison Committee workshop
BENCHMARKING –ROUS REGION
Residential demand is high –8 year average 182 kL/property/a (NSW median = 156 kL/property/a in 2019/20).
Total and residential demand is relatively stable, low year to year variation due to climate
Generally lower residential demand with higher water usage charges
NRW is high –8 year average 2,214 ML/a (15.7%). 18.9% in 2018/19 and 15.2% in 2019/20.
Leakage was higher in 2019/20 (3.09 kL/km mains/day) than NSW median (2.34 kL/km mains/day)
Regional
17/12/2021
8
Liaison Committee workshop
BEHAVIOUR CHANGE
17/12/2021
9
Regional
Liaison Committee workshop
RCC SMART METERING
17/12/2021
10
Regional Liaison Committee workshop
RDMP
Reduce normal consumption/average supply requirements Reduce urgency of water source augmentation Increase awareness of value of water Increase awareness of level of consumption Gather data to test uncertainties and prove effectiveness of potential actions to develop cost-effective and targeted programs 17/12/2021
11
RECOMMENDED
OBJECTIVES
Regional Liaison Committee workshop
Allocate sufficient resources to deliver actions Build on successes of previous programs Utilise consistent regional approach where appropriate Align with community desires Demonstrate leadership through council action Strengthen monitoring, reporting and evaluation to develop comprehensive understanding of demand trends 17/12/2021Regional Liaison Committee workshop 12
RECOMMENDED RDMP APPROACH
TARGET AREAS Residential customers Council water uses Water losses High water users Schools Wider community Tourists Vulnerable/financially disadvantaged customers 17/12/2021Regional Liaison Committee workshop 13
RDMP RECOMMENDATIONS
17/12/2021
14
See matrix of proposed RDMP components and recommendations Framework only -still need to develop actions, tasks, budgets, timing
Regional Liaison Committee workshop
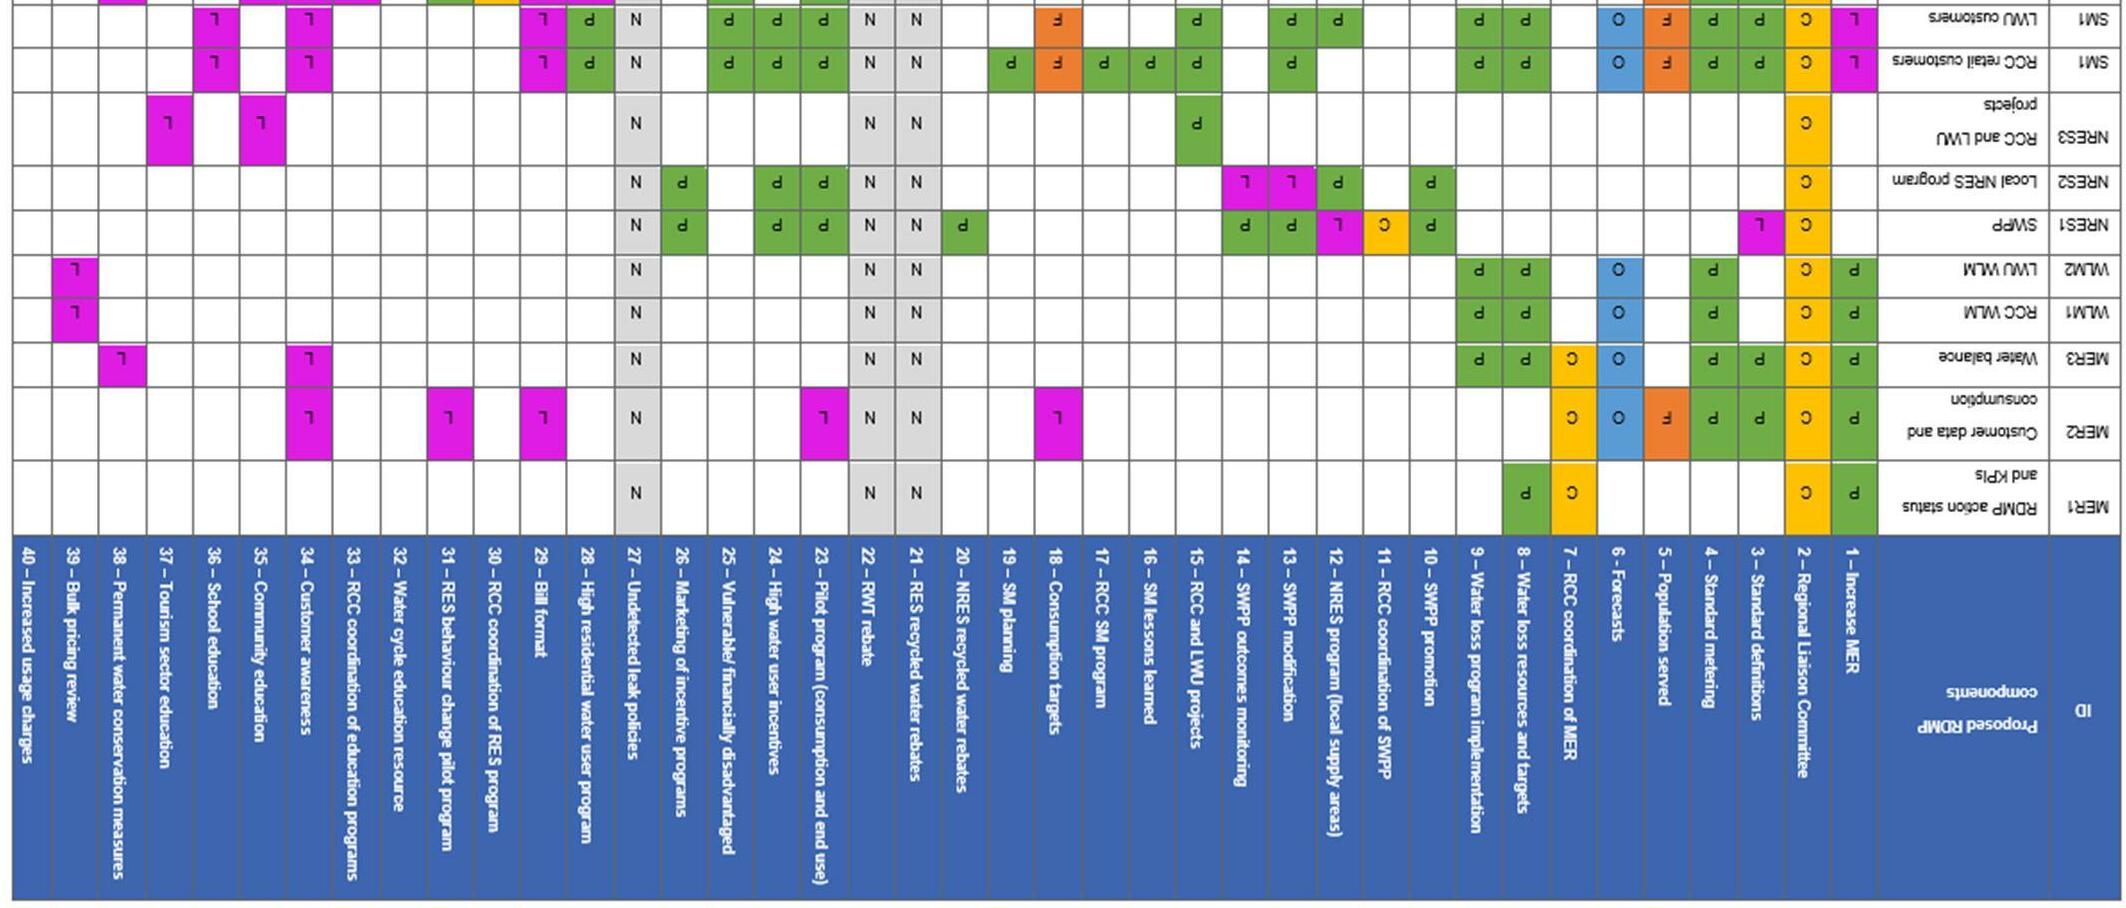
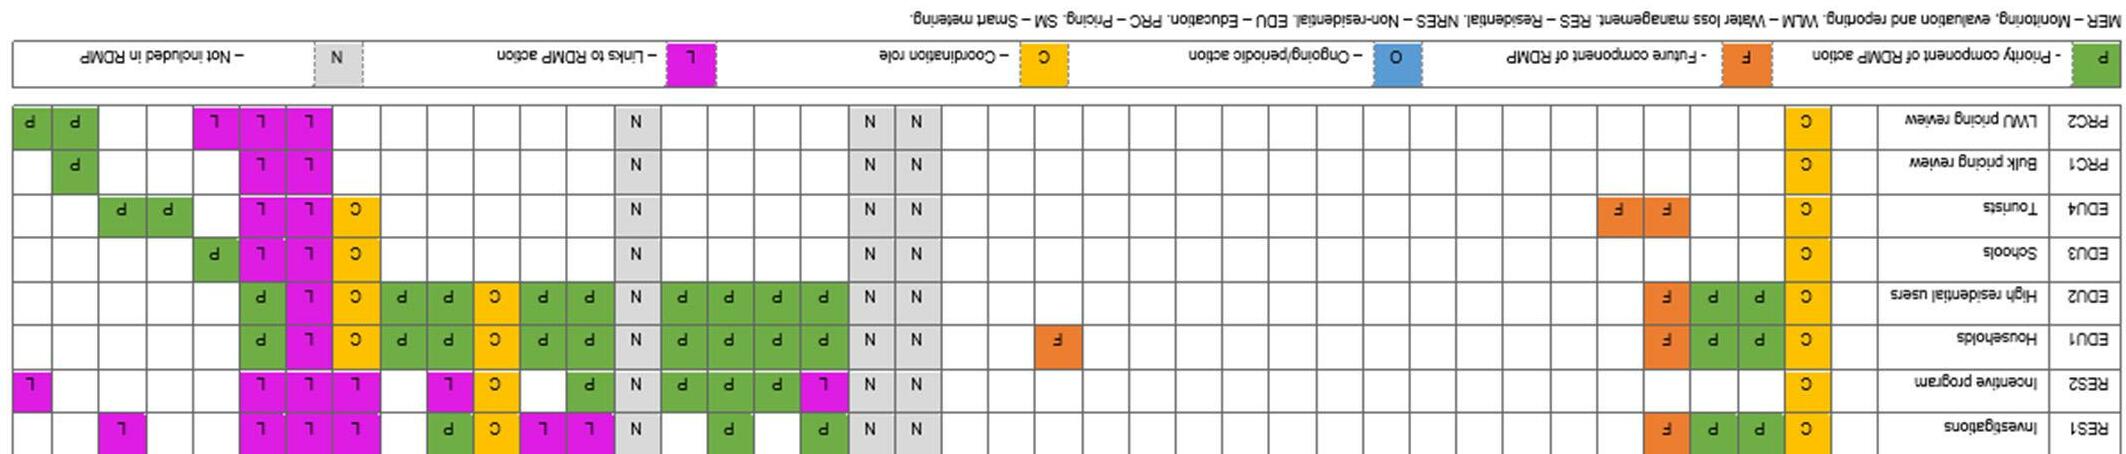
17/12/2021 15
PROPOSED BUDGET
For discussion
Regional Liaison Committee workshop
17/12/2021
16
AGREED RDMP ACTIONS
Discussion
Regional Liaison Committee workshop
17/12/2021
17
APPENDIX 3 RDMP IMPLEMENTATION STATUS
RDMP Background information and recommended plan components Page 61
Table 12 provides an overview of the current status of the tasks in each RDMP action, expenditure and key performance indicators (KPIs). The implementation status of each action is described as:
Complete the action has been completed as required by the RDMP.
In progress progress is being made toward completing this action. Work has started and is currently being undertaken
Ongoing tasks have been undertaken to fulfill this action periodically, as required or a part of the ongoing program.
Not started No progress has been made toward completing this action.
RDMP Background information and recommended plan components Page 63
Table 12: Status of RDMP actions
Action 1: Monitoring, Evaluation and Reporting
Target groups RCC and constituent councils Objectives • Ensure timely, accurate and consistent reporting to assist with ongoing RDMP development and evaluation.
• Ensure consistency with existing reporting requirements and avoid duplication or additional reporting.
• Ongoing information on consumption reported to consumers.
Task Responsibility Description Status Progress/Challenges
1.1 RCC Develop standard procedure for reporting of RDMP action status and KPIs (including format, responsibilities, timing)
Complete Standard procedure has been developed and implemented by RCC and is continuously updated to measure and evaluate progress. This is used internally by RCC.
1.2 All LWUs Reporting of RDMP action status and KPIs On going Updates were shared between constituent councils at Regional Liaison Committee meetings (previously held quarterly, more frequent during restriction periods and less frequent after the 2019/20 drought).
1.3 RCC with input from LWUs Develop standardised definitions of connection types across the region Not started Requires involvement from each LWU, dedicated resources and agreement and coordination between constituent councils and all relative departments.
1.5 All LWUs Reporting of customer data and consumption Not started While the councils all report data as part of annual reporting requirements, there has been no centralised reporting of data as part of RDMP monitoring.
1.6 RCC Develop standardised reporting of water balance data Not started
Page 64
RDMP - Background information and recommended plan components
1.4 All LWUs Implement agreed definitions Not started
Task Responsibility Description Status Progress/Challenges
1.7 All LWUs Reporting of water supply and consumption in each LWU service area/zone Not started
1.8 All LWUs Confirm population served through detailed analysis e.g. Census data mesh blocks
Not started
1.9 RCC Investigate the development of a customer relationship management (CRM) system to monitor customer data relating to RDMP implementation
In progress
Estimated population data is included in annual performance indicator reporting but not derived from Census data mesh blocks. There has been no centralised reporting of data as part of RDMP monitoring.
RCC has implemented an electronic record keeping system across all business units. This system has influenced a change from hard copy to electronic record keeping. Although all customer records are stored in the CRM and can be tracked, it is not RDMP specific or used specifically as a CRM.
1.10 All LWUs Data collection in CRM system Not started
1.11 RCC Update regional demand forecasts Compete Completed as part of Future Water Project 2060.
Key indicators of success KPI
Reporting of action implementation and success None included in RDMP -
Actual performance
Page 65
RDMP - Background information and recommended plan components
Action 2: Water Loss Management
Target groups RCC and constituent councils
Objectives
• Accurately quantify amount of losses on a quarterly basis.
• Detect and repair leaks.
• Reduce losses to sustainable levels.
2.1 All LWUs Develop and implement Water Loss Management Plans (WLMPs), actions and targets for each LWU
Complete
•
LCC - Detection Services Pty Ltd (2015) and 2019 update (Detection Services Pty Ltd, 2019a): limited implementation due to lack of resources.
• BaSC - Detection Services Pty Ltd (2019b): focusing on West Ballina pilot PRZ implementation and meter replacement program.
• BySC Detection Services Pty Ltd (2019c): limited implementation due to lack of resources.
• RVC Detection Services Pty Ltd (2019d): bulk flow meters being repaired. Limited implementation due to lack of resources.
• RCC Detection Services Pty Ltd (2019e): to be implemented from 2021.
Findings of the WLMPs (across the supply area):
• High levels of leakage although variable.
• Apparent losses mostly managed appropriately.
• GIS and asset information is not kept up to date and lacks appropriate information.
• DMAs established but not always maintained.
• System pressure is higher than necessary.
2.2 All LWUs Develop local NRW (non revenue water) targets for each service area/ zone to support achievement of regional targets
Not started It is recommended that each constituent Council set a target for reducing water loss over an agreed timeframe and provide an outline on how they will achieve this.
Page 66
RDMP - Background information and recommended plan components
Task Responsibility Description Status Progress/Challenges
Task Responsibility Description Status Progress/Challenges
2.3
2.4 All LWUs Monitor and report water losses in accordance with standardised reporting procedure (Task 1.5) Not started Water loss management is the responsibility of all LWUs as agreed through service level agreements. Challenges continue to be experienced with responsibility, accountability and reporting.
NRW
NRW - local supplies Local targets to be developed No progress
Leaks repaired 90% within 4 hours of identification No reporting
Page 67
RDMP - Background information and recommended plan components
RCC Develop and implement an electronic reporting tool to predict and identify leaks in the bulk water distribution system Not started
Key indicator of success KPI Actual performance
region 12% of water supplied (1,620 ML/a) 15.2% of water supplied (2,105 ML/a) in 2019/20 Appendix 2.
Action 3: Sustainable Water Partner Program (SWPP)
Target groups Businesses and community groups with high consumption (>5 ML/a)
Objectives • Assist businesses and community groups (non-residential customers) to improve water efficiency and reduce water/sewer bills.
Task Responsibility Description Status Progress/Challenges
3.1 RCC Develop a communication and engagement strategy to promote the SWPP to target customers Complete The RCC Demand Management Communication and Engagement Plan (RCC, 2020) for the SWPP is being implemented including business engagement, identification of priority non-residential customers. The RCC Water Sustainability Officer works with interested businesses to progress through the stages of the SWPP.
3.2 RCC Review and update promotional tools for the SWPP and develop a media kit Ongoing Case studies promoted through RCC website, social media, print media and Water Week activities.
3.3 RCC and RVC Actively promote the SWPP to target customers Ongoing RCC Letter template developed to introduce the Program to new businesses. Businesses prioritised based on history, existing relationships, aim of SWPP / RDMP, geographic spread, likelihood of success, potential risk. Direct communications have yielded the best results with engaging target customers. RVC minimal progress due to lack of resources for engagement with businesses.
3.4 RCC and RVC Preparation of water efficiency plans Ongoing 16 regional water supply businesses (including holiday parks) have completed water efficiency plans.
Page 68
RDMP - Background information and recommended plan components
Task Responsibility Description Status Progress/Challenges
3.5 RCC and RVC Implementation of projects in the water efficiency plans including rebates Ongoing Seven participating businesses have completed projects under the program which has resulted in a total potential water saving of approximately 22 ML/a. A further nine businesses/sites are currently planning water savings projects.
The first two years of the RDMP 2019 2022 saw an underspend against the SWPP budget. 2020/21 saw an 84% spend of the SWPP budget. This trajectory reflects the time required to generate business partnerships and identify water saving projects through planning works.
Continuous focus needs to be placed on engaging current businesses in delivering committed water saving projects.
Some implementation progress has been affected by COVID-19 restrictions.
3.6 RCC Develop and implement SWPP recognition program Completed Recognition certificate produced to acknowledge business achievements. The SWPP is not established enough to further develop the gold/silver/bronze recognition program proposed which is time and resource intensive to set up well (including guidelines, eligibility, promotions and engagement). A framed certificate of acknowledgement, in addition to social media posts, is the preferred method to recognise water saving achievements delivered by local business. RCC has developed, published, shared and boosted good news stories (tagging the business) through social media platforms to recognise local business involvement.
Key indicator of success KPI
Water savings realised through the Sustainable Water Partner Program (SWPP)
Actual performance
5 ML/a from year 2 (2019/20 onwards) 22 ML/a from year 3
Page 69
RDMP - Background information and recommended plan components
Action 4: Smart Metering
Target groups All customers
Objectives
• Investigate implementation of new technology for identifying leaks and monitoring customer consumption.
Task Responsibility Description Status Progress/Challenges
4.1 RCC with input from LWUs Review program objectives and scope, technologies/suppliers for infrastructure, software and devices
4.2 RCC with input from LWUs Develop a business case for investment in infrastructure including extension of the program to other operational requirements
Complete Regional smart metering study (REID and ecoDATA, 2019) completed. Report recommended no action in short term as more planning and investigation are required.
In progress BySC is currently undertaking a pilot project in East Mullumbimby (potable customers) and Byron Bay bulk (recycled water users).
BaSC has implemented a smart metering program with Taggle (opt in scheme). No consensus on a regional approach. A lack of expenditure against the budget for smart metering reflects each council progressing their own schemes or limited staff resources.
RCC has employed a Smart metering Project Manager and intends to rollout smart metering to its direct customers and will work with the constituent councils to extend the program across the region.
4.3 RCC with input from LWUs Develop funding and subsidy model based on supply of infrastructure and software and rebates/participant contributions for devices
Not started No regional model. BaSC program is being implemented. BySC will review outcomes of pilot program.
4.4 RCC Identify preferred technology/supplier Not started
4.5 All LWUs Roll out of preferred technology Not started
4.6 RCC with input from LWUs Develop and implement a communication and engagement strategy Not started
components Page 70
RDMP - Background information and recommended plan
Key indicator of success KPI
Actual performance
Water savings realised by participants with smart meters KPIs to be developed as part of Business Case for investment in smart metering infrastructure. Not reported.
Number of new smart meters installed BaSC not reported. BySC approx. (270 potable) by end 2021.
Feedback from participants Not reported.
Page 71
RDMP - Background information and recommended plan components
Action 5: Recycled Water
Target groups All customers within dual reticulation service areas
Objectives • Develop cost-effective opportunities for replacement of potable water use with treated sewage effluent (recycled water for non-potable uses)
Task Responsibility Description Status Progress/Challenges
5.1 RCC with input from BaSC and BySC
Develop procedures for implementation of rebates and reporting requirements In progress Although Byron and Ballina Shire Councils continue to expand non potable recycled water connections to new developments, a high cost of connection and approval along with other challenges limit the feasibility of retrofitting existing properties. The provision of rebates by RCC is dependent on BaSC and BySC engaging with suitable customers. Further consideration is required to determine a rebate that incentivises the expansion of connections and provides positive return on investment for both the council and the customer. The current rebate scheme creates challenges with being able to provide eligible businesses certainty around the rebate amount before they commence works, particularly given the total costs are often only known on completion of the project.
The recycled water rebate was originally intended to target existing residential properties. Due to high plumbing and approval costs, the feasibility of retrofitting existing residential properties is limited. As a result, focus turned from residential to non residential as the return on investment would be greater with higher water consuming businesses.
These challenges have driven a focus to continue expanding connections to new residential builds (through BASIX) and reallocation of rebates for non potable recycled water (provided by RCC) to support business connections through the SWPP.
Page 72
RDMP - Background information and recommended plan components
• Encourage the use of recycled water to supplement potable water supplies.
5.2 BaSC, BySC Implement rebate program within RCC supply area Ongoing
Task Responsibility Description Status Progress/Challenges
5.3 BaSC, BySC Document strategy for connection to existing recycled water systems or expansion of existing systems
In progress
In 2021 the Byron Beach Hotel connected to the BySC recycled water network, a project supported by RCC that will reduce demand on the potable water supply by over 4 ML/a. This outcome is the result of close to three years engagement with the Hotel through the SWPP.
BaSC is investigating options with businesses in West Ballina to establish their interest and barriers to connecting. BaSC also conducted an investigation into smart metering of dual reticulated properties.
BySC continues to approach businesses with similar needs to the Beach Hotel as well as businesses who are in close proximity to the recycled water main including potential connection of West Byron development and TAFE in the Byron industrial estate. BySC is developing a recycled water strategy.
5.4 BaSC, BySC Develop marketing strategy and promote opportunities for recycled water connections to existing and new customers
Key indicator of success
New customers connected (apart from BASIX connections)
Ongoing
No specific marketing strategy but opportunities are promoted by BaSC and BySC and RCC (through the SWPP).
KPI
BaSC 30 p.a.
BySC 5 p.a.
Reduction in metered potable water supply
BaSC 25%
BySC 10%
Actual performance
BaSC 382 customers 1/7/19 1/7/21 (2 years) including BASIX connections (not separately reported)
BySC 4 new customers since 1/7/2019
Not reported for recycled water customers
Page 73
RDMP - Background information and recommended plan components
Action
6: Rainwater Tank Rebates
Target groups All residential customers
Objectives
• Encourage the use of rainwater to supplement potable water supplies.
• Increase take-up of rainwater tank rebates through training and cost-effective, tailored marketing activities.
Task Responsibility Description Status Progress/Challenges
6.1 RCC Develop and implement a communication and engagement strategy (including media kit) to increase the uptake of rainwater tank rebates
Complete
Communications have focused on ensuring stakeholders have the correct information to relay to their customers about the program. Online application form being developed. In 2020/21, 63% of total applications reported the rebate influenced their decision to purchase a rainwater tank. This outcome is similar to annual data collected since 2012/13, where the rebate influenced 67% of applicants in deciding to purchase and install a rainwater tank. Since 2017/18, approximately one third of applicants have connected internal fixtures (toilets and washing machines) to their rainwater tanks.
In 2020 an electronic customer survey was sent to recipients of the rebate program over the previous three years (230 in total). Of the 32 customers completed and returned the survey, 14 expressed interest in investigating their water consumption before and after installing the rainwater tank. 6.2 RCC Develop and implement a training program for council staff, plumbers and tank suppliers
Page 74
RDMP - Background information and recommended plan components
Ongoing
Ongoing
Ongoing Communication with plumbers, tank suppliers and constituent councils is ongoing. 6.3 RCC Implement rebate program within RCC supply area
RCC administers the program throughout the region and invoices constituent councils for rebates within local supply areas.6.4 BaSC, BySC, LCC, RVC Implement rebate program within local supply areas
Key indicator of success
KPI
Number of rebates provided 65 p.a.
Reduction in metered potable water supply for participating customers 25%
Tank suppliers and council staff trained/ “accredited” KPI to be developed as part of training program
Actual performance
2018/19 69 (RCC) and 2 (local)
2019/20 136 (RCC) and 25 (local)
2020/21 114 (RCC) and 17 (local)
Total tank volume approved 2.47 ML
Reduction in consumption has not been calculated due to many variables involved. A greater understanding of household water consumption before and after tank installation has been developed for customers who consented to providing their billing data
Not reported. Tank suppliers have been informed through annual email distribution.
Page 75
RDMP - Background information and recommended plan components
Action 7A: Community Engagement and Education - Households
Objectives
• Provide information to assist households to use water more efficiently. • Improve understanding of household consumption compared to benchmarks and targets. • Provide practical tools that allow consumers to take specific action relevant to their water use activities. • Provide resources to deliver water efficiency messages. • Improved promotion of voluntary permanent water saving measures. Action 7B: Community Engagement and Education - Schools
components Page 76
RDMP - Background information and recommended plan
Target groups All residential customers
Target groups Preschools, primary and secondary schools
Objectives • Promote water efficiency messages through school education. • Improved promotion of voluntary permanent water saving measures. Action 7C: Community Engagement and Education High Residential Water Users
Task Responsibility Description Status Progress/Challenges 7.1 All LWUs Develop local residential consumption targets to support achievement of regional targets. In progress RCC and BaSC: 160
LCC, RVC and BySC have
targets.
Target groups Residential customers with high (>2 kL/d) consumption. Objectives • Implement actions to reduce consumption of high residential water users. • Improved promotion of voluntary permanent water saving measures.
L/p/d.
not developed
Task Responsibility Description Status Progress/Challenges
7.2 RCC Develop and implement a communication and education program targeting residential households including engagement with customer service staff.
7.3 RCC Develop communication materials including webpage, fact sheets, media releases and social media posts
Complete
Complete Strategy developed (RCC, 2020) to develop a comprehensive online water saving tool kit (inclusive of interactive home water calculator), targeting high residential water users and households. This will form the next phase of the 160 L Challenge campaign. The program was promoted via radio campaigns across three local stations, Echo newspaper article, regular social media posts as well as piloting bus shelter signage across each local government area and Flush Media (advertising in public bathrooms of locations frequented by local residents including cinemas, cafes and restaurants).
RCC directly engaged 230 residents who received a rainwater tank rebate in the last three years of the program (as per the program guidelines) and provided them with a suite of online water savings resources including an online water calculator tool. These resources were published in partnership with Smart Approved Water Mark
7.4 RCC Develop improved water bills to be utilised across the region Not started
Page 77
RDMP - Background information and recommended plan components
Task Responsibility Description Status Progress/Challenges
7.5 RCC Develop and implement a communication and engagement program targeting schools
Ongoing Dorroughby Environment Education Centre (DEEC) continues to run “Water Modules” environmental education modules for primary schools which includes a field trip to Rocky Creek Dam. DEEC delivers these modules on an 'as needs' basis as part of the suite of modules available for schools but has limited capacity to deliver anything more. DEEC reports the outcomes (including number of students) who have participated in the Water Modules.
Through involvement in the Green Innovations Awards 2021, RCC has presented and provided mentorship at two schools around water related project ideas and innovations. RCC attended the Green Innovation Awards Innovation Days at SCU to assist students to develop their green, sustainability ideas.
RCC has attended school visits to help present the catchment trailer, engaging school students in the value of water, where water comes from and water in the broader context of catchments. Five schools were visited in 2020 2021, with other visits prior to this. Rous also engaged local school students at community events like PRIMEX.
7.6 RCC Communicate with schools and identify partners to conduct face to face school based activities
In progress RCC has met with DEEC to establish partnership opportunities to engage schools in water wise education and awareness raising.
7.7 RCC Review and update web based educational resources Complete RCC continues to utilise collateral provided by Smart Approved WaterMark (SAWM) to promote messaging around water conservation, efficiency and water literacy. These resources, including the calculator tool, have been published on the RCC website and are promoted by RCC.
7.8 RCC Develop high residential water users program In Progress
Page 78
RDMP - Background information and recommended plan components
Task Responsibility Description Status Progress/Challenges
7.9 RCC Develop and implement a communication and engagement program targeting high residential water users
Not started Strategy developed (RCC, 2020). Once RCC webpage targeting high users is live, councils have agreed to disseminate information to high residential users.
7.10 RCC Develop online home water audit tool Complete Link to SAWM online calculator is available on council websites.
7.11 RCC Ongoing development and delivery of community engagement and education program Ongoing -
Key indicator of success
KPI
Actual performance
Residential demand per connection region 165 kL/a (2022) 187 kL/a (2019), 176 kL/a (2020) - Appendix 5
Residential demand per connection local supplies
Local targets to be developed Targets not yet developed
Residential demand per capita region 175 L/person/day (2022) 194 L/person/day (2020) Appendix 5
Residential demand per capita local supplies
Local targets to be developed Targets not yet developed
Number of participants in high residential user program 50 p.a. from year 3 (2020/21) Not yet commenced
Water savings achieved by high residential user program participants 25% Not yet commenced
Page 79
RDMP - Background information and recommended plan components
APPENDIX 4 BENEFIT COST ANALYSIS
RDMP Background information and recommended plan components Page 81
RDMP investment actions SWPP and rainwater tank rebates
For the current rebates offered and the SWPP actions in the RDMP 2019 2022, the annualised costs per kL of water saved by the councils and their customers have been calculated based on the net present value (NPV) of the net expenditure and the predicted water savings. This calculation provides an indication of the relative investment for each action as a function of water saved to enable comparison between the actions on a cost basis. The council cost represents the net investment made by RCC on behalf of the councils (expenditure less the reduced cost of water production) and the customer cost represents the net investment made by the customer (expenditure less the reduction in water bill). A positive value indicates that the costs are higher than the monetary savings and a negative cost indicates that monetary savings are higher than costs (over the life of the product). The calculations include the following assumptions:
• Rainwater tank supply costs have been estimated from retail suppliers and installation and internal plumbing costs have been estimated. In practice, the costs of internal plumbing will vary significantly with each customer’s circumstances.
• Water savings for rainwater tanks have been estimated using the Rainwater Tank Model developed by the state government
• Council savings due to reduced water production have been estimated using the marginal cost of potable water (RCC cost of supply from Rocky Creek Dam and Nightcap water treatment plant = 51 c/kL).
• Customer savings due to reduced water bills have been estimated on the basis of the average constituent council 2019/20 step 1 usage charge ($2.84 per kL).
• The lost revenue from the sale of potable water has not been considered in the analysis.
• SWPP project costs, RCC funding and estimated water savings were provided by RCC based on data in the completed water savings plans for the SWPP participants.
• The annualised cost of the rainwater tanks is provided for an estimated life of 10 years at a discount rate of 5%.
The predicted water savings, council cost and customer cost for the SWPP and the existing rainwater tank rebates are summarised in Table 13. The actions with the lowest (or negative) council cost are considered to be the most cost-effective. Any customer savings (negative customer costs) are an indirect benefit of the action that may encourage take up but should not be used to identify cost effectiveness.
Apart from the lowest level of rebate ($200 for a 2,000 4,499 kL tank without outdoor use only), the rainwater tank rebates do not provide a financial benefit to RCC (for expenditure of public funds). The benefit to the customer generally increases as the tank size increases and indoor plumbing is included, but the benefit to RCC (and the community through public funding) generally decreases, reflecting the increasing rebate offered.
The SWPP is cost effective for the councils and customers which reflects the program’s focus on the actions with the largest water savings.
RDMP Background information and recommended plan components Page 83
Table 13: Cost-benefit analysis existing SWPP and rainwater tank rebates
Action Number of participants (2019 2021)
Estimated cost Rebate Predicted water saving (kL/a)
Council cost (per kL) Customer cost (per kL)
SWPP1 16 (2016 2021) $212,498 $44,974 23,120 -$1.94 -$1.95
Rainwater tank rebates2
3 kL, outdoor use 62 (2,000 4,500 kL) $1,095 $200 55 $0.06 $0.83
5 kL, outdoor use 99 (4,500 9,000 kL) $1,190 $800 62 $1.08 $2.06
10 kL, outdoor use 42 (9,000 46,000 kL) $1,990 $1,000 68 $1.30 $1.04
3 kL, outdoor + toilet use 1 (3,830 kL) $2,095 $820 69 $0.96 -$0.56
3 kL, outdoor + toilet use + washing machine use 7 (2,000 4,500 kL) $2,395 $1,370 79 $1.63 -$1.24
5 kL, outdoor + toilet use 2 (5,000 kL) $2,190 $1,420 82 $1.63 $1.68
5 kL, outdoor + toilet use + washing machine use 44 (5,000 8,000 kL) $2,490 $1,970 94 $2.07 $2.16
10 kL, outdoor + toilet use 2 (10,000 kL) $2,990 $1,620 94 $1.62 $1.04
10 kL, outdoor + toilet use + washing machine use 47 (9,000 110,000 kL) $3,290 $2,170 112 $1.88 $1.61
1. The customers involved in the SWPP included eight separate tourist park businesses. The majority of savings were achieved through a single project.
2. Assumptions: Rainwater tank supply costs have been estimated from retail suppliers and installation and internal plumbing costs have been estimated. In practice, the costs of internal plumbing will vary significantly with each customer’s circumstances. Water savings for rainwater tanks have been estimated using the Rainwater Tank Model developed by the state government. Council savings due to reduced water production have been estimated using the marginal cost of potable water (RCC cost of supply from Rocky Creek Dam and Nightcap water treatment plant = 51 c/kL). Customer savings due to reduced water bills have been estimated on the basis of the average constituent council 2019/20 step 1 usage charge ($2.84 per kL). The lost revenue from the sale of potable water has not been considered in the analysis. SWPP project costs, RCC funding and estimated water savings were provided by RCC based on data in the completed water savings plans for the SWPP participants. The annualised cost of the rainwater tanks is provided for an estimated life of 10 years at a discount rate of 5%.
Page 84
RDMP - Background information and recommended plan components
Water savings from other RDMP measures
The achievable water savings for other programs (education, smart metering etc.) are uncertain. Significant variation is expected amongst customers, LGAs and would also be influenced by other measures implemented. The influence of tourists on water usage is a significant factor in the RCC region. Although some water savings can be hardwired, short term visitor behaviour is typically difficult to influence, unless there is a crisis such as a drought.
Significant investment in customer communications and providing customers with an attractive business case to change their water use behaviour is key to the success of customer engagement actions. For smart metering, the estimated savings generally relates to the reduction of household internal/external leakage (after the meter), i.e. around 2 4% (Stantec, 2021). The RCC smart metering pilot project 2014 2017 was effective in obtaining water savings between 10 15% for participating businesses who were adequately engaged and motivated (Hydrosphere Consulting, 2018) Water savings from programs implemented by the constituent councils (smart meters, water loss management) will depend on investment, network configuration, customer mix etc.
Unitywater conducted a review of the economic impact of reducing real losses and which of the four pillars provide the best result (WSAA, 2019b). Speed and quality of repairs was excluded because this had already been resolved using network monitoring and analytic services:
• Active leakage control potential to reduce to 37.2 L/connection/day, and for every dollar spent on mitigating leakage, three dollars is saved on bulk water costs.
• Pressure management potential to reduce to 33 L/connection/day but deploying this can be problematic if fire flows are reduced below current regulations, especially in coastal areas with high density housing and/or commercial development.
• Pipeline and assets management (network renewals) are not cost effective for leakage reduction only, but if done for additional reasons it could be cost effective.
Analysis of investment actions implemented by other councils
Tweed Shire Council
Demand management actions previously implemented by Tweed Shire Council (TSC) were reviewed in Hydrosphere Consulting (2020a) with the cost benefit analysis outcomes summarised in Table 14. The methodology is similar to the cost benefit analysis described for the RDMP actions and assumptions are provided in Hydrosphere Consulting (2020a).
RDMP Background information and recommended plan components Page 85
Table 14: Demand management annualised costs - TSC
Item Approximate item cost
Residential rebates
Rebate Estimated life of product (years)
Estimated water saving (kL/a)
TSC cost (per kL) Customer cost (per kL)
Showerhead $100 $50 5 70 $0.49 $0.35
Tapware $100 $50 5 15 $0.08 $0.44
Aerators/flow controllers $50 $25 5 5 $0.28 $0.38
Dual flush toilet $400 $200 15 50 $0.28 $0.38
Top water user program
Top 20 users $6,217 $4,633 Various (assumed 10) 1,650 $0.30 $2.90
Top 100 users $1,000 $1,000 Various (assumed 10) 350 $0.30 $2.67
Council’s top 20 users Murwillumbah pool leak repair $10,000 Assumed 20 1,825 (5 kL/d) $0.23
Nursery irrigation system $40,438 Assumed 10 Unknown Unknown
Source: adapted from Hydrosphere Consulting (2020a)
The review undertaken for TSC (Hydrosphere Consulting, 2020a) provided the following recommendations which are also considered to be relevant to the Rous region. However, it is important to note that the cost effectiveness of investment actions such as rebates will depend on the value of the rebate as well as the product selected:
• Investment in showerheads and aerators/flow controllers is cost effective.
• Tapware rebates are not cost effective.
• Investment in dual flush toilets is cost effective and future demand management programs should include rebates for dual flush toilets.
• There are numerous similar WELS rated products available on the market and a review of the rebate program should be undertaken to include a wider range of household fixtures, fittings and appliances such as washing machines and dishwashers. The rebate program should be targeted to households with high consumption, customers with older water intensive products and customers that may not be able to afford to upgrade their fixtures, fittings and appliances. Marketing of the program to target customers as well as home water audits are required to increase the take up of the rebates and target these customers.
RDMP Background information and recommended plan components Page 86
• The residential rebate program should be expanded to include outdoor fixtures and fittings and target discretionary uses of water. Numerous water efficient outdoor watering and garden products are available (rated by WELS or certified by Smart Approved WaterMark). Councils could purchase certified water efficient products in bulk and sell these to customers at a subsidised price or refund a component of the cost of a certified product purchased by the customer. However, to improve uptake of the rebates, the program should be supported by education and linked to other demand management measures such as rebates.
• Despite the community support identified by TSC in community surveys, rainwater tank rebates are not considered to be cost effective for TSC and therefore rainwater tank rebates were not recommended.
• Future demand management measures should continue to target the highest water users that were not included in the previous program. The residential rebate program should also be expanded to non residential customers where upgrading to water efficient fixtures, fittings and appliances is advantageous. A targeted engagement and audit program is required to support the top water users to reduce demand.
• Water use at council facilities should continue to be reviewed. Water efficiency improvements for council operations such as flushing mains, open space irrigation and facilities maintenance should be identified. Analysis of water use and procedures is required prior to development of an improvement plan. Water efficiency improvements should be showcased (e.g. water efficient landscaping) to demonstrate leadership and encourage customer water efficiency.
• Future replacement of customer meters should include smart metering although significant development of a smart metering program is required before it can be implemented.
• Education and awareness programs are a key component of a successful demand management program and it is recommended that the education materials are reviewed and updated on a regularly and used to promote other demand management program measures.
• Due to high losses in the TSC water supply systems, development of a water loss management program was recommended.
• While rainwater tanks were not recommended as a part of the TSC rebate program, TSC’s Rainwater Tank Policy provides guidance to property owners who wish to install a rainwater tank, particularly in relation to health requirements. However, it should be made clear that rainwater tanks are generally not cost effective and are likely to fail during low rainfall conditions.
• Council should continue to ensure all bulk water sales and uses are metered and costs are recovered. Opportunities for water theft should be minimised.
Following the review of demand management measures, TSC adopted the recommendations from Hydrosphere Consulting (2020a) with a focus on the following high priority options:
• Implementing enhanced leak detection and correction system and processes.
• Improving data collection as part of a shift towards digitisation of data collection with the introduction of smart metering.
RDMP Background information and recommended plan components Page 87
• Enhance incentive programs, especially with the introduction of a targeted program for those who are disadvantaged.
Clarence Valley Council and Coffs Harbour City Council
The Regional Water Supply Scheme supplies raw water to the Clarence Valley and Coffs Harbour region (Coffs Harbour, Grafton, Maclean and Yamba and rural and coast communities). Water efficiency measures were adopted as an integral component of the scheme from the late 1990s. A review of water efficiency planning and a cost benefit analysis of rebate options was undertaken as part of the development of a revised Water Efficiency Implementation Plan adopted by Clarence Valley Council (CVC) and Coffs Harbour City Council (CHCC) in 2020 (Hydrosphere Consulting, 2020b). The methodology is similar to the cost benefit analysis described for the RDMP actions and assumptions are provided in Hydrosphere Consulting (2020b). The predicted water savings, cost for CVC and CHCC and the respective customer cost for the existing rebates and potential modifications to the existing rebates are summarised in Table 13.
Based on the cost benefit analysis, rebates for showerheads and dual flush toilets will continue to be offered by CVC and CHCC. Rainwater tank rebates will continue to be offered by CVC due to the broad community support despite the limited cost effectiveness although CHCC will no longer offer rainwater tank rebates. Broadening the rebates offered to include outdoor products will target outdoor water use and potentially reduce wastage and discretionary water use. CVC and CHCC will purchase certified products in bulk and sell these to customers at a subsidised price or refund a component of the cost of a certified product purchased by the customer.
Water efficiency improvements for council operations such as flushing mains, open space irrigation and facilities maintenance is also adopted by CVC and CHCC. Analysis of water use and procedures is required prior to development of an improvement plan. Water efficiency improvements will be showcased (e.g. water efficient landscaping) to demonstrate leadership and encourage customer water efficiency.
RDMP Background information and recommended plan components Page 88
Table 15: Cost-benefit analysis rebates (CVC and CHCC)
Product Rating of product Product replaced Estimated cost Rebate Water saving (kL/a)
CVC rebates offered 2013 - 2020
Council cost (per kL) Customer cost (per kL)
Showerhead 3 star, 9 L/min 15 L/min $120 $25 70 -$0.54 -$2.19
Dual flush toilet 4 star, 3.5 L 12 L $300 $50 50 $0.40 $1.38
Rainwater tank 3 kL, outdoor use $900 $450 55 $1.18 $0.69
Rainwater tank 5 kL, outdoor use $1,200 $700 62 $1.86 $0.72
Rainwater tank 10 kL, outdoor use - $2,050 $1,100 68 $2.93 $0.58
Rainwater tank 3 kL, outdoor + indoor use - $1,900 $750 79 $1.46 $0.71
Rainwater tank 5 kL, outdoor + indoor use $2,200 $1,000 94 $1.72 $0.32
Rainwater tank 10 kL, outdoor + indoor use $3,050 $1,400 112 $2.13 $0.75
CHCC rebates offered 2013 2020
Showerhead 3 star, 9 L/min 15 L/min $120 $25 70 -$0.84 -$2.75
Dual flush toilet 4 star, 3.5 L 12 L $300 $30 50 -$0.78 -$1.29
CVC modified rebates
Showerhead 4 star, 6 L/min 15 L/min $120 $60 105 $0.50 $2.36
Showerhead 4 star, 6 L/min 15 L/min $120 $120 105 -$0.37 -$2.49
Dual flush toilet 4 star, 3.5 L 12 L $300 $100 50 -$0.18 -$1.60
Dual flush toilet 4 star, 3.5 L 12 L $300 $150 50 $0.04 $1.83
Page 89
RDMP - Background information and recommended plan components
Product Rating of product Product replaced Estimated cost Rebate Water saving (kL/a) Council cost (per kL) Customer cost (per kL)
Dual flush toilet 4 star, 3.5 L 9.0 L full / 4.5 L half $300 $100 12 $1.15 $1.06
CHCC modified rebates
Showerhead 4 star, 6 L/min 15 L/min $120 $60 105 $0.79 $2.92
Showerhead 4 star, 6 L/min 15 L/min $120 $120 105 $0.66 $3.05
Dual flush toilet 4 star, 3.5 L 12 L $300 $100 50 $0.47 $1.60
Dual flush toilet 4 star, 3.5 L 12 L $300 $150 50 $0.25 $1.83
Dual flush toilet 4 star, 3.5 L 9.0 L full / 4.5 L half $300 $100 12 $0.86 $1.06
Source: Hydrosphere Consulting (2020b)
Page 90
RDMP - Background information and recommended plan components
APPENDIX 5 REGIONAL DEMAND DATA
RDMP Background information and recommended plan components Page 91
Water loss indicators
Potable water supplied to customers includes (Figure 7):
• Water supplied, W - Treated water from the water treatment plants.
• Metered billed consumption, C (revenue water supplied) water sold to residential and non residential customers.
• Unbilled unmetered authorised consumption Any unmetered authorised consumption for which a bill is not issued to the consumer (e.g. process water at water treatment works, hydrants for mains flushing, fire services, etc.).
• Water losses, consisting of:
o Apparent losses consisting of: Unauthorised consumption illegal use. Customer metering errors.
o Real losses leakage and overflows from mains, service reservoirs and service connections prior to customer meters.
NRW is the water supplied that is "lost" before it reaches the customer:
NRW = total potable water supplied, W metered billed consumption, C
Figure 7: The potable town water supply balance
Source: Adapted from National Water Commission (2014)
NRW is expressed in volume units as well as a percentage of total potable water supplied, although the percentage may be misleading when demand is abnormally high or low for a particular period.
Benchmarking data on real losses (leakage) and non-revenue water (NRW) are provided in Table 7. The Infrastructure Leakage Index (ILI) is used as an indicator of how effectively real losses are being managed at the current operating pressure while accounting for other factors such as length of mains, number of service
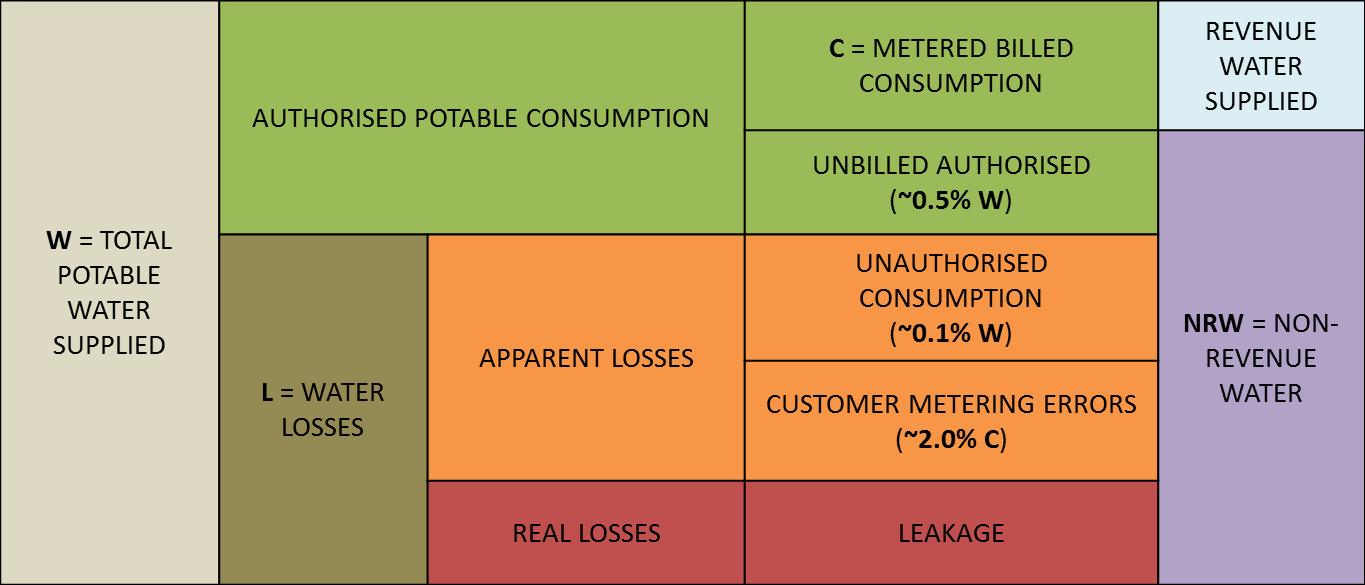
RDMP Background information and recommended plan components Page 92
connections and customer meter location. The ILI is calculated from the ratio of the Current Annual Real Losses (CARL) to the Un Avoidable Real Losses (UARL). CARL is the annual real losses divided by the number of service connections and percent of time the system is under pressure. UARL is a function of length of mains, number of service connections and average system pressure. An ILI of 1.0 indicates that only unavoidable losses are occurring and that optimum leakage management is in place (NSW Government, 2021).
Customers and demand
Data on water supply customers and regional demand for 2019/20 reported by the NSW Government from performance indicator data supplied by the councils and data from the RCC Demand Forecast (Hydrosphere Consulting, 2020c) is provided in the following tables.
Table 16: Water supply connected properties (total regional and local supplies) 2019/20
LWU Residential Non-residential Total
Ballina 14,698 1,628 2,075 Byron 9,518 1,453 16,326 Lismore 13,673 1,596 15,269 Richmond Valley 6,614 737 10,971 Rous retail 2,075 7,351 Region 46,578 5,414 51,992 Source: NSW Government (2021).
Table 17: Permanent population served by water supplies 2019/20
LWU Regional supply Local supply Total Rous 4,928 4,928 Ballina 33,859 715 34,574 Lismore 32,208 396 32,604 Byron 23,047 4,142 27,190 Richmond Valley 6,630 10,554 17,184 Region 100,672 15,808 116,480 Calculated from connected residential properties reported in the RCC Demand Forecast (Hydrosphere Consulting, 2020c) and average occupancy ratio from 2016 Census.
RDMP Background information and recommended plan components Page 93
Table
Rous retail 1,056 10,727 11,783 207 11,990 1.7% Ballina 2,465 578 3,043 687 3,730 18.4% Lismore 1,733 649 2,382 593 2,975 19.9% Byron 1,901 773 2,674 317 2,991 10.6% Richmond Valley 1,036 1,562 2,598 300 2,898 10.4% Region 8,191 3,562 10,727 11,753 2,105 13,858 15.2% Regional demand and demand per connection (regional and local supplies) for the period 2012/13 2019/20 is shown on Figure 8 and Figure 9 respectively. Restrictions were imposed throughout the region in 2019/20 which would have reduced total demand.
RDMP Background information and recommended plan components Page 94
Non residential Bulk supply Total revenue
NRW Total
18: Potable urban water demand in the region (total regional and local supplies) - 2019/20 LWU Potable urban water supplied (ML) Residential
water
% NRW
2012/13 2013/14 2014/15 2015/16 2016/17 2017/18 2018/19
Connected
Revenue Water Supplied NRW Total Demand Connected properties
Figure 8: Regional demand and connected properties: 2012/13 2019/20 0 10,000 20,000 30,000 40,000 50,000 60,000 0 2,000 4,000 6,000 8,000 10,000 12,000 14,000 16,000
2019/20
properties Demand (kL/a)
kL/a
300
250
200
150
100
50
283 294 282 269 277 277
182 186 182 172 186 182 187 176
298 267 0
350 2012/13 2013/14 2014/15 2015/16 2016/17 2017/18 2018/19 2019/20
Residential consumption per connection Total demand per connection
Figure 9: Regional residential consumption and total demand per connection: 2012/13 - 2019/20
Residential consumption data is measured at the customer meter and does not include water losses. Total demand per connection includes water losses and consumption for all residential and non residential customers.
RDMP Background information and recommended plan components Page 95
APPENDIX 6 BEHAVIOUR CHANGE CURRENT PRACTICE AND LITERATURE REVIEW
RDMP Background information and recommended plan components Page 97


Rous County Council Regional Demand Management Plan Behaviour Change Current Practice and Literature Review For Hydrosphere/ Rous County Council 11 November 2021
Prepared by Liz Ampt
Demand Management Plan – Current Practice & Literature Review Concepts of Change Page | i
3.1.1 Strengths of supply measures 5 3.1.2 Weaknesses of supply measures 5 3.2 Top down measures ...............................................................................................................5
3.2.1 Examples of top down measures 5 3.2.2 Strengths of top down measures 6 3.2.3 Weaknesses of Top Down measures 6 3.3 Voluntary behaviour change measures 7 3.3.1 Examples of voluntary behaviour change 7 3.3.2 Strengths of voluntary behaviour change ................................................................7 3.3.3 Weaknesses of voluntary behaviour change 8 3.4 Need for a combined approach .............................................................................................8
Demand Management Plan – Current Practice & Literature Review Concepts of Change Page | ii
................................................................................................................
.............................................................................
..............................................................
Contents 1. Background
3 2. Options for Bringing About Change
3 2.1 Supply measures ....................................................................................................................3 2.2 Top down measures 3 2.3 Voluntary behaviour change measures 4 2.3.1 Basis in Community Development 4 3. Strengths and Weaknesses of Each Approach
5 3.1 Supply Measures 5
.......
................................................................................................................29 5. Summary .................................................................................................................. 33 6. References ................................................................................................................ 34 7. Appendix – Examples of tools prepared for Great Southern ....................................... 36
4. State of the Art/Practice in reducing residential water consumption in Australia
10 4.1 The H2ome Smart Program in the Great Southern Region of Western Australia 17 4.1.1 A facilitative conversation 17 4.1.2 Supportive program and ongoing coaching 18 4.1.3 Results 21 4.2 Adapting the program to other regions 7 WA Wheatbelt towns 23 4.2.1 Results 24 4.3 Geraldton .............................................................................................................................26 4.4 Ongoing programs
1. Background
Rous County Council wants to develop a Demand Management Plan and would like to include a behaviour change program which produces a measurable reduction in water use in all households in the County with change retained over 5 years In particular the County Council would like to focus on voluntary behaviour change measures (see Figure 1) because infrastructure measures (engineering solutions) have almost been fatigued and top down demand measures have also been used extensively.
Infrastructure measures (supply measures)
Voluntary behaviour change
Individual Goals or Drivers
needs Information and Tools of Change
Top down measures (demand measures) regulation pricing education/marketing technology or engineering
2. Options for Bringing About Change
2.1 Supply measures
These include augmenting existing supplies by construction of more dams and use of other sources such as ground water. They are not the focus of this discussion as we are concentrating on non supply measures in this plan.
2.2 Top down measures
There are many frameworks for categorising the way in which people (consumers) can change but most identify the non supply changes shown in Figure 1 in one way or another For example, the Argonne National Laboratory in the USA uses different terminology for top down measures, but has some useful definitions that increase understanding (Levin and Meuhleisen, 2016)
• Forced change (= top down measures in Figure 1) – change that can be implemented through policies, regulations and standards, commercial fixtures and appliances
• Education programs (which they term ‘voluntary’ in that it is not regulatory) with the goal of people consciously changing their consumption habits
Demand Management Plan – Current Practice & Literature Review Concepts of Change Page | 3
Figure 1 Options for bringing about change (Ampt 2012)
Often
2.3 Voluntary behaviour change measures
Levin and Meuhleisen term this transformative change and define it as ‘change achieved when people take actions not because they are consciously trying to reduce water use, but because those actions actually add convenience to their daily routine.’
In Australia the voluntary behaviour change approach has been defined as ‘helping people to help themselves bring about change to an aspect of water use that has bothered them’ (e.g. Ampt et al, 2013)
The underlying principles of the approach are summarised in Figure 2 which illustrates the processes involved in making sustainable voluntary behaviour change at an individual level but in the context of the household and community.
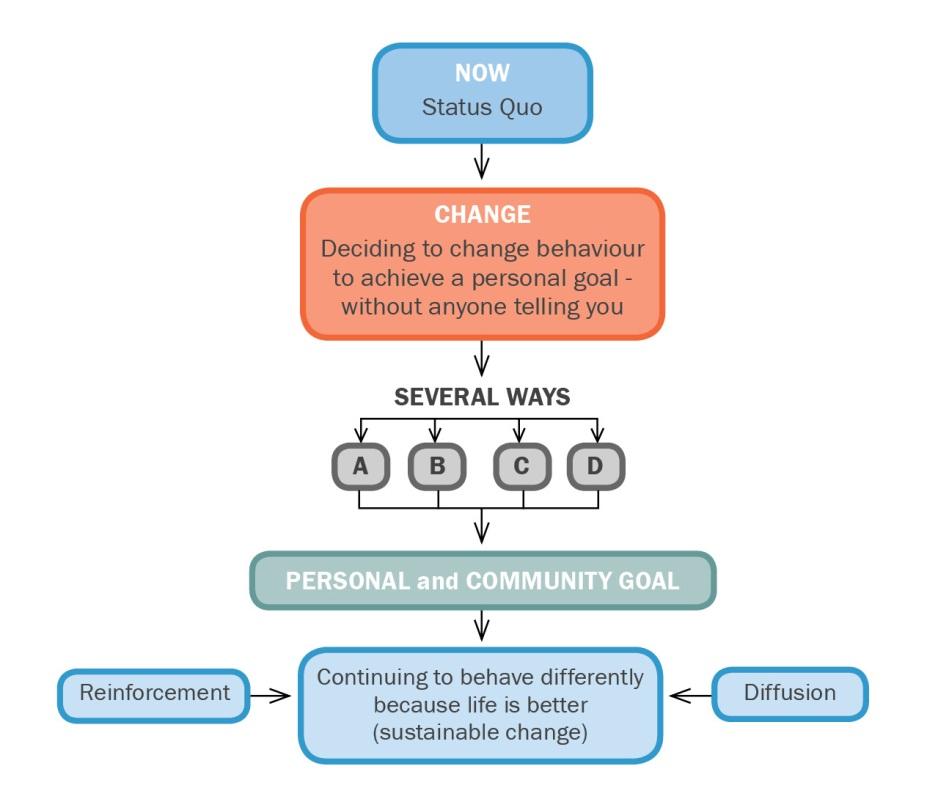
Figure 2: The conditions surrounding voluntary behaviour change (Source: Ampt 2003)
• Arriving at a point where the negative effects of an existing activity reach a level of intolerance (includes making a change that they are contemplating but have not got around to). The approach uses the notion of cognitive dissonance (the tension experienced when values do not match behaviour - Festinger et al., 1956)
• Realising for the first time that it is possible to change
• Hearing of someone else who has changed – especially a “trusted other”
• Experiencing a change moment e.g. new job, school, house, partner (e.g. Williams 2004), and
• Feeling that change is fashionable or wanting to follow new social norms. The approach uses principles from community development (described in the next section) that stimulates the householder to reflect on any of the above and make a commitment to change.
2.3.1 Basis in Community Development
Community development is based on working with people to ‘reflect on their lived reality, to make an analysis of the root causes of that reality and to develop a plan of action for changes’
Demand Management Plan – Current Practice & Literature Review Concepts of Change Page | 4
(Ife, 2002). The individual works in partnership with whatever external resources or expertise are available. It is a bottom up collaboration based on linking individual energy and aspiration with external support and vision.
Community development programs were originally designed to effect behaviour change in some critical area of social activity e.g. health promotion, education and family. More recently they have been adapted to resource usage, as in voluntary behaviour change programs in travel, water, waste and energy use (e.g. Denlay, 2002).
Much has been written about the theory and practice of community development. The principles were first proposed by Edwards Deming (Deming, 1958) in the 1950s, but since then have been widely adapted to situations where lasting change in behaviour and collective thinking are required. The community development approach can be characterised as an unstructured, evolving response by a community to their particular needs or problems. The primary tools are listening and facilitating change rather than ‘telling’.
3. Strengths and Weaknesses of Each Approach
Each of the approaches mentioned in Figure 1 have strengths and weaknesses, which are important to understand when developing a plan or program.
3.1 Supply Measures
As noted above, this note is not focusing on supply measures though their strengths and weaknesses are noted below.
3.1.1
Strengths of supply measures
The strength of engineering or infrastructure measures is that, once implemented, they create more or less permanent reductions in water consumption
3.1.2
Weaknesses of supply measures
The weakness of these measures can be that they cause people’s behaviour to change in the wrong direction (e.g. ‘now we have the new dam we don’t need to save water’.).
3.2
Top-down measures
Top down measures are the most frequently used measures to reduce water use. This is usually because the measures are relatively easy for organisations to implement and can lead to the impression or hope that the problem has been solved.
3.2.1
Examples of top down measures
There are many top down measures so we consider them in four categories.
Regulation
The simplest example of regulation is mandating water saving devices, grey water, smart meters and rainwater tanks in new housing developments or in renovations. It also includes mandatory codes and standards for water related appliances.
Demand Management Plan – Current Practice & Literature Review Concepts of Change Page | 5
Pricing
Pricing mechanisms can be at the broad level of increasing charges for water or at more nuanced levels. The latter include: economic incentives for choosing water saving devices and fines for overuse
Education and marketing
Information and marketing is commonly used to inform people about the need for change in water use. This method is used in water authorities in all jurisdictions in Australia. It can take the form of leaflets, banners, advertisements on billboards or on TV and radio or through social media. This approach is usually predicated on the belief that ‘once you know the issues or the solutions you will take action’.
Technical or engineering approaches
There are many engineering or technical ways to reduce people’s residential water use. Examples include (Peter Basso Associates Inc, 2018):
• Installing low flow plumbing fixtures
• Installing touch free taps so that they turn off automatically after handwashing
• Insulating piping to reduce wait time for water heating up
• Installing drip irrigation or installing rain sensors in the garden.
• Changing to less water intensive plants
• Using alternative water sources (e.g. greywater)
3.2.2
Strengths of top-down measures
The strengths of top down measures lie in the immediacy of change (water reduction in this case). Once low flow fixtures are installed, less water will flow for the same time period and so on.
Volumetric charging for water and a higher average water price appear effective in enhancing water conservation (e.g. Koop et al, 2019)
Knowledge transfer is an important means to making people more receptive to water conservation (e.g. Sime et al 2000 in Perth) though is in itself insufficient to foster behavioural change in the long run
3.2.3 Weaknesses of Top Down measures
Providing information alone not effective in the long term. Fielding et al (2013) tested the long term impact of three different interventions on household water consumption in South East Queensland. Households were allocated into one of four conditions: a control group and three interventions groups (water saving information alone, information plus a descriptive norm manipulation, and information plus tailored end user feedback). Measurement was via smart meters. The three intervention groups all showed reduced levels of household water consumption (an average reduction of 11.3 L per person per day) over the course of the
Demand Management Plan – Current Practice & Literature Review Concepts of Change Page | 6
interventions, and for some months afterwards but long term household usage data showed that in all cases water consumption returning to pre intervention levels after approximately 12 months.
Lead to quick short term change, but less long term change see Fielding et al (2013) above.
Providing information needs to be accompanied by increasing understanding of how to take action (self efficacy). Kurz et al (2005) report a Perth study the impact of providing information through leaflets and attunement labels (labels indicating use of water by different appliances in the house) was scrutinised. The leaflets included detailed information about the importance of conserving energy and water, as well as short facts, and tips. By contrast, attunement labels were installed at specific household appliances (e.g. at the shower, lawns, and garden hose) and provided similar information as the leaflet but specified for the appliance in question. The six month experiment revealed that information leaflets had no impact on water use, whereas the attunement labels resulted in water savings of 23%. It is argued that the attunement labels improved self efficacy (belief that you can change) of using the particular appliance when they were about to use it
Often aimed at segmentation Many studies have concentrated on key social and economic characteristics that may influence water use with the aim of segmenting and sending specific messages to different people. The studies found that higher income correlates with higher water consumption (Xue et al, 2017) while other researchers argue that education level is an explanatory variable for water use (e.g. Syme et al 2000). However the associated correlation is not always clear. As an example in a survey of 26,689 Spanish households Mondejár Jiménez et al (2011) found that although highly educated people tend to know more about environmental issue their level of income leads them to consume more water.
3.3
Voluntary behaviour change measures
Voluntary behaviour change measures have been described in Section 2.3 and examples are given in Section 4.
3.3.1
Examples of voluntary behaviour change
In essence voluntary behaviour change measures are those that allow the people who are targeted for change to find an issue (and reason) they would like to change their behaviour, and then to work out a solution that suits their lifestyle. As part of the program, this change is usually facilitated and accompanied by resources that assist change.
3.3.2
Strengths of voluntary behaviour change
The strengths of this approach are these:
It is known to bring about high levels of behaviour change (see Section 4)
Since the targeted people are working out solutions that suit their lifestyle, they are more likely to continue the change in the long term
Many changes cost the program organisers and the participants very little (e.g. allowing people to source information in a way that suits them rather than providing rebates)
Demand Management Plan – Current Practice & Literature Review Concepts of Change Page | 7
3.3.3
Participants can articulate the changes they have made in ways that explain the benefits they have experienced in their own terms, e.g.
o I have saved time now that I water more efficiently
o My children have stopped bothering me about saving water
o I didn’t think I could help the environment but this is making me feel good
Because of the above, people are much more likely to use word of mouth to encourage further change. ‘Trusted others’ spreading a message is one of the strongest tools of change.
The facilitation approach allows people to ask questions and gain relevant information which helps give them reasons for change, e.g. ‘how would I know how much water I’m using in the shower’ might lead to them being given answers or resources (that suit them) to find the answer.
Weaknesses of voluntary behaviour change
The chief weaknesses of the voluntary behaviour change approach include: The approach is generally seen to be more cost intensive than simply providing information or regulating though longer term cost benefit evaluation has given very positive results (Ampt et al, 2013)
It can be hard to explain to clients that adding this approach to top down measures will result in higher levels of change
3.4 Need for a combined approach
Having reviewed the strengths and weaknesses of different approaches to behaviour change, it becomes clear that each is needed to some extent. For example: Without infrastructure provision (e.g. access to carted water, access to grey water etc.) some options for change would not be available
Regulation (when clearly presented and understood) is very useful to help consumers understand the constraints of the provider (e.g. water saving devices in new developments, water restrictions during drought)
Pricing mechanisms (e.g. incentives for water saving devices) can assist as a ‘tool of change’ when a voluntary behaviour change approach is being taken
Education and marketing (e.g. strong programs for children, signs to show dam levels) can also assist people who are setting their own targets and aiming to make their own changes
Technological mechanisms of which smart metering is a prime example are invaluable for the types of people who like regular digital feedback when trying to make their own changes. This enables them to make choices (e.g. where to focus change)
Demand Management Plan – Current Practice & Literature Review Concepts of Change Page | 8
Voluntary behaviour change approaches are critical to ensuring that participants are facilitated to have options for change. This will mean they can use top down infrastructure and top down measures as tools of change.
The examples in Section 4 are of successful voluntary behaviour change programs which linked with infrastructure and top down approaches to gain maximum residential water use reductions.
Demand Management Plan – Current Practice & Literature Review Concepts of Change Page | 9
4. Relevant behavioural research
4.1 Behavioural insights
Considerable recent behavioural research in Australia has addressed the issue of what type of behaviours can be changed most easily. This is an extremely valuable supplement to assist in a voluntary behaviour change approach.
Ramkissoon et al (2015), as part of a Cooperative Research Centre Project and in conjunction with Behaviour Works Australia did the following research:
1. Identified a pool of water sensitive behaviours through consultation with industry stakeholders, literature review, sub project team expertise and Government water departments.
2. Developed a typology of water sensitive behaviours they relate to Australian communities through a largescale survey in cities (shared with social processes and literacy projects), including identifying both exemplars(water sensitive users) and target audiences where water sensitivity could be increased.
3. Designed a behavioural roadmap by prioritising (by ease of influence and efficacy) and sequencing (by considering potential for behavioural spill over) the pool of behaviours.
4. In controlled conditions, tested the efficacy of market, social marketing and regulatory
They surveyed three samples. The first online sample was large (5194) and they completed a survey about water related behaviours they were undertaking as well as how long they’ve been doing them for. The second online sample was of 151 residents.
The final sample was of 22 water professionals which were recruited through CRCWSC networks and snowballing methods, with a focus on those professionals who had worked on behaviour change campaigns or had a high level of community engagement as part of their position.
The rationale behind asking these impact and likelihood questions of both residents and professionals was twofold, depending on the degree of alignment. First, if they aligned, then water professionals would have a tool they can use to assess impact and likelihood in the future. Such a tool could be used on a variety of scales to tackle a variety of issues. In particular, more water saving behaviours could be added to this database and professionals could, with some confidence, use assessments of impact and likelihood to prioritise behaviours to target. If impact and likelihood assessments made by professionals and residents did not align, then there is an argument for greater consultation with subjects of behaviour change campaigns about behaviours they are more likely to engage in.
All respondents were asked to complete assessments of impact and likelihood for each behaviour relating to water saving. Specifically, they were asked to score each behaviour using a Likert type scale ranging from 1 5, representing very low, low, medium, high, and very high on the following criteria (for water consumption behaviours):
1. Current participation: What is the percentage of households do you think are already doing the behaviour (or have already done it)?
Demand Management Plan – Current Practice & Literature Review Concepts of Change Page | 10
2. Adoption impact: What do you think would be the total reduction in the amount of water used if all nonparticipating households adopted the behaviour?
3. Individual impact: What in your opinion would the effect of taking up the behaviour have on the amount of water saved by an individual household?
4. Physical effort: What, in your opinion, will be the level of physical effort involved in taking part in the behaviour?
5. Mental effort: What is the amount of thinking and planning involved in taking part in the behaviour?
6. Financial cost: How much you think it would cost to take part in the behaviour (or the amount
The following relevant behaviours were analysed:
• Take shorter showers to save water
• Turn off tap when shaving/brushing teeth 1
• Wash full loads of clothes
• Run dishwasher when full
• Fix leaks when you notice them
• Collect water from the shower or sink to use in the garden
• Allow lawn to go brown
• Hose with trigger or timed watering system
• Mulch garden beds
• Don’t use a hose to clean outside spaces, use a broom
• Use half flush or don’t flush every time
• Water garden in morning and evening
• Keep car well maintained
• Wash car at a car wash or on grass
• Installed/purchased water efficient taps or aerators
• Installed/purchased dual flush toilet to replace single flush toilet
• Installed/purchased a low flow shower head
• Installed/purchased a front loader instead of a top loader washing machine
• Installed/purchased a grey water system
• Installed/purchased a water efficient dishwasher
• Installed/purchased a cover for your outdoor pool
• Installed/purchased rainwater tank (plumbed into home e.g. to the toilet and laundry)
• Installed/purchased rainwater tank (not plumbed into home e.g. only used for outdoor use)
• Replaced lawn with drought resistant grasses
4.1.1 The impact and likelihood of change A further study by the CRC researchers using the same data (Wright et al, 2016) was able to identify the impact and likelihood of changed behaviour and a way of prioritising water saving behaviours (Figure 3).
• The top right quadrant includes high impact behaviours, that may already be adopted. Ensure these behaviours are maintained
• The top left quadrant includes high impact behaviours with potential barriers to uptake. Consider addressing these barriers. They noted that the actual amount of water saved from adopting these behaviours may vary according to household and garden size, climate and other environmental conditions
Demand Management Plan – Current Practice & Literature Review Concepts of Change Page | 11
Figure 3 The Impact-Likelihood Matrix Source: Wright et al, 2016
This allowed the researchers to propose behaviours to get consumers to consider in behaviour change programs (Figure 4).
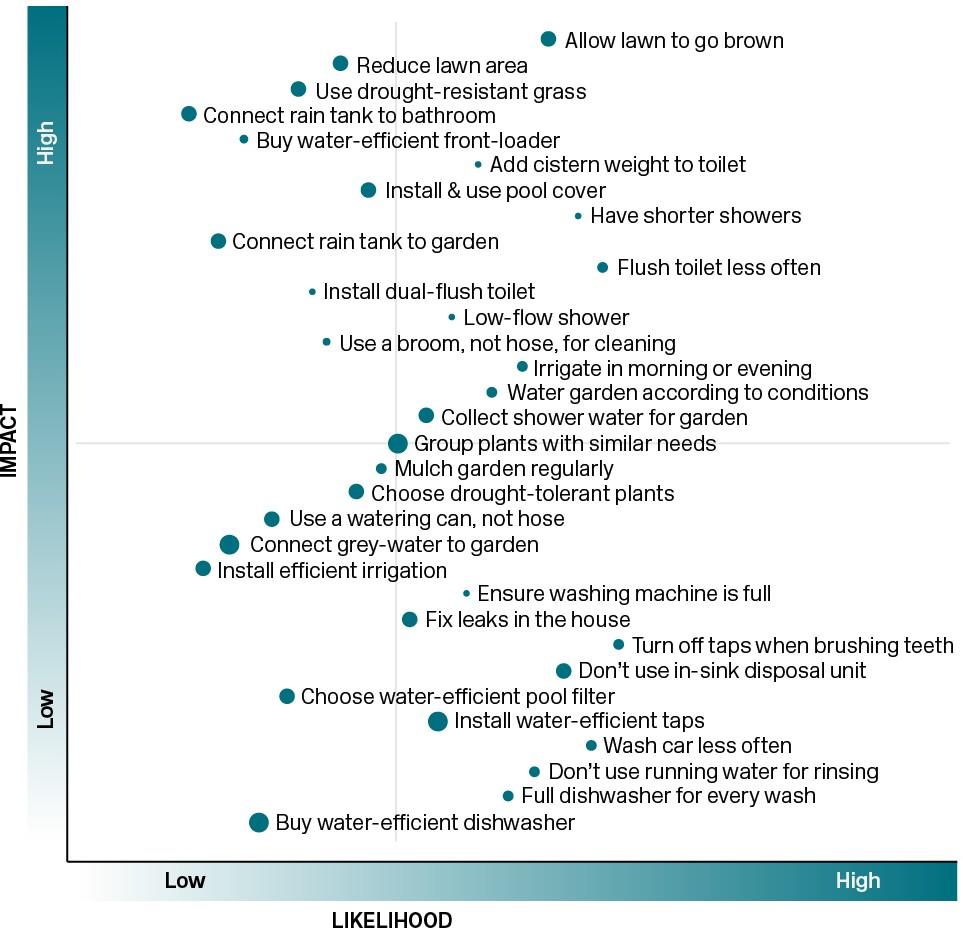
Demand Management Plan – Current Practice & Literature Review Concepts of Change Page | 12
4.1.2 Differences between consumers and water professionals
There was almost always a significant difference between the perceptions of water professionals and consumers suggesting the importance of an approach that allows consumers to make decisions on the ease of change. Figure 5 is an example of the impact and likelihood of fixing leaks when they are noticed for both consumers and water professionals.
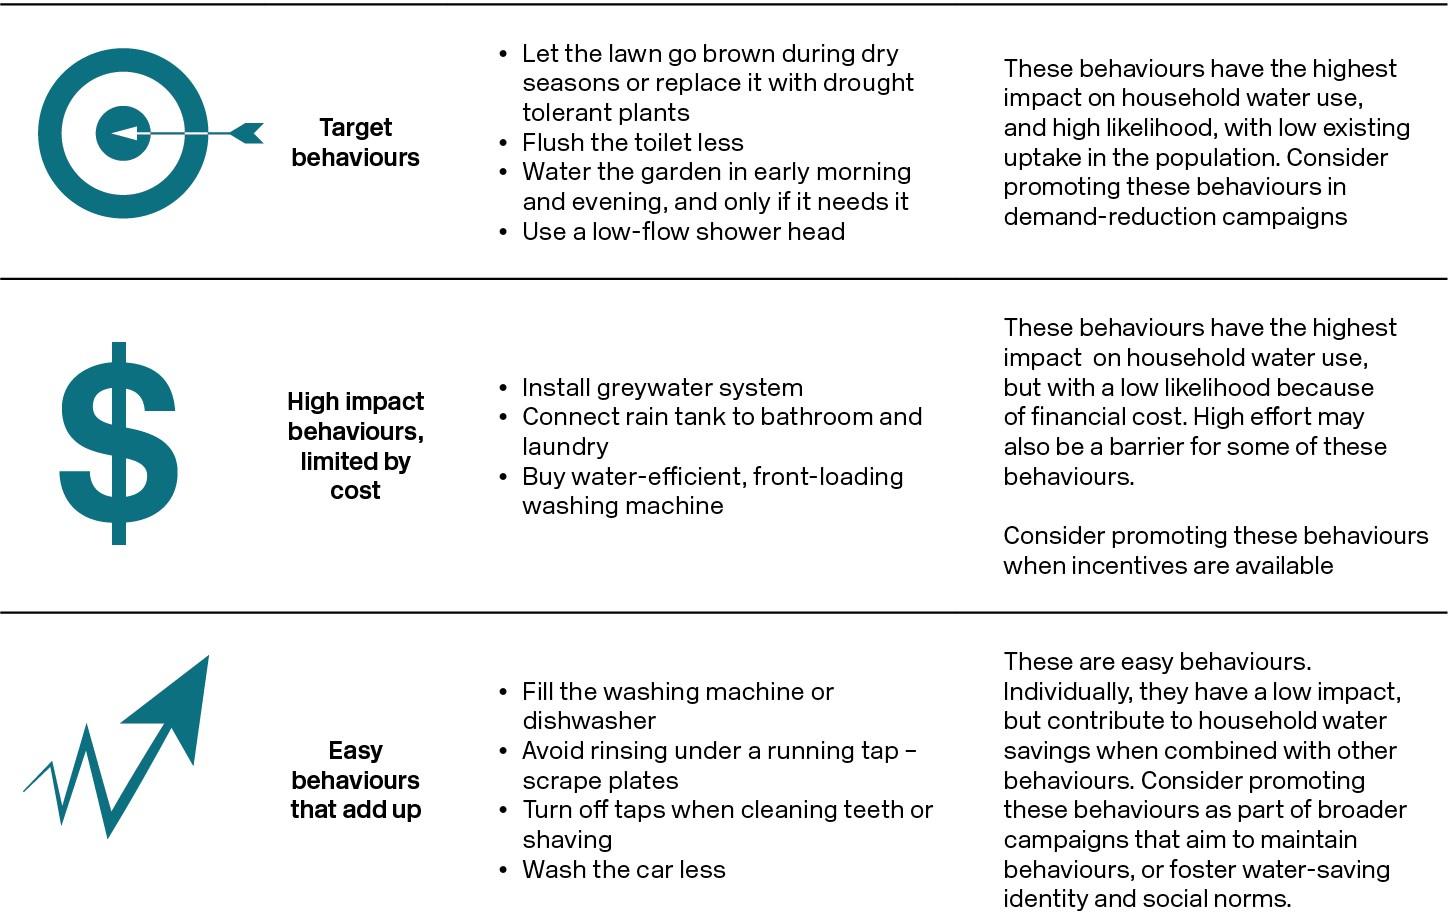
Demand Management Plan – Current Practice & Literature Review Concepts of Change Page | 13
Figure 4 Target behaviours proposed – Source: Wright et al, 2016
Figure 5 Comparison of participation by consumers and water professionals
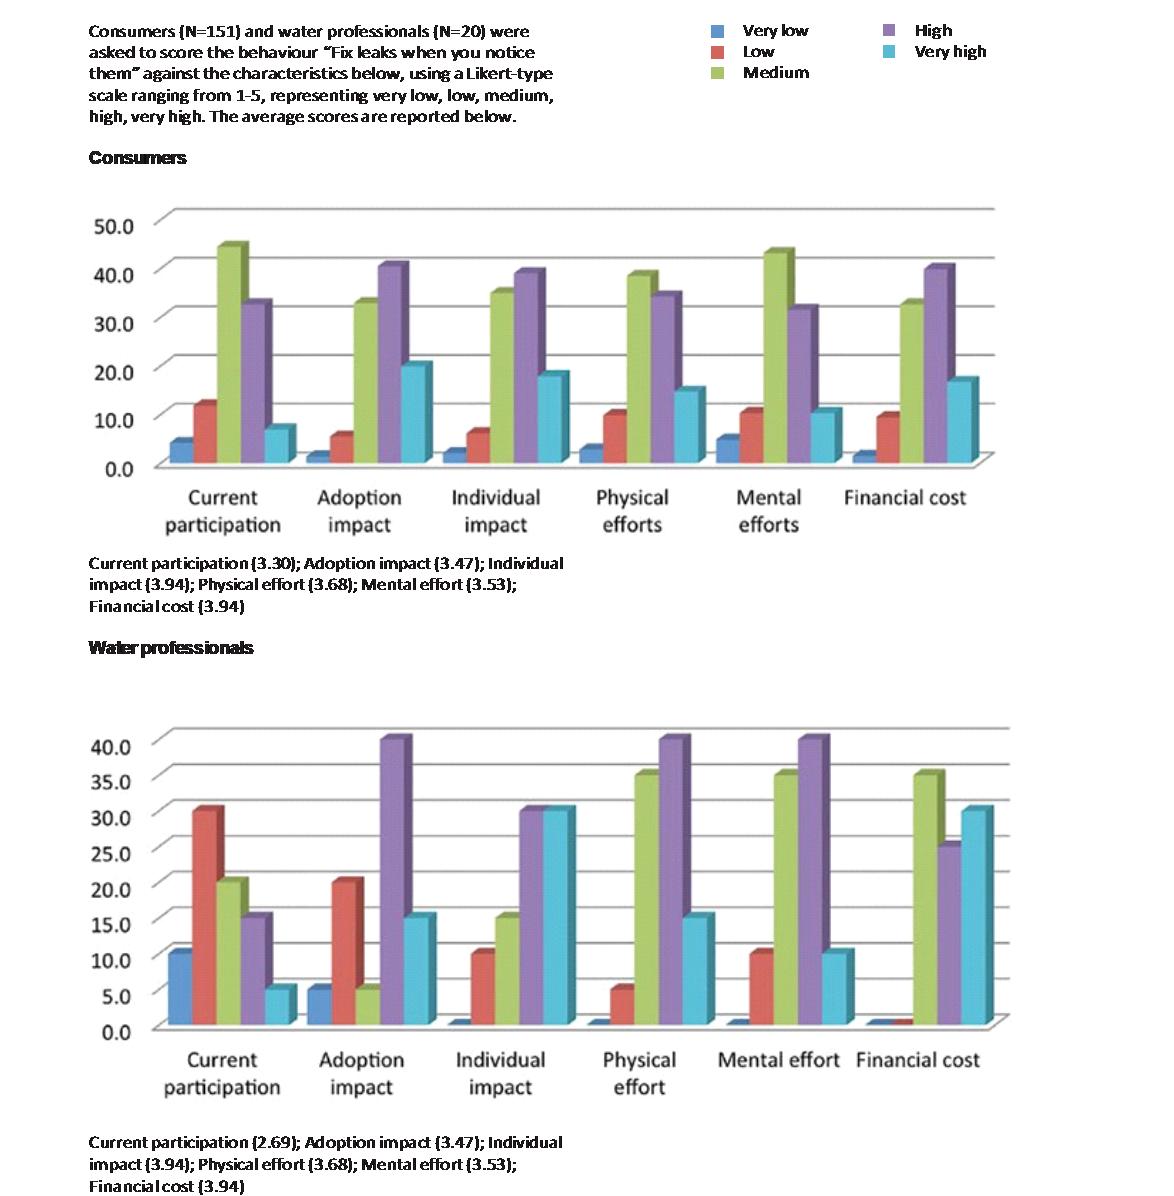
4.2 Other examples
Other examples of behaviour change in water use which are not directly applicable to the Rous situation but may have lessons include:
Research to understand how to better reduce water use in indigenous communities:
o The lack of water conservation knowledge and skills of high water users could be barriers to saving water. Low water users have positive attitudes towards water conservation and a higher level of awareness about their own water use. While there is a lack of a belief that water shortages will occur, low water users do have concerns of vulnerability to droughts, and that could be a driver for their
Demand Management Plan – Current Practice & Literature Review Concepts of Change Page | 14
sense of obligation to engage in water conservation practices. The research recommended communication messages and tools to address identified barriers to enabling positive changes to water use behaviours, which have wider applications in remote Australian Indigenous communities.
https://iwaponline.com/washdev/article/9/4/765/70237/Barriers-andopportunities for behavior change in
A 2017 literature review (Ampt, for Water Corporation) had the following conclusions of relevance. The review examined both psychological aspects of human behaviour as well as practical examples of changing perceptions and behaviour in using and drinking water.
The findings are summarised here.
Consumers think about water in a different way to providers. They are more likely to think of flavour, taste, smell, safety, risk while providers are more likely to think in terms of regulation, safety and quality standards, infrastructure.
People respond differently to the aesthetics of water. Physiologically people taste, smell and react to water differently. Perceived reactions to water can also stem from non water reasons such as soap products and on rare occasions can be the result of an allergy to all water.
Water is valued and understood differently by different groups. Not only are there variations in the way people see water depending on sociodemographic characteristics (e.g. ‘profession’ [what people do on a daily basis], gender) but it is also different for people with rural and urban backgrounds and different religious and cultural beliefs. For example many Aboriginal people in Australia believe that at death an individual’s spirit returns to the water to once more become part of the ancestral force. Differences in values are likely to be an important influence on perceptions of water and likelihood of changing.
Trust of people and organisations providing the water and of the ‘messengers’ of information about water quality is vital to achieving change. Trust can be achieved by hands on experience (e.g. visiting a water treatment plant or hands on learning)
There is very little research into children’s perceptions of water. Two international studies suggest that the experience of water at school is important in addition to the values of parents.
Previous experience of water either in the same place or from elsewhere is a major determinant of perception. Given that perceptions are formed early, researchers describe the importance of early education in freshwater in general (including sources, uses, importance) as well as composition and quality.
Community engagement needs to take the following into account:
o Information alone is not the solution repeated in many studies.
o Some forms of localised information can be useful bearing in mind perception is based on a combination of multiple factors. The source of information is important
Demand Management Plan – Current Practice & Literature Review Concepts of Change Page | 15
o Participatory approaches are valuable
o Education of children is important from the earliest years
o There need to be different approaches for different communities and different people
Changes in perceptions and water use need to be measured. This is important for the water provider as well as for the consumers. Measurement needs to be done in both qualitative (reported changes) and quantitative (measured changes). Measurement techniques need to be rigorous.
Demand Management Plan – Current Practice & Literature Review Concepts of Change Page | 16
5. State of the Art/Practice in reducing residential water consumption in Australia
This section gives detail of one program which used a voluntary behaviour change approach and linked it with a series of tools of change from top down measures It then shows how that approach was adapted for other regions as would be needed in the Rous region.
Early examples of water use reduction programs are found in the cities of Melbourne and Geelong in the state of Victoria in 2006 7 (Department of Sustainability and Environment, 2010) and in Western Australia in 2010 (Anda et al., 2012).
Some of these programs used a standard Community Based Marketing Approach (CBSM) (see McKenzie Mohr, 2012), while others have used a more facilitative approach based on ‘helping people to help themselves’ which is the basis of the program described in this section.
In Australia increasing levels of drought and uncertainty about supply have led many water authorities to consider this type of approach as an alternative to simply increasing the supply of water (e.g. desalination plants) (Neal et al., 2012).
5.1 Western Australia Water Corporation
5.1.1 The H2ome Smart Program in the Great Southern Region of Western Australia
The aim of the H2ome Smart programs was to encourage households in the area to reduce water use with ‘an arbitrary target reduction in consumption for participating households of 15% each year, for a minimum of five years, compared to non participating households. The program ran from early 2011 until early 2012.
The Water Corporation in Western Australia has been a leader in using voluntary behaviour change approaches to reduce household water use (Water Corporation (2012). In the first program reported here, the target area was all residential households in the Lower Great Southern. The Water Corporation had identified an inadequate long term security of supply in this region due to population growth and expected reductions in yield of existing water sources due to regulatory and climatic factors.
The area is about 400 km south of Perth and there are 5 main towns ranging in size from 33,000 (Albany) to 1,200 (Cranbrook) people. The towns are spread widely about 60 70 kilometres apart and are the hub of a 40,000 square kilometre region. Albany is an established holiday and tourism destination, with accommodation, recreation, food and hospitality growing in and around the city. Water consumption in the region is moderate to low by Australian standards with an average use in 2008/09 of 206 kilolitres per residential property (approximately 82 kilolitres per person). Furthermore, attitudes were generally very receptive to the idea of a behaviour change program even before the intervention commenced (Water Corporation, 2010). On one hand this situation meant that people were open to change, while on the other it posed a challenge to achieve the levels of change required.
A facilitative conversation
Using the principles of voluntary behaviour change (Section 2.3) the underlying approach was through a series of conversations. In the Great Southern project there were five conversations by phone over 9 months. The program duration was based on a trade off decision between
Demand Management Plan – Current Practice & Literature Review Concepts of Change Page | 17
program effectiveness (including lessons learnt in previous projects e.g. Kent and Ampt, 2012) and available funding. A variety of program durations and techniques are possible, with other programs having lasted between 2 6 months with some including face to face visits. The initial conversation is the most critical in this case it averaged 16 minutes.
The first conversation began with a short survey getting people to think about how they use water around the house and in the garden (including questions on appliances and behaviour). This led easily into getting people to think of something they (or someone else in their household) had thought about changing. In cases where the participant could not think of a reason for change, the principle of social norms was used with phrases such as ‘some people (of your age/town) have mentioned … ’ Once a need for change was established (which was possible in almost all households, despite the relatively high rainfall in the Great Southern 929 mm/annum) people were asked ‘if they had thought of a way of dealing with this themselves’. In many cases they had, but had not started the change, or had questions. In other cases they had tried something that did not work. Next was the core of the conversation where people were facilitated (and assisted if needed) to find a way of addressing the issue.
In many cases ‘tools’ were useful. Tools included leaflets (existing and specially prepared see 4.1.2) on common issues such a checking for low flow showerheads, mulching, waterwise plants. They also included information on rebates for rainwater tanks and options to have free retrofits for showerheads, toilets (together with leak fixes at the time of installation). In other cases, the conversation led to the person articulating an action that they could do themselves and, in this case, people were offered a reminder letter.
At the end of the conversation the actions discussed were reiterated and the person asked to make a social contract in other words to reiterate the next steps that they were going to take. This meant that the changes were likely to be sustainable in the sense of being long lasting. Often people mentioned reinforcement from other benefits of the change (e.g. people were able to grow vegetables with less water). Since the behaviour change was a positive experience for the individual (addressing an issue they had already thought about or a behaviour that was inconsistent with their beliefs), the benefits were often passed on to others and the positive message of the change was diffused throughout the community.
The key tenet of this approach to behaviour change is giving people personal responsibility for changing behaviour.
Supportive program and ongoing coaching
While the key component of the approach was a conversation, it was set in the context of multiple mechanisms that encouraged and facilitated change (Figure 3).
Demand Management Plan – Current Practice & Literature Review Concepts of Change Page | 18
Figure 6: Summary of program and ongoing coaching March July August September October November January February Initial letter Meter read Meter read Meter read Meter read Meter read Conversation Feedback Feedback Feedback Feedback Feedback Coaching call Coaching call Coaching call Coaching call 2011 2012
Initial letter
The initial letter had several purposes: to legitimise the program, let people know who they could contact if there were questions, and to already provide them with graphic information about their household’s water use compared to that of other households in their town /area.
Initial call
The initial call contained the survey and initial conversation described in Section 4.1.1. Conversationalists were trained for 40 hours on the facilitative methods used in the community development approach. They could refer to each household’s letter (i.e. with usage details) during the conversation although the focus remained on getting people to take the first steps of change.
Retrofit program
One of the tools offered in all calls was free retrofits to participants who owned old showerheads or single flush toilets. The initial survey made it possible to determine if a household was eligible (i.e. had old fittings).
Meter reads
After each of the five conversations, meters of all participating households and of a control group (Section 4) were read, making it possible to give direct feedback (including data), in the letters and to report change over time.
Ongoing feedback letters and final letter
All target households received the initial letter. Subsequently, all participants received letters with feedback including meter reads and stories on participants’ achievements throughout the program, and a summary of their achievements at the end of the program. The final letter reported the number of actions that people had taken (e.g. 450 households added aerators, 256 fixed leaking taps, etc.) and the collective amount of water likely to have been saved.
Ongoing coaching calls
There were five coaching calls with all participating households. Each of these used the ‘helping people to help themselves’ principles with the addition of a ‘social contract’. Coaches discussed changes people reported having made and recorded new targets people set themselves. This approach meant that people could build on changes, which was most usually the case, but also occasionally reject a solution that was not working and choose another option (e.g. if mulch did not work for them, wetting agents might achieve the same goal). Achievements and commitments were recorded in a computer management system and were discussed in future conversations with participants.
In each call a particular focus was addressed depending on the season of the year. For example, in the winter call (July) coaches listened for opportunities to discuss turning off automated watering or irrigation systems, since rainfall usually provides sufficient moisture for gardens.
Demand Management Plan – Current Practice & Literature Review Concepts of Change Page | 19
Community program
Parallel to the ongoing conversations were community programs that included events, presentations and stories. This was offered by a local environmental group which was part of the implementation team and supported by the local Water Corporation office. The program had two key threads to link in with existing community activities and to let the community know of program progression. The community activities ranged from workshops (a garden verge ‘makeover’ with local drought tolerant plants), to stands at local shows (giving information about using water more efficiently), to a competition organised by a local business (to find the employee who saved the most water at home), to talks in local technical colleges and schools.
Other tools of change
In addition to the tools mentioned above, the following tools were available. They were only sent or delivered to the household if they had been discussed this meant that there was never a bunch of literature that simply gave general tips, not suited to the situation.
Table 1 ‘Tools’ available and requested in the H2ome Smart Great Southern Project
General
Home Water Audit 1361
Seek a Leak brochure from WC 864 Tips for Renters 160
Introduction to Home Smart 0
Free Retrofit by Plumber 2770
A few water saving ideas 804 List of Tools 5297
Brochure on retrofit referrals 1190
Inside
How to install a flow regulator 564 Do you need a water efficient showerhead 1934
How to check for leaking taps 613 Shower timer 1845
Waterwise toilet 587 Plugs 446
Outside
Choosing and installing a rainwater tank 1650
How to reuse grey water 1585
Garden Plants for the Great Southern 672
Efficient garden watering 962
Gardening Tips for Great Southern 1104 SGA gardening self audit 531
Rainwater tank rebate information and form 1418
TOTAL 26357
Note that some tools were general and included retrofits, rebates tips for renters and general information, while others were specific to inside and outside the house assisting people to work out what they needed.
Demand Management Plan – Current Practice & Literature Review Concepts of Change Page | 20
The tools were developed and tested 1 (for understanding and usability) by the consulting team together with Water Corporation. Several examples are shown in Appendix 1 and can be found in Byrne, Josh (2020) https://yourgarden.tips/garden guide.pdf
Results
The results of the Great Southern H2omeSmart program were based on meter reads from participants and a control group. The control group had been chosen using a matched pair approach from households in the following categories: those who had refused to take part, those who had a phone but could not be contacted, and those who did not have a phone. The selection of control households is an ongoing problem given that the control group is likely to be ‘contaminated’ at some point, given that the program is designed to encourage diffusion of the water saving message. In other words, it is likely that the results of the control show slightly more reduction of water use than if an independent control were selected. For this reason, a second control of the whole town of Augusta (approximately 200 km away, but of similar characteristics to Albany) was also briefly examined.
The evaluation approach used was a modified Before After Control Impact/Intervention (BACI) including ‘During’ program data (BDACI). The match was between the Control and Intervention (Participant) groups in the ‘Before’ period, controlled for different seasonal patterns between users.
In the 9 month period during the H2ome Smart service (in 2011/12), a total of 12,053 participants (in 4,690 households) saved 74 litres per person per day (a relative reduction of 26% measured across 2,659 households with a complete series of meter readings). During the same period, the control group (191 households matched to the participant group) reduced consumption by 14 litres per person per day (5%). When the changes in the control group were taken into account, H2ome Smart Great Southern participants achieved a reduction in water consumption of 60 litres per person per day (a 21% reduction on 2010 levels of water use). The estimated net savings, of 60 litres per person per day (21%), are likely to be understated because:
• The control group was within the project area and their reduction of 14 litres per person per day (5%) was likely to be caused by awareness of the project in the media, social diffusion and some control households accessing the waterwise retrofit service that was offered by Water Corporation across the whole community; and
• The measurement for this report was taken during the program using readings (June 2011 to February 2012), when households were in the process of implementing water saving actions.
The annualised saving was projected from the ‘during project’ savings, assuming that there was neither improvement (e.g. more water saving actions are implemented) nor a decline (e.g. as water saving behaviours rebound) in the rate of water savings. On this basis the projected saving was 264 million litres per annum. This projection is likely to be conservative when
1
Demand Management Plan – Current Practice & Literature Review Concepts of Change Page | 21
Testing was done using the Diagnostic Testing Tool developed in Melbourne by the Communications Research Institute (Shrenskyand Sless (2005)
considered alongside all of the actions pledged during the H2ome Smart Great Southern eco coaching process, which predict a modelled water saving of 345 million litres per annum. The modelled saving is based on a calculation which uses the projected outcome for each water saving action (as published in Water Corporation H2ome Smart leaflets) and applies it to the number of households that have pledged or reported uptake of the action in the project period.
The program was only applied to 30% of the customers (because it targeted households with phone numbers) and would likely have had a further positive impact if it could have been offered to all households.
The comprehensive data analysis has also discovered some interesting patterns in the data that could be applied to the design of residential water reduction projects:
• Low water users were more skilled at water conservation, but high water users had more potential to save water. The analysis matched the spread of water use in the control group to reflect the spread of use in the participant group. Analysing by ‘High’, ‘Medium’ and ‘Low’ use households (on a per person basis) revealed that Low users in the control group increased their consumption over time, Medium users remained the same and High users reduced their use. This effect is due to cases where the circumstances of households change, and they cannot maintain the same Low or High water use status. Measurements in the participant group were then controlled for this effect. This procedure revealed that the program achieved a 32% reduction in water use by Low consumers, 18% reduction by Medium and 19% by high users when compared to the control group. The Low consumers seemingly had better skills to respond to the H2ome Smart Great Southern program. When expressed in absolute water saving (litres) the High user group still achieved the greatest saving at 93 litres per person per day compared to savings of 43 in each of the Medium and Low groups.
• Most water savings were being achieved indoors. The seasonal pattern in water saving (net of the seasonal pattern in the control group) revealed strongest savings in the Winter and Spring seasons (when water use is low and mostly indoor use), at around 80 litres per person per day, and modest savings, 13 litres per person per day, in the summer period (when water use is high and mostly outdoor use). While the impact of guests and holidays may not be fully controlled for, these results suggest that there is some rebound amongst participants in ‘banking’ Winter savings and ‘relaxing’ in Summer. It should be noted that participants still saved water compared to the control group over Summer. Other results of relevance to other geographies to highlight the nature of the program:
• There was a total of 1,235 hours spent in conversation (average 16 minutes) during the initial call
• There was a total of 1,356 hours of coaching in subsequent calls (average 7 minutes)
• This means that there were a total of 2,591 conversation hours
• A total of 11,425 water saving actions were agreed to and 7,828 of these were actually achieved during the course of the program
• About 75% of people who were eligible for showerheads arranged for a retrofit (2,450) and
Demand Management Plan – Current Practice & Literature Review Concepts of Change Page | 22
• About 89% of people who were eligible for a dual flush toilet arranged for a retrofit (758).
5.1.2 Adapting the program to other regions 7 WA Wheatbelt towns
Using the experience gained in the Great Southern, in 2011 12 the Water Corporation adapted the approach to an area called the Upper Great Southern or the Wheat Belt. The aim was to defer the cost of supply side infrastructure (particularly expansion of the Harris Dam near Collie) by effective demand management and behaviour change programs. While the program was aimed primarily at households, it also offered 100 businesses and organisations the opportunity for a review of their water use and subsequent retrofit of high water using appliances so that they could be held out as examples for residents and build momentum for change in the community.
The aims were to increase community capacity for change, reduce the summer water use peak and delay the cost of infrastructure development. To achieve these aims the targets were:
• to successfully engage 2000 households in personalised water coaching
• to provide feedback only contact to a further 1000 households
• to achieve a minimum 10% reduction in water use amongst engaged (participating) households,
• to achieve a 4% reduction in feedback only households measured in the first full year after completion of the program
• to have each household adopt at least two new water efficient behaviours
• to recruit households in a timely way to allow retrofits to be completed in 400 households
• to recruit 100 businesses for reviews and retrofits. The key components of the methodology were:
• A method that focused on the involvement of local people with a champion who also recruited the businesses in each town. This was aimed to form a network of businesses where all the employees (i.e. residential users) knew about the project so that these people would be able to spread the word to the community
• The method used local organisations to ask their members to participate (e.g. the Ngalang Boodja Council in Collie, the Small Business Centre in Narrogin and the Community Resource Centres (CRCs) in the remaining towns.
• Maintaining a database of the households participating in the program, their meter reads, actions and requests for information.
• There was a team of rigorously trained coaches/conversationalists with a strong knowledge of the area based on feedback from other team members, weekly local newspapers available in the call room, and a Project Manager who had spent time in the area.
• The method of conversation in the first call was that of ‘helping people to help themselves’ with some elements from behavioural economics and social marketing. In
Demand Management Plan – Current Practice & Literature Review Concepts of Change Page | 23
subsequent calls, while the focus was still on helping people to help themselves, there was a much stronger role for true coaching which included suggesting specific directions for change.
• In 1000 additional households a ‘feedback only’ approach was tested. This meant no conversations (lower costs) but repeated feedback over time.
Results
The results are reported below.
Types of changes
Table 2 shows the actions taken by participants during the conversations. The first column is existing changes which people reported. The second column is the changes that wanted to or agreed to make. Agreed changes are complicated to monitor because because this status changes between calls (e.g. a household agrees to an action in the first call but then in the second call this becomes an achieved action). They are reported here as a cumulative figure. Achieved actions are those which a participating household reported as having enacted since the beginning of the Waterwise Towns program.
Demand Management Plan – Current Practice & Literature Review Concepts of Change Page | 24
Table 2: Actions taken as a result of the conversation
Agreed Actions
Existing Agreed NA Refused WW achieved
Reduce shower time by another 2 minutes Yourself 377 28 943 16 159
Reduce shower time by another 2 minutes Others 292 45 736 9 167
Short showers Yourself (of 4 mins or less) 1388 63 21 17 232 Short showers Others (of 4 mins or less) 965 78 87 20 202 Have waterwise showerheads Eligible for retrofit if not existing 1024 73 56 60 236 Stop running taps for cleaning teeth Yourself 1702 11 4 7 90
Stop running taps for cleaning teeth Others 1145 14 77 9 73 Fit a water efficient toilet. Eligible for retrofit if not existing 1775 13 6 6 80 Use half flush on existing water efficient toilet 347 11 28 3 74 Fix leaking toilet Part of retrofit 2 9 1649 0 28 Bucket water (cold run from shower) 61 144 157 111 274 Wait for full washing loads 1510 4 17 9 50 Reduce irrigation by another 2 minutes per station Retrofit plumber can help 1 52 988 22 138
Set irrigation times to short runs (10 mins/ station) Retrofit lumber can help if automatic 141 25 978 23 130
Turn irrigation off in winter 616 1 974 4 7
Started to use a tap timer 29 22 217 11 72 Replace another 5sqm of lawn /exotics with waterwise plants 59 63 135 17 210
Install a rainwater tank 390 106 151 17 54 Plumb in rainwater tank to toilet or washing machine 39 11 184 8 25 Mulch and/or soil wetter on garden (to avoid watering top ups) 366 109 155 50 384 Use a pool blanket 143 12 1784 4 11 Use plug/ bowl to wash veg 154 89 84 14 173
Install tap flow regulators can be part of retrofit 34 5 72 1 35 Have fixed/always fix leaking taps can be part of retrofit 2 23 1501 0 126
Use a bucket, not a hose to wash the car 67 4 54 9 12 Reuse grey water (includes informal from laundry) 649 168 126 87 233 Switch evaporative aircon to fan only for 2 hrs a day 12 5 91 3 11 Do the DIY Home Water Audit 5 222 160 35 249
Other actions (Showers/Bathroom) 15 85 35 12 146 Other actions (Laundry) 5 68 28 8 79 Other actions (Garden) 37 269 109 29 551 Other actions (Kitchen) 6 22 22 5 74 Other actions (General) 20 154 57 19 270
Total agreed and achieved 2008 4655
Demand Management Plan – Current Practice & Literature Review Concepts of Change Page | 25
Amount of change
Initially BACI (Before after control impact) results focused on the control group pre consumption for comparisons with the coaching group. The BACI results for coached (i.e. households with conversations and FBO (feedback only) participants are given in Table 3 and Table 4, estimating a 66.3L per day (7.8%) water savings for coached participants and a 46.2L per day (6.1%) for FBO households over the 6 month period compared.
Table 3: Coached participants compared to control group Group
Matched Control
Mean (litres per day)
Pre 6mths 824.6
During 6mths 825.8 Difference 1 2
Pre 6mths 848.3 Coached Participants During 6mths 783 1 Difference 65 1 BACI in L/day 66.3 7.8%
Table 4: Feedback Only (FBO) compared to the control group
Group
Mean (litres per day)
Pre 6mths 763.1 Control During 6mths 783.3 Difference 20.1
Pre 6mths 762.4 FBO households During 6mths 736 4 Difference 26.1
BACI in L/day 46.2 6.1%
These results were then applied to the participant numbers in each town and projected to the full 8 months of the program assuming the average reduction over the 6 months was similar for the 2 early months of program following the announcement letter and phone call.
Using this matched control BACI analysis method, the 8-month project savings from both feedback only and coached participants was an estimated 38,405kL saved from the program’s 2000 coached and 1153 feedback only participants.
The estimated net savings of the coached and FBO participants may be understated because the control group is within the project area and their usage may have been affected by awareness of the project and social diffusion of water saving messages
5.1.3 Geraldton
The final example of adaptation was when the Water Corporation experimented with a low cost modification of the above programs. This program ran from February June 2012
Demand Management Plan – Current Practice & Literature Review Concepts of Change Page | 26
The project aimed to trial several elements of Water Corporation’s behaviour change approach, including:
• reduced number of individual interactions through the use of community engagement as replacement of one phone call; and • reduced project timeframe and budget. Analysis of results shows a water use reduction of 11 litres/person/day, which equates to a reduction of 4% for those target households over the post intervention period from April to July 2012. This is relative to the estimated pre intervention water use in the postintervention period, based on the observed control group behaviour over the same period. The results showed significantly more water reductions (53 litres/person/day) in households that had two calls compared to those that only had one (11 litres/person/day) (see Table 5).
Overall program
Small, short programs can be effective if:
there are conversations at least every 4 6 weeks
there are multiple participatory activities
there is scope to have an isolated control group
the schedule allows for sufficient gap between interventions and meter readings to enable actions to be reflected in water use
Small, short programs are more difficult than longer ones which traverse a summer. Notwithstanding this challenge:
the basic elements of the program (data collation, letter production, coaching calls and meter reads) were undertaken with no significant issues
there was some momentum loss due to the long time between coaching conversations (known to be very effective in other projects)
The results showed significantly more water savings (53 litres/person/day) in households that had two calls compared to those that only had one (11 litres/person/day)
Demand Management Plan – Current Practice & Literature Review Concepts of Change Page | 27
Table 5: Lessons learnt from a reduced number of contacts
Lesson learnt/ Response to challenge Challenge/ comments
Community engagement
Some ‘emergent’ solutions worked well, including Strathalbyn Christian College activities, and inclusion of the approach in training of conversationalists.
Many community organisations supported the program, for example, Pollinators, Drylands Permaculture Nursery and the Drummond Cove Progress Association. These organisations helped to spread the message to members, and some held events.
Bunnings also emerged as a key supporter of the project.
‘Emergent’ programs can be successful when: it is recognised that engagement with community organisations differs in intent from engagement with community members. synergies are encouraged through good coordination protocols about sharing information with such organisations are clear from the start of the project and built into the Engagement Plan.
time is invested in supporting interested organisations or individuals who are coming up with their own ideas.
Engagement with the community and with participants works well when: the Engagement Plan distinguishes between general communications and direct communication to participants or interested organisations. The advantage of direct emailing over general media releases was that messages could be targeted to participants rather than at the broader community
purpose of H2ome Smart displays is planned in line with agreed community engagement plan
The community engagement element aspect of the program aspired to trial the use of ‘emergent’ community drivers to assist with behaviour change. In its ideal form this would mean community organisations would come up with their own ideas for saving water and would organise events or activities focussed on this. This approach had some success, for example, the Strathalbyn Christian College was very supportive, with some internally driven activities emerging.
participants are willing to provide email contact addresses to the program in order to hear about upcoming events. Emails were available for 905 of the 1,375 participants (approximately 66%).
Project displays, including branding elements, banners etc were developed by Water Corporation for the H2ome Smart project. These were used at various events and displays, some of which were well attended, where others were not. Brand recognition within Geraldton seemed quite low, perhaps because the program had a small target group, rather than being aimed at general population. As a result of raising these challenges as a critical issue with Water Corporation (due to the small numbers of people attending or aware of the brand), participant emails were used from late April to communicate to most of the participants.
Demand Management Plan – Current Practice & Literature Review Concepts of Change Page | 28
Lesson learnt/ Response to challenge ctd….
5.1.4 Ongoing programs
Since 2012 13 most of the behaviour change programs in the Water Corporation have been run internally with advice and evaluation from an external consultant. Examples of these are:
• Waterwise Schools a multi sensory experience for students to take action to protect our water while educating them in conservation and sustainability to secure our water future in WA. This has 3 tiers: water supply and conservation, water in Aboriginal culture and waterwise experience. The tiers are designed to support the West Australian curriculum, giving them the option to combine workshops, tours and tools for their learning purposes.
• Retrofitting (e.g. low income housing) this is a top down program but has been very effective though is most likely more appropriate for large cities than regional areas.
• Training community officers to have conversations with low income households to assist in behaviour change It is planned to train 200 officers from the department of communities housing services in waterwise training to help them assist tenants in making changes to their daily water use practices at home. The training will be delivered by the Water Corporation. This is part of a WaterWise action plan for Perth. www.wa.gov.au/sites/default/files/2020 06/Waterwise perth action plan.pdf
6. Sydney Water
Sydney Water has focused on education to encourage behaviour change but has developed an excellent set of tools that may be appropriate for the Rous Water region.
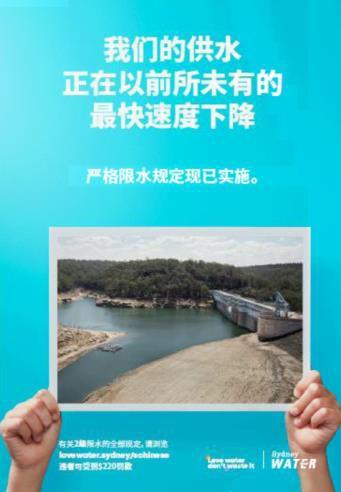
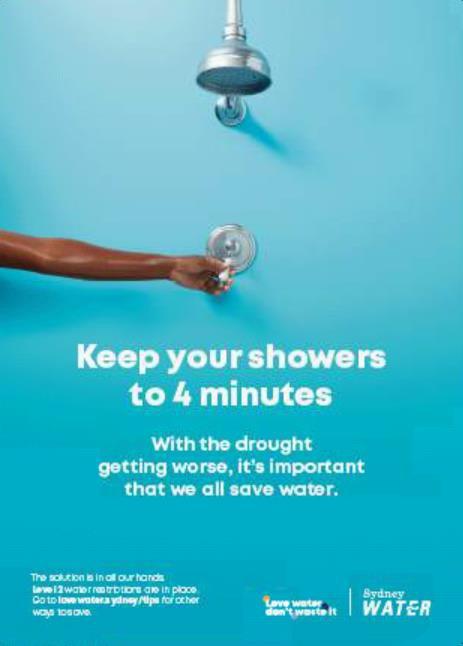
6.1 Community awareness campaign
This was related to water restrictions in 2019 20 and used images relevant to different communities they had researched (Figure 7)
Demand Management Plan – Current Practice & Literature Review Concepts of Change Page | 29
Figure 7 Examples of Sydney Water community awareness campaign
They reported (Sydney Water 2020) Combined with restrictions, our campaign delivered overall water savings of 10.4%, exceeding our7.8% target. Our highest water savings, since tracking commenced in August 2018, occurred in January 2020, where savings peaked at 16.6%.
6.2 WaterWise Coach
This approach was closest to the voluntary behaviour change approach described earlier. They launched a Water Wise Coach chatbot tool, to help individuals better understand their water usage at home.
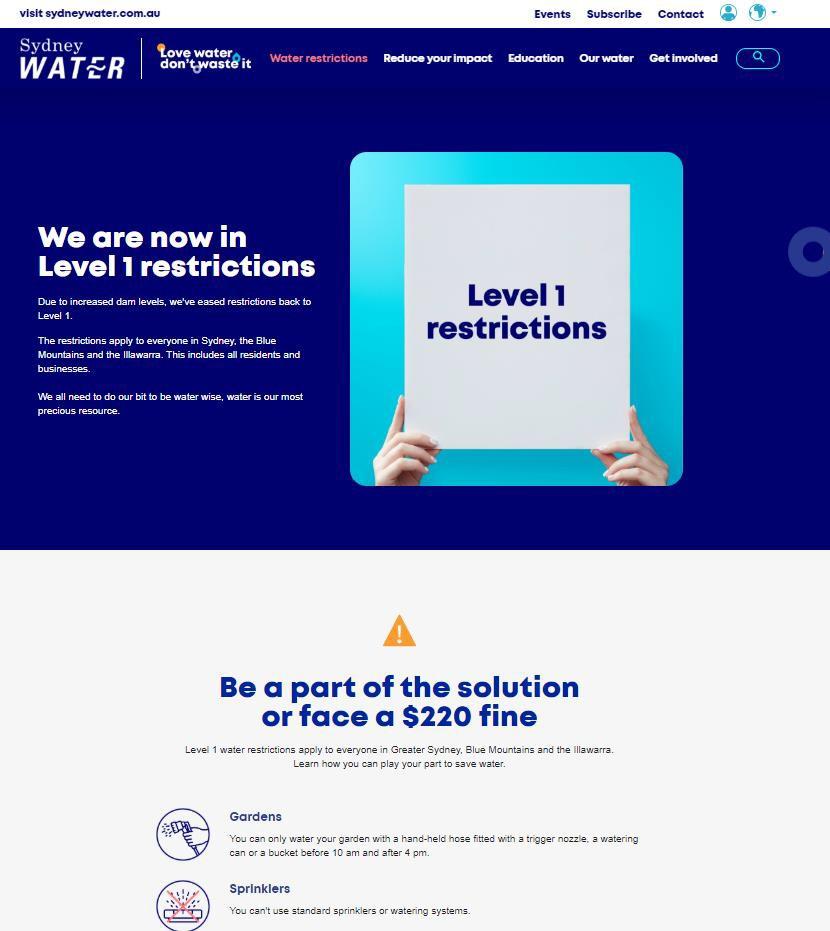
6.3 Small Change Shop
They also began a pledge campaign The Small Change Shop offered unique flavoured cones of popcorn in exchange for individual watersaving pledges. We asked visitors to the activation to commit to making a behaviour change, like having four minute showers or committing to doing full loads of washing in exchange for their popcorn. From Westfield shopping centres, to grass roots community events, The Small Change Shop visited37 events over 98 days, reaching over 4,500,000 people. There were 52,441 pledges made, whichequated to 1,949,322 litres per day saved.
Demand Management Plan – Current Practice & Literature Review Concepts of Change Page | 30
Figure 8 Example of a Waterwise online coach
6.4 Drought Proof Garden
In October 2019 they had a Drought Proof Garden activation in Martin Place over three days and was amplified through earned and paid social media. It reached over 5 million customers through a multi channel approach, with an onsite activation exposure of 135,000 people and direct engagement of 15,000 people over three days. The garden promoted water restrictions and water saving tips in the garden while providing advice on how the use of plants are key to gardens surviving a drought.
6.5 Formal education and community tours
They have also commissioned and are currently in production for early primary school digital resources,videos on how to conduct a home water audit, water cycle experiments, and resource packs withgames and books with a focus on building value for water and saving water.
7. Victorian water authorities
At the moment, Victorian water authorities all have a target of 155 litres of water per person per day. They are focusing on behaviour change tips and campaigns as below.
7.1 Melbourne authorities
• Yarra Valley Water online tips using buckets as the measure
With some simple and easy behaviour changes we can all reach Target 155 it’s the equivalent of everyone using one less bucket of water every day. https://www.yvw.com.au/help advice/saving water
• SE Water top water saving tips. https://southeastwater.com.au/residential/learn about water/saving water/
• City West as for the others, but also focusing on indigenous values Their strategy states that they are:
o building on existing partnerships to enhance social connectedness, in particular with culturally and linguistically diverse and vulnerable customers and
o enhancing water literacy program and give recognition to Indigenous values for water.
o https://www.citywestwater.com.au/sites/default/files/attachments/urban_water_strat egy.pdf
7.2 Barwon Water
Barwon Water (who carried out a voluntary behaviour change program in 2008 9). Since then, behaviour change is part of their strategy 2 Of relevance is that they did a large scale community engagement program leading to an education program or campaign There 2 https://www.waterfuture.barwonwater.vic.gov.au/changingbehaviours
Demand Management Plan – Current Practice & Literature Review Concepts of Change Page | 31
evaluation of the effects of the program is highly relevant as it suggests the difficulties of concentrating on an education campaign.
Sustainable Water Use Education Program
Quantity - Savings from education campaigns are difficult to quantify
Cost variable depending on the scale of the program. Can be highly localised (lower cost) or region wide (higher cost)
Environment Delivery of education campaigns has a low environmental impact
Reliability - Medium reliability Numerous factors can influence the success of campaigns, including weather and demographics
Figure 9: Barwon Water’s summary of an education program Source: www.waterfuture.barwonwater.vic.gov.au/changingbehaviours
8. Queensland water authorities
The South East Queensland Water Service Providers (Seqwater, the bulk water supplier; and the SEQ Service Providers Unitywater, Urban Utilities and the council owned water businesses of Logan, Redland and City of Gold Coast) (SEQ 2020) have done an extensive program of community listening.
This means they have opportunities to work together with the community, government and industry partners in programs such as an H20 Kids educational program (pre to Year 12). This will mean they can apply insights gained from listening to and understanding how SEQ communities value water and what considerations are important for water management now and in the future. Details are not available currently.
9. SA Water
As part of their Stretch Action Plan, SA Water (SA Water 2020)has an interesting program to engage with Aboriginal communities to better understand their connections to water and to learn from the knowledge they hold. They have created a series of video stories Water Wisdom. While these programs were specifically in remote areas, they were taken up with enthusiasm.
Demand Management Plan – Current Practice & Literature Review Concepts of Change Page | 32
10. Summary
This review is intended as a backdrop for the planning process for a Behaviour Change program in the Rous Region. It shows the importance of customising the program by allowing individuals and households to: create a situation where they are facilitated to choose their own reasons for change and form their own plan for change using both existing and potentially new tools.
Research also provides lessons on which behaviours are likely to be more easily targeted in a behaviour change program and the need to continue to liaise with customers as their perceptions are often significantly different than those of water authorities.
Finally it gives examples of state of the art programs throughout Australia with WA Water Corporation leading in behaviour change programs, but other states giving examples of tools that might be incorporated in a Rous Region program.
Demand Management Plan – Current Practice & Literature Review Concepts of Change Page | 33
11. References
Ampt E, Neal B, MacKellar P and Glyn Davies R (2013) Lessons on Behaviour Change Programs to Reduce Water Demand, Water Management 167(8):442 447
Ampt E (2012) Voluntary Behaviour Change: an innovative way of gaining cost efficiencies, Waste Awareness, WasteMINZ, NZ 141, May
Ampt E (2003) Understanding Voluntary Travel Behaviour Change. In Proceedings 26th Australasian Transport Research Forum, Wellington, NZ, pp.48 60
Byrne, Josh, (2020) Your Garden: A Guide for Gardening on the Swan Coastal Plain https://yourgarden.tips/garden guide.pdf
Deming, W. Edwards. (1986) Out of Crisis. Massachusetts Institute of Technology, Cambridge, Massachusetts, U.S.A.
Denlay, J. (2002) Cool Communities cool solutions to global warming The Regional Institute, Australia http://www.regional.org.au/au/soc/2002/4/denlay.htm
Festinger, L, Riecken, H., Schachter, S. (1956). When Prophecy Fails: A Social and Psychological Study of a Modern Group that Predicted the Destruction of the World. University of Minnesota Press. Reissued 2008 by Pinter & Martin.
Fielding, K.S., Spinks, A., Russell, S., McCrea, R., Stewart, R., Gardner, J., 2013. An experimental test of voluntary strategies to promote urban water demand management. J. Environ. Manag. 114, 343 351.
Ife, J. W. (2002). Community development: Community based alternatives in an age of globalisation (2nd ed.). Frenchs Forest: Pearson Education.
Kurz, T., Donaghue, N., Walker, I., 2005. Utilizing a social ecological framework to promote water and energy conservation: a field experiment. J. Appl. Soc. Psychol. 35, 1281 1300. Landon, A.C., Woodward,
Levin, T and Meuhleisen R. (2016) Saving Water through Behavior Changing Technologies, Proceedings 2016 ACEEE Summer Study on Energy Efficiency in Buildings www.aceee.org/files/proceedings/2016/data/papers/8_500.pdf
Mondéjar Jiménez, J.A., Cordente Rodríguez, M., Meseguer Santamaría, M.L., Gázquez Abad, J.C., 2011. Environmental behavior and water saving in Spanish housing. Int. J. Environ. Res. 5, 1 10.
Peter Basso Associates Inc. (2018) Reducing your building’s water consumption https://blog.peterbassoassociates.com/blog/7 ways to reduce your building s water consumption
SA Water (2020) Water Stretch Reconciliation Action Plan www.sawater.com.au/__data/assets/pdf_file/0006/496491/SA Water_Stretch Reconciliation Action Plan 2020.pdf
SEQ Water (2020) Water for South East Queensland Planning for our Future www.seqwater.com.au/sites/default/files/2021 02/J012898%20Water%20for%20SEQ%20Annual%20Report_base.pdf
Shrensky, R and Sless, D. (2005) Choosing the right method for testing. Communications Research Institute of Australia www.communication.org.au/cria_publications/publication_id_94_2114333509/html)
Syme, G.J., Nancarrow, B.E., Seligman, C., 2000. The evaluation of information campaigns to promote voluntary household water conservation. Eval. Rev. 24, 539 578.
Ramkissoon, H., Smith, L., & Kneebone, S. (2015). Accelerating transition to water sensitive cities. Behaviour Assessment Database. Melbourne, Australia: Cooperative Research Centre for Water Sensitive Cities https://watersensitivecities.org.au/wp content/uploads/2016/05/TMR_A2
2_BehaviourAssessmentDatabase.pdf
Demand Management Plan – Current Practice & Literature Review Concepts of Change Page | 34
Williams, D (2004) ‘Life Events and Career Change: Transitions psychology in practice’. www.eoslifework.co.uk/transprac.htm
Wright, P, Dean, A, Kneebone, S & Smith, L. (2016) Behavioural roadmap: prioritising water saving behaviours in households using measurements of impact and likelihood. Melbourne, Australia: Cooperative Research Centre for Water Sensitive Cities https://watersensitivecities.org.au/wp content/uploads/2016/04/TMR_A2 2_BehaviouralRoadmap.pdf
Sydney Water (2020) Conservation Report (https://www.sydneywater.com.au/content/dam/sydneywater/documents/water conservation report.pdf)
Demand Management Plan – Current Practice & Literature Review Concepts of Change Page | 35
12. Appendix – Examples of tools prepared for Great Southern
Note that similar tools (customised for the area) were prepared for the following programs:
• Victorian Department of Sustainability for Yarra Valley Water, SE Water, City West Water and Barwon Water
• Water Corporation H2omeSmart WA Wheatbelt
• Water Corporation H2omeSmart Geraldton
Demand Management Plan – Current Practice & Literature Review Concepts of Change Page | 36
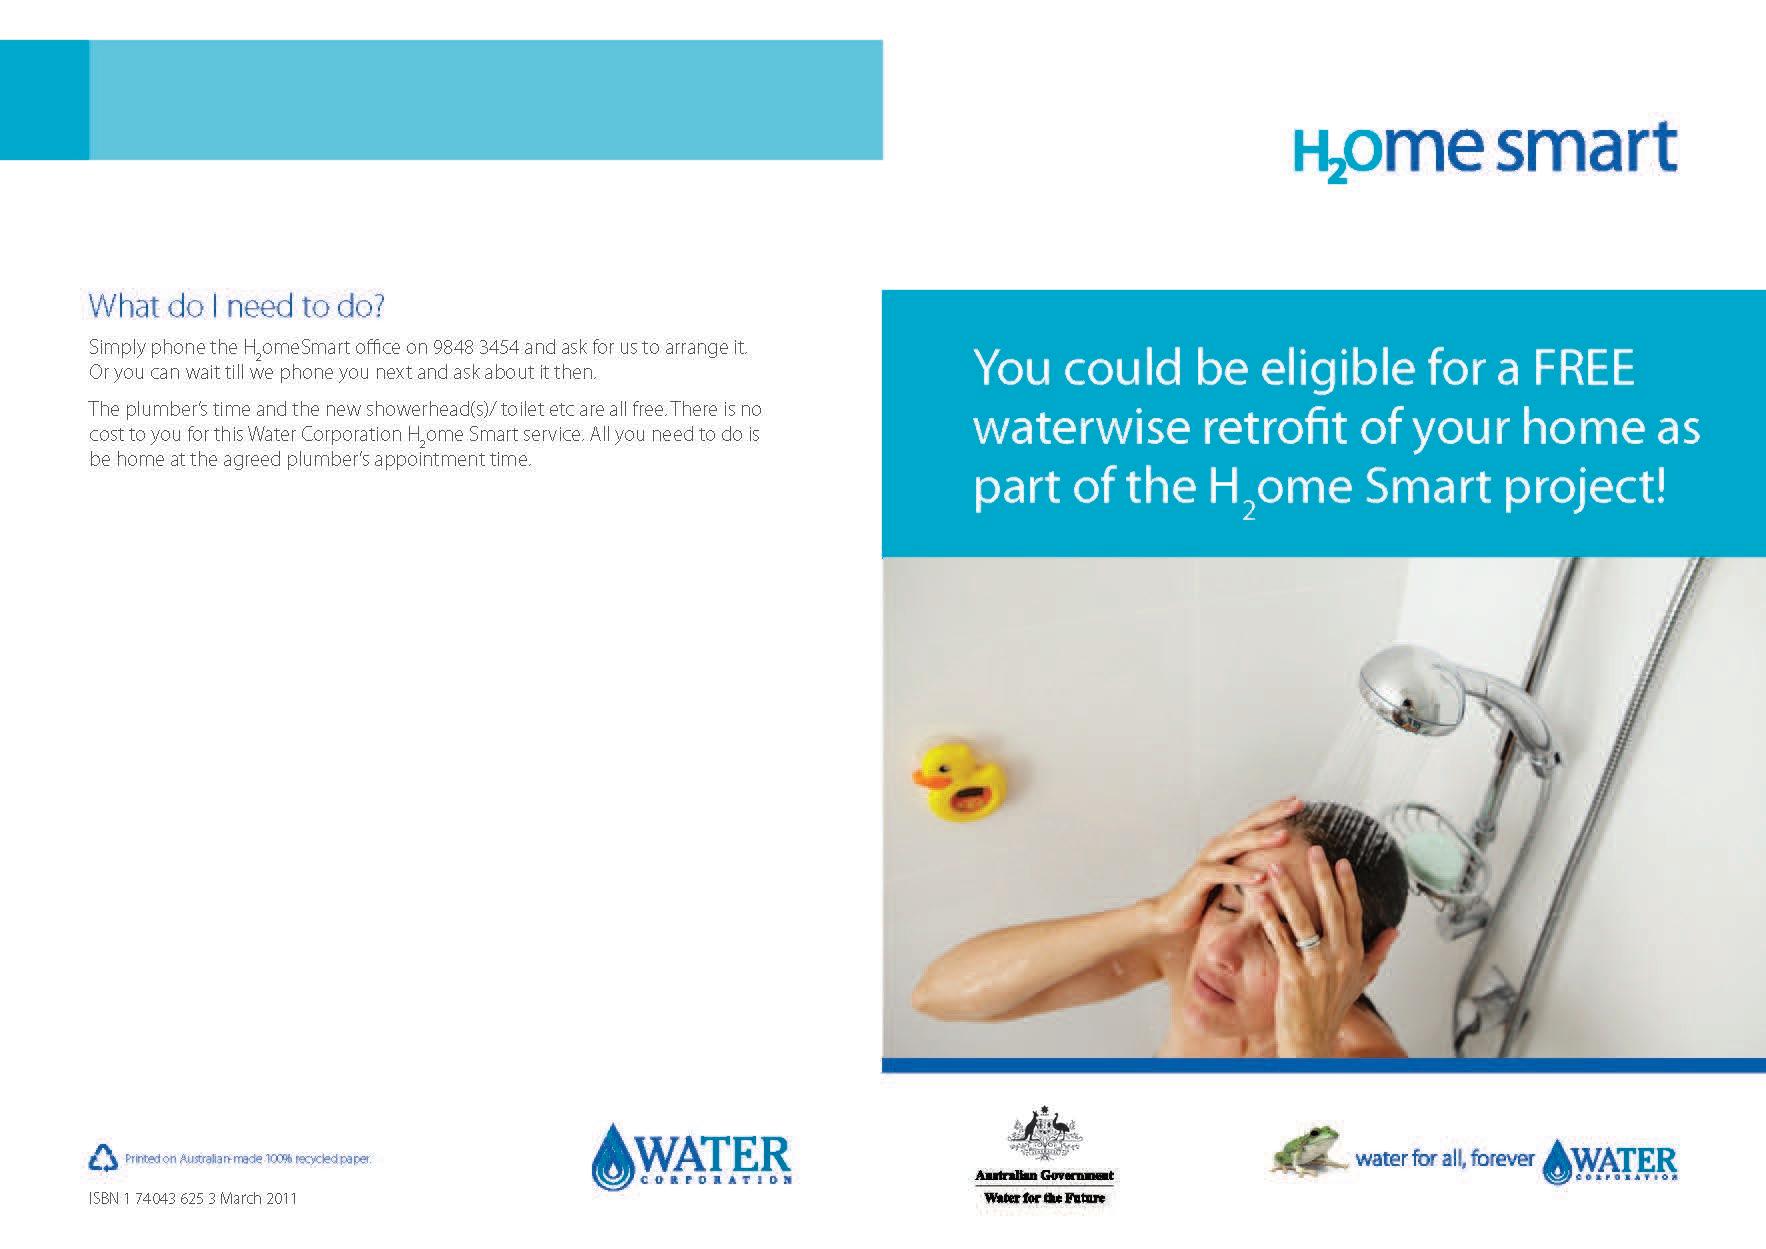
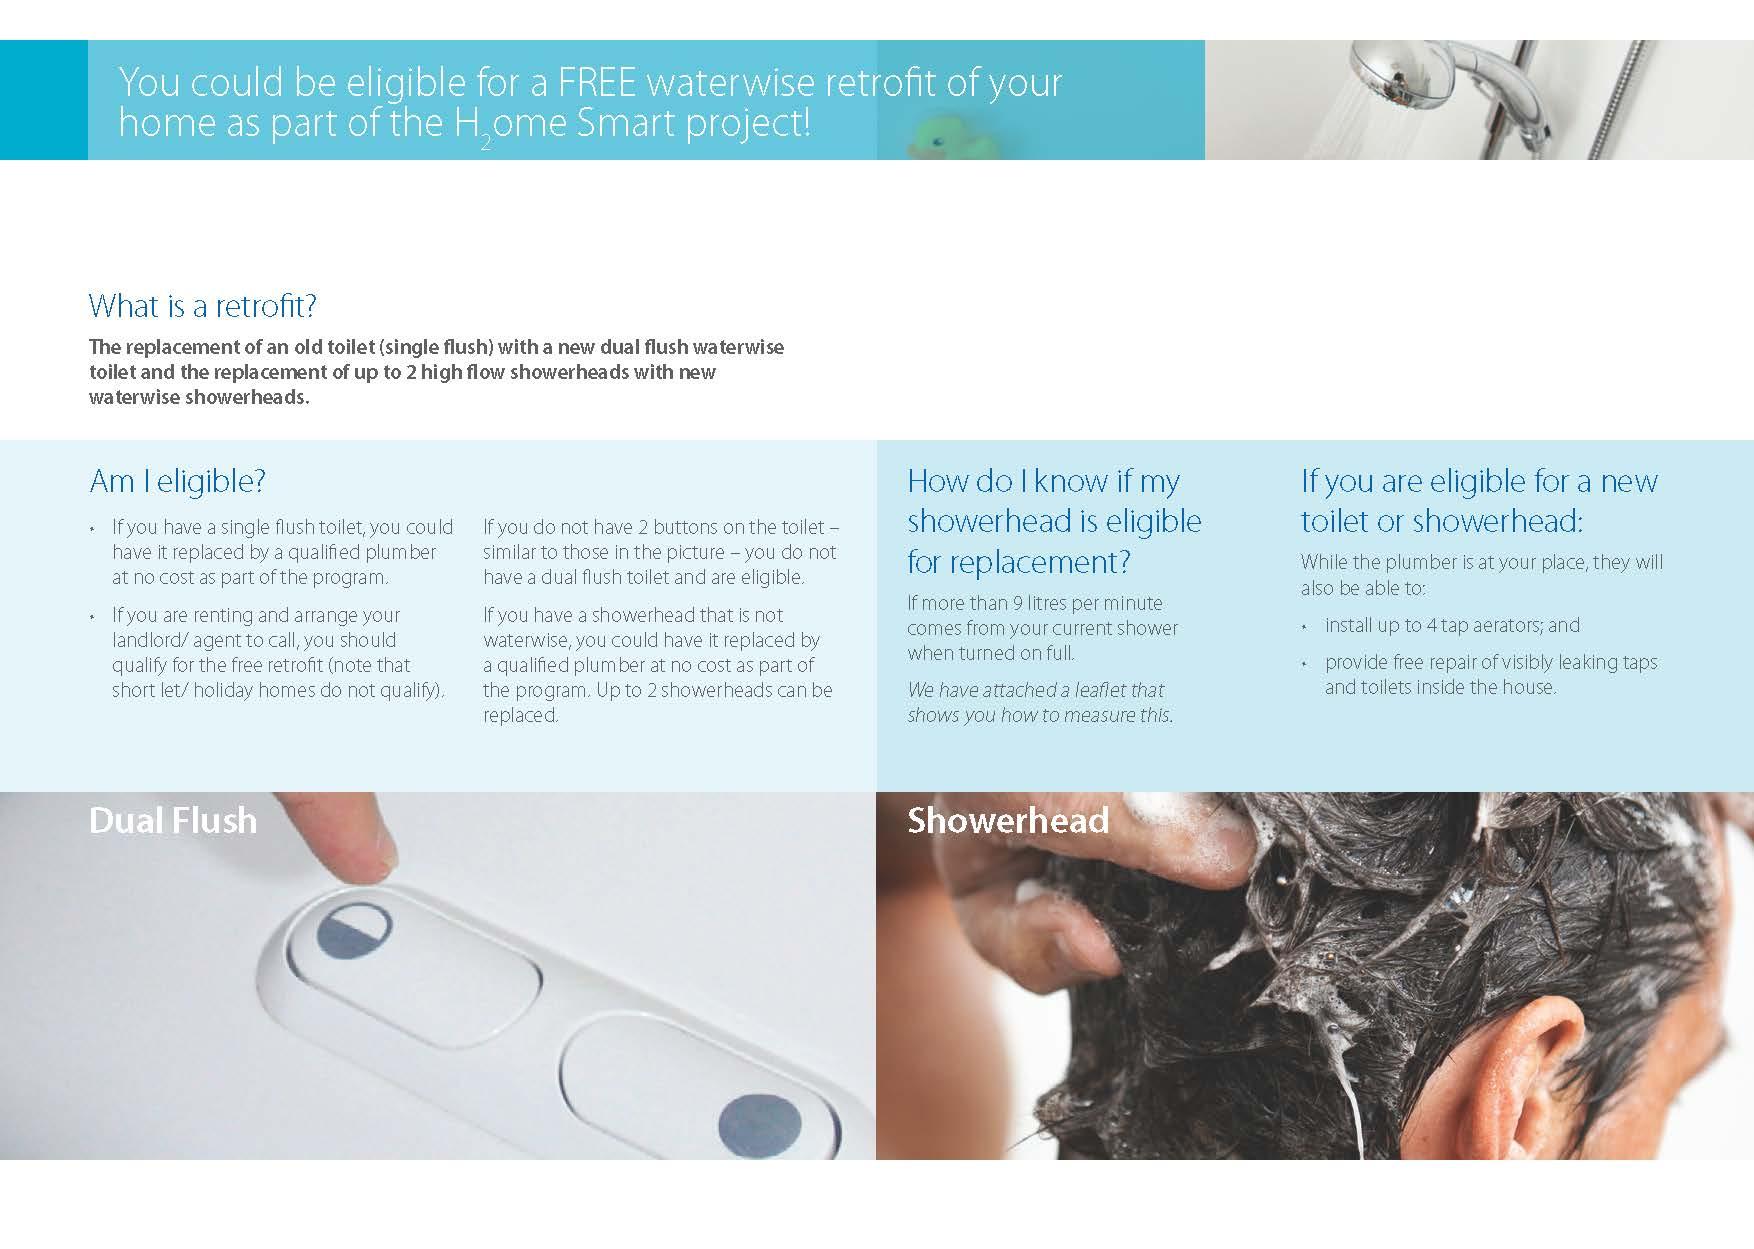
Demand Management Plan – Current Practice & Literature Review Concepts of Change Page | 37
– Current
Concepts of Change Page | 38
Demand Management Plan
Practice & Literature Review
– Current
Literature
Concepts of Change Page | 39
Demand Management Plan
Practice &
Review
APPENDIX 7 BEHAVIOUR CHANGE FOCUS GROUP REPORT AND OUTCOMES
RDMP Background information and recommended plan components Page 99
Rous County Council Regional Demand Management Plan
Focus Group Report and Outcomes
For Hydrosphere/ Rous County Council October 26, 2021
wa
Prepared by Liz Ampt
Demand Management Plan – Focus Group Report
Outcomes Concepts of Change Page | i
and
Demand Management Plan – Focus Group Report and Outcomes Concepts of Change Page | ii Contents 1. Background ................................................................................................................ 1 2. Purpose of the Focus Group discussions ...................................................................... 1 3. Formation of the Four Focus Groups ........................................................................... 2 3.1 Development of the Discussion Guide ...................................................................................2 3.2 Discussion Guide ....................................................................................................................2 3.3 Overall Composition and timing ............................................................................................3 4. Richmond Valley Discussion ........................................................................................ 3 4.1 Richmond Valley Group details ...........................................................................................3 4.2 Use of water around the house .............................................................................................4 4.3 Behaviour change to date ......................................................................................................4 4.4 Perceptions of volumes 5 4.5 Purple Pipe 5 4.6
supplies your water? 5 4.7 Drought 5 4.8 Water saving tips and program 6 4.9 Perception
smart
...................................................................................................6 4.10 Permission to read .................................................................................................................6 4.11 Other comments ....................................................................................................................7 5. Byron Discussion ......................................................................................................... 7 5.1 Byron
details 7 5.2 Use of water
the house .............................................................................................7 5.3 Behaviour change to date ......................................................................................................7 5.4 Perceptions
volumes ..........................................................................................................8 5.5 Purple
8 5.6
9 5.7
9 5.8
10 5.9
water 10 5.10 Other comments 10 6. Lismore Discussion .................................................................................................... 11 6.1 Lismore Group details 11 6.2 Use of water
the house 11 6.3 Behaviour change to date ....................................................................................................12 6.4 Perceptions of volumes ........................................................................................................13 6.5 Purple Pipe ...........................................................................................................................13 6.6 Drought ................................................................................................................................13
Who
of
meters
Group
around
of
Pipe
Drought
Water saving tips and program
Perception of smart meters
Source of
around
Demand Management Plan – Focus Group Report and Outcomes Concepts of Change Page | iii
.....................................................................................................
..................................................................................................................
9. Appendices ............................................................................................................... 23 Appendix 1 – Screening Questions ................................................................................... 24 Appendix 2 Discussion Guide ........................................................................................ 26
6.7 Water saving tips and program ............................................................................................14 6.8 Perception of smart meters .................................................................................................14 6.9 Source of water 15 6.10 Permission to read 15 6.11 General comments 15 7. Ballina Discussion
15 7.1 Ballina Group Details 15 7.2 Use of water around the house 15 7.3 Behaviour change to date 16 7.4 Perceptions of volumes 17 7.5 Purple Pipe 18 7.6 Drought 18 7.7 Water saving tips and program ............................................................................................19 7.8 Perception of smart meters .................................................................................................20 7.9 Source of water 20 7.10 Permission to read 20 8. Summary
20 8.1 Use of water around the house ...........................................................................................20 8.2 Behaviour change to date ....................................................................................................20 8.3 Perceptions of volumes 21 8.4 Purple Pipe 21 8.5 Drought 21 8.6 Water saving tips and program 21 8.7 Perception of smart meters 22 8.8 Source of water ....................................................................................................................22 8.9 Permission to read ...............................................................................................................22
1. Background
Rous County Council wants to develop a Demand Management Plan and would like to include a behaviour change program which produces a measurable reduction in water use in all households in the County with change retained over 5 years
The approach taken to the develop the behaviour change program is shown in Figure 1.
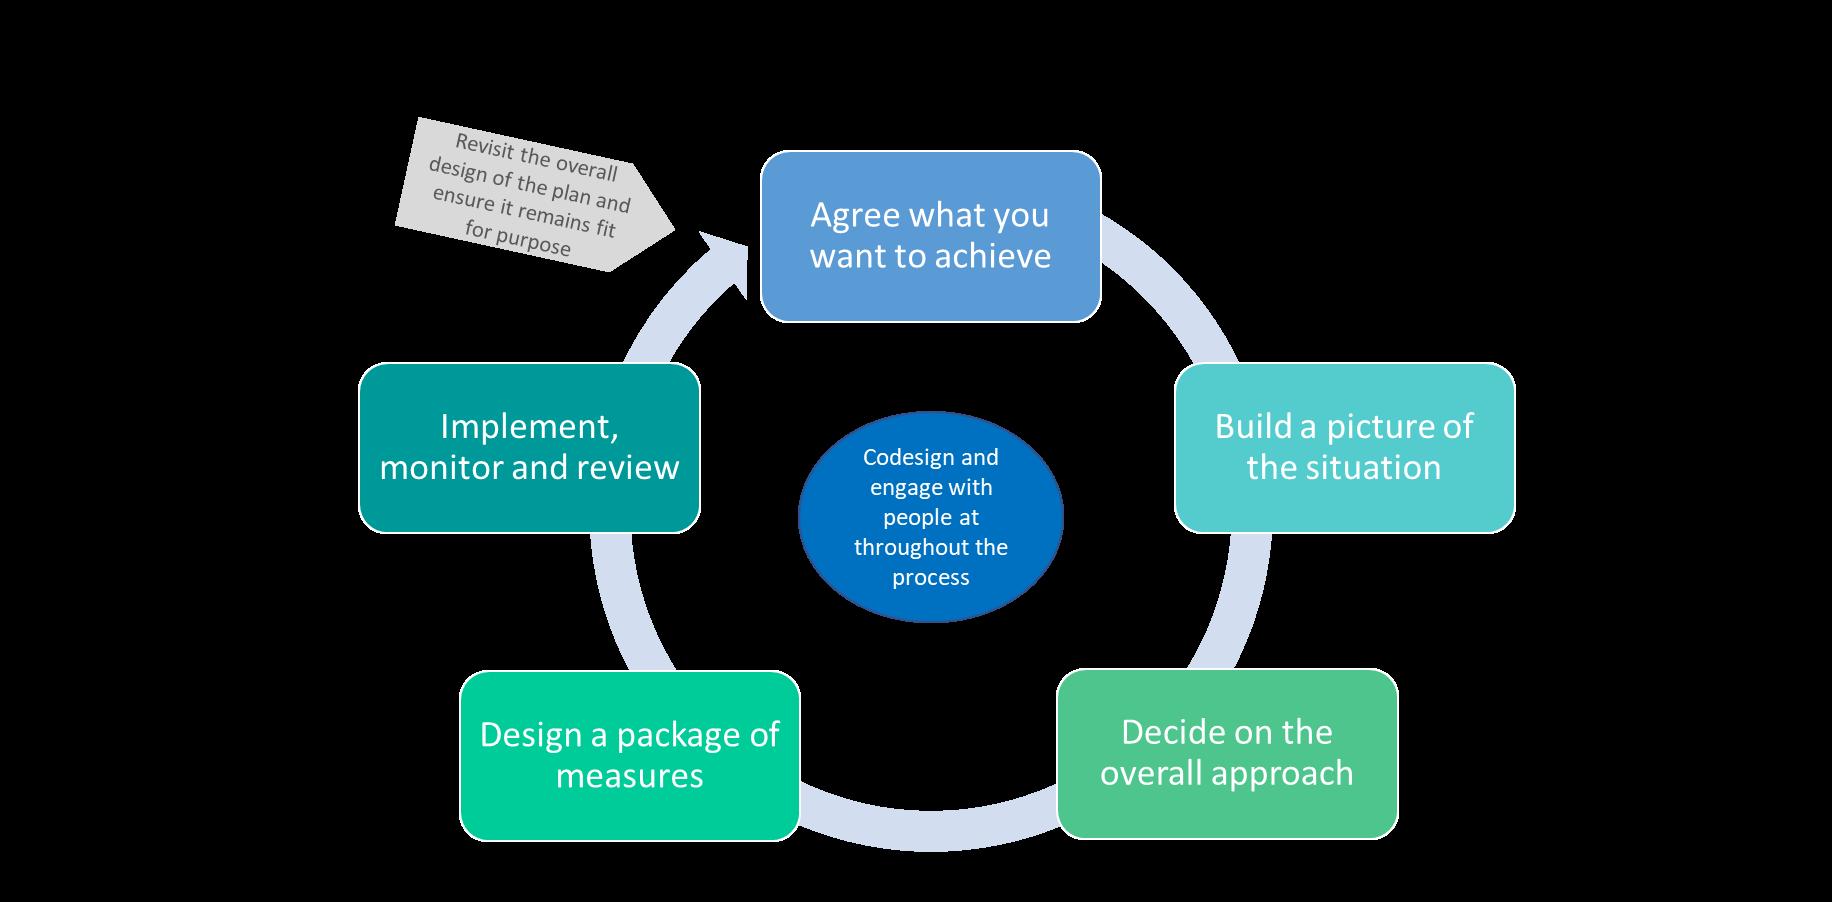
2. Purpose of the Focus Group discussions
The purpose of the discussions was to build a picture of the similarities and differences between customers’ perceptions, views and behaviour in the 4 Council areas.
The specific aim of the groups was to:
• Understand opportunities for change – as well as issues and challenges
• Understand perceptions of who provides the water, and where it comes form
• Understand use of water
• Understand if there is a behaviour they would like to change
• Identify target groups
• Get reactions to a water behaviour change program
• Identify ‘tools’ for change’ (e.g. leaflets, online, courses)
• Listen for ideas of ways people think it might be implemented
– Focus Group
Concepts of Change Page | 1
Demand Management Plan
Outcomes
Figure 1 Approach to the behaviour change component of the Rous Region Demand Management Plan
• Listen for ways they would prefer information sharing (about the project) and storytelling (within the community)
3. Formation of the Four Focus Groups
3.1 Development of the Discussion Guide
The Discussion Guide was initially developed by Liz Ampt after discussions with the RCC and Robyn Campbell to ensure that the findings fitted with both the behaviour change program development and the demand management plan. Added to this, each constituent Council was offered the option of suggesting topics to include with Ballina, Richmond Valley and Byron each contributing ideas.
3.2 Discussion Guide
The discussion guide covered these topics the complete Guide is shown in Appendix 2.
Use of water around the house
• Each person was asked how they use water round the house to get them thinking about their water use (it included thinking about leaking taps)
Behaviours
• Many people have taken actions to save water around the house…. What sort of things have you or your household done? no prompting
• Is there something you would like to do, but haven’t got around to? Explore how etc.
Volumes
• A discussion on their perception of use and volumes (specifically 160 litres per person)
Purple pipe
• Have you heard of this term? General discussion on water reuse
Drought
• What changes (if any) did you make during the drought? Continued? Perception of dry lawns etc.
Water saving tips
• Where would you look to get tips? extended discussion
• Discussion of a water saving program
Meters that tell you how much you are using all the time
• Discussion on the concept of smart meters
Source of water
• Who supplies it? Where does it come from?
Read water meters
• Permission to read meters
Plan – Focus Group
Concepts of Change Page | 2
Demand Management
Outcomes
3.3 Overall Composition and timing
The target population was people who use Rous water representing the general population of the respective LGA with a cross section of geographies, demographics and water user types. The target towns and suburbs were therefore:
Richmond Valley –Broadwater, Coraki, Evans Head, Riley’s Hill, Woodburn
Byron LGA Byron Bay, Bangalow, Broken Head, Coopers Shoot, Ewingsdale, Suffolk Park, Brunswick Heads, Billinudgel, New Brighton, Ocean Shores, South Golden Beach
Lismore LGA Chilcotts Grass, East Lismore, Girards Hill, Goonellabah, Howards Grass, Lismore, Lismore Heights, North Lismore, South Lismore, Clunes, Dorroughby, Dorroughby, Dunoon, East Coraki, North Woodburn, Tullera, Woodlawn, Wyrallah
Ballina LGA Ballina, Cumbalum, East Ballina, Skennars Head, West Ballina, Alstonvale, Alstonville, Cabbage Tree Island, Lennox Head, McLeans Ridges, Wollongbar
The specification of participant types was for recruiters to include:
• A mix of ages and gender
• A minimum 1 person renting in each group (to check for any different perspectives of owners and renters)
• At least 2 people who are not in the main urban area in each group, and
• 6 per group (this would be more if the group was in person
The groups were recruited by The Human Network (THN) with technical assistance from City Group Rooms (CGR) (both from Sydney with experience in regional NSW) and were held online via Teams with Liz Ampt facilitating. The dates and times are shown below. Each group lasted for 90 minutes.
4. Richmond Valley Discussion
Demand Management Plan – Focus Group Outcomes Concepts of Change Page | 3
4.1 Richmond Valley Group details Dink = Double income, no kids Gender Age - Yrs Town Pple in hh Of these, kids indoor outdoor Dwelling type Own/ Rent Time in area yrs) Lifestage Male 30-39 Broadwater 2 y y House Own 1-3 Dink Female 60-69 Evans Head 2 y y House Own 5-10 Empty Nester Female 18-29 Evans Head 4 2 y y Unit/apartment Rent 10-15 Family Male 18-29 Evans Head 2 y y Townhouse Own 3-5 Dink Female 40-49 Woodburn 2 y y House Rent 1-3 2 adults Use water..
4.2 Use of water around the house
The following is a summary of the way people reported using water around the house:
• All participants used water both indoors and each one had a garden
• The family with kids ‘some days we will fill up the small pool for the kids when it’s hot”
4.3 Behaviour change to date
• Woodburn water saver: “ we have a timer on the shower and that goes for 4 minutes, and if I want to wash my hair it’ll go for 8 minutes
o We also collect water in buckets as we don’t have a tank here
o We don’t wash dishes by hand they go in the dishwasher
o Also water saving showerheads
• Broadwater male in old house: “the one thing I’ve done since I moved here a year ago was fix the taps so they weren’t leaking”
o Before I came here, we used to be on tank water, so we did a lot then not flushing and all those things. So I grew up learning about those things
• Evans Head 60 69 female: The pressure around here is really poor so I’m really cranky that we have to pay the same. There’s no way I’ll be changing the showerhead
• Evans Male 18 29 ‘ we don’t water the garden for a few days when the rains coming and we put plants outside when it rains. We washup by hand so that saves.
• Evans Head 18 29 female: Well I have to admit my water is included with the rent so I don't actually know how much we use. So of course we like don't spend forever in the shower, but when we're in there, we don't really think about it, because we've never had to worry about it.
• When the kids clean their teeth, the tap gets turned off because that's what we were taught growing up. There were two tanks and pretty much if we didn't have rain and they ran out, we would have to pump from the dam and that's what we would use for like washing showers and everything. People were asked if there was something they wanted to change but hadn’t got around to:
• Broadwater: I’d like to get access to ground water but it’s illegal. I’d also like to get a tank and start collecting rainwater better. I would also like to get new showerheads when we have kids, but at the moment with the two of us it's just I don't think it's that big of a deal at the moment.
• Female 60 69 Evans Head: I mean there's just two of us in the House. When I had kids at home when you know, I was younger and that there was always ways to do things. But now not so much I mean I tend to tap off when I clean my teeth and you know stuff like that
• Woodburn water saver I’d like to set up a watering system for my vegetables. And I’d like to catch the water when I water my hanging pots.
• I’d like to change the shower head in the spare bedroom. I know how to do it I have all the tools in the garage. Just haven’t got round to it
Demand Management Plan – Focus Group Outcomes Concepts of Change Page | 4
4.4 Perceptions of volumes
• No idea
• I could probably think of a 25 litres white container so 6 of them.
• I’ve got my bill here ad it says we are using about 500 a day between the two of us/. But it’s kilolitres I’m a teacher so I happen to know its 1000 litres to a kL. But the actual bill says .5.
• I have no idea if I use more or less than 160 litres per person per day.
• Mother of 2: probably a lot more but I don’t know
• Broadwater water saver: I know we most definitely use less than that.
• It’s really hard to tell because we live in a unit with 10 houses and we have the water bill just divided by 10. And there’s a pool too.
• I can’t imagine a volume. It’d be easier for me to say I’m in the shower for 10 minutes and that’s x (but I don’t know how much it is) and then we wash every 2 days so that’s y. How much would you use in a shower in a minute?
• And then there’s flushing the toilet I’ve got no idea.
• Male Broadwater: We use a lot in the garden quite regularly. And I wash my boat every time I use it so I suppose we use quite a lot.
• I never read the bill; I just pay it so I don’t have any idea from the bill.
• Liz raised idea of 9 litre buckets = 10 litres.
• No I’d rather have some kind of calculator many agreed.
4.5 Purple Pipe
Do you know what it is?
No one had any idea.
4.6 Who supplies your water?
• every person assumed it was Richmond Valley Council
• Liz mentioned Rous
4.7 Drought
What, if any effect did it have on your behaviour?
• We were told not to wash cars and not to water your grass so didn’t wash my car the whole time
• Nothing much growing in the garden. I used tank water for that. But also no car washing, no hosing down. The Rocky Creek dam was really low so it was just a matter of conserving it for everyone.
• Mother of kids: I still had to wash clothes, but we didn’t water. Otherwise we really didn’t do much other than talked about how long the kids are in the shower.
• We only watered our food.
• We put a plug in when we were having a shower, so then we could wash the dog in there or use it in the garden.
• Male: 18 29, Evans. We caught the water in the shower when it was heating up to water the house plants. And then for a while we showered every other day.
Demand Management Plan – Focus Group Outcomes Concepts of Change Page | 5
What do you think drought proof means?
• People were not sure
o Haven’t heard of it.
o Does it mean to be sustainable?
o Collecting water? Do you use more water when it’s raining?
• When it’s raining we don’t really use more water, we’re just not as worried about it...
• It’d be good if it was like fire danger where you had a board with arrows which showed you if there is a lot of water or if it is low
• Mother of kids: I don’t change my behaviour at all (I just don’t feel bad). My 9 year old has just learned how to shower and because he’s got really long hair I usually say ‘come on hurry up’ but when it’s raining I think it’s ok to enjoy themselves. Do you mind a brown lawn?
• Nobody minded
4.8 Water saving tips and program
Where would you get them from?
• Google by all
• I’d look up science based websites (person Woodburn water saver)!!
• 18 29 year old: I’d like a carbon footprint calculator sort of style. I remember form school I used to know those things how many litres for this and that but not any more
• Teacher yes, I’ve heard that 120 litres goes into a cup of coffee but not all from here. Would anyone go on the Richmond Valley website?
• Definitely no
• More science based websites
• I wouldn’t want anyone knocking on my door
• Perhaps an email…
• I don't know, maybe making like a day out of it like they have for the fire brigade like through their open days and that and make it fun, maybe doing something like that with kids.
• Woodburn water saver: It’d be good to have something digitally installed in your kitchen so you could see what you are using and set a goal ‘I only want to use a certain number of litres’ most liked this idea.
4.9 Perception of smart meters
• They had not heard of smart meters, but as above, someone came up with the idea and everyone like it.
4.10 Permission to read They will email if interested
Demand Management Plan – Focus Group Outcomes Concepts of Change Page | 6
4.11 Other comments
General comments on water quality
• Female from Woodburn (a big water saver) ‘ none of the water gets drunk here – it tastes horrible. We’ve noticed a pattern when there’s going to be heavy rain – the water becomes very chlorinated. I buy bottled water”
Reading bills
• The Woodburn water saver: “But we also we work it out on our bills and then we can compare the average person's usage and then calculate it through our bills, so we have our water bill, which is actually very, very cheap.”
5. Byron Discussion
5.1 Byron Group – details
Female 60-69 Byron Bay 1 Y esBalconyUnit/apartment Rent 15-20 Single no kids
Male 18-29 Byron Bay 5 YesYes House Rent 1-2 Single no kids
Male 40-49 Suffolk Park 42 YesYes House Rent Life Couple + kids
Female 50-59 Suffolk Park 1 YesYes Villa Own 20+ Empty Nester
Male 40-49 Byron Bay 1 Yes ? Unit/apartment Rent 3-5 Single no kids
Male 50-59 Byron Bay 1 YesYes TownhouseRent 3-5 Single no kids
5.2 Use of water around the house
My water usage is pretty good embarrassingly good when I tell my neighbours my water bill they literally go ‘what? I have a garden but it’s all pretty drought proof stuff.
• Female 60 69, upstairs uni, Byron: Water is precious but saying that I give myself a really long hot shower every now and again really mindfully and I know I it feels like it's being very wasteful but just love it
• I water my balcony gardens with a watering can and if I don't keep up the water enough, it just goes out really quickly because it's dry. I rent
• Male 5 59, Byron I am in a townhouse and we actually get our water billed separately so I’m sort of conscious of how much I use. Showers, washing, washing dishes - and I’ve got a little backyard I tend to go for drought resistant plants, a lot more natives than anything.
• Male, 40 49, lives alone, Byron. 2 jobs – 1 is maintaining swimming pools, so I see a lot of water use.
5.3 Behaviour change to date
• Having shorter showers, only watering the garden when there’s water.
• Liz, do you measure the time in the shower?
• I usually take like 5 minutes
• Shared house, Suffolk Park I haven’t really stuck with the things from my tank water days. I was in Sydney for a while going to uni and you get pretty lazy down there. It just comes from a huge dam compared to a tank. Now we’re in a shared house – short showers in the morning and maybe a lazy one in the evening. I don’t think anyone’s
Demand Management Plan – Focus Group Outcomes Concepts of Change Page | 7
Gender Age - Yrs Town Pple in hh Of these, kids indooroutdoor Dwelling type Own/ Rent Time in area yrs) Lifestage
Use water..
taking longer than 10 minutes. We usually water out the back not out the front lawn probably to the detriment of our landlord.
• F 50 59 – used to live in England: I had to learn to wash up not under a running tap which I’d grown up doing that was a major one. In the summer I do carry big bucket into the shower, and I do water, the plants with that first if we're not getting much rain.
• F 60 69 I’m more than happy to put a bucket underneath the shower, particularly as the shower water is warming up, so I do. I cannot think of much else except in really hot summers when I am willing to not plant.
• M 50 59: I’m in a complex of a half a dozen townhouses and we all get individual water bills. But in talking to my neighbours I know that I’m on the low end of the spectrum so. Probably the only thing that is noticeable is that I’ll tend to go for drought resistant natives. In summer if it doesn't rain for a week or two, I’ll just give it a quick sprinkle other than that I just sort of let them go.
• M 40 49 in his work. I try to backwash less out of swimming pools in summer. My Dad just has tank water, so I’ve lived in that situation and know what it is like. I don’t run the tap when I’m washing up Something you want to change and have not?
• We’re renting, so you don’t think about those things.
• A rainwater tank
• I want to put drippers on the pots, but I’m worrying about them dripping on the carpet.
• Yeah, I would struggle a lot, like the others, to know when I have used 160 litres. I have no idea how much a shower uses. I’d feel quite constricted if I was told there’s only a certain amount of water you can use.
5.4 Perceptions of volumes
How do you imagine the volume of 160 litres?
• No idea was the response from most initially
• I could imagine a bathtub of water how much is that? perhaps 160 litres??
• Perhaps it’s the size of a fridge?
• Even if I could picture 160 litre bottles, how would I know how much is coming through the shower?
• If there were something to look at in the house, to see how much I’ve used, I’d be prepared to go downstairs and check the meter once a week or something
• The only way we can measure is on the bills we get every 3 months. I have an app for my electricity I can see my electricity use each day. That may be the way to go. Like I only do big loads of wash on the weekends when my electricity is a lot cheaper.
5.5 Purple Pipe
• One person knows a lady who has one in Ballina Shire. You get a lot of them there and they have signs up which say ‘recycled water’
• No one has one in their house.
o It’s a good idea for watering and maybe washing the car and stuff like that…
Demand Management Plan – Focus Group Outcomes Concepts of Change Page | 8
• I’ve seen a recycled water system down the back of my house on the playing fields (Byron Bay). I imagine it’s been cleaned a lot. But I’ve never thought about where it comes from till now.
5.6 Drought
Effects of drought on your behaviour:
• pretty much reducing shower time, washing dishes without running tap, not watering the garden unless essential
• When it was really bad pretty it was much just like go for a swim down the beach in the afternoon and just have the salt water. I remember them even turning off the showers down at the beach when it was really bad
• We used to have this big, huge bath and the kids were both in that bath together.
• Washing the car just didn't think about it. I didn't have grass but just some grey brown growing thing where the lawn wa
• I changed I actually bought myself a little timer and I started timing myself because, like it's hard for me to work out how long I’m in the shower. Three minutes is enough, but a bit hard to wash your hair.
• I used to fill up the sink, and I don’t even know why I did that. But I stopped.
• I might have skipped one or two showers in a week. And sometimes I’d just go across the road to the beach instead of showering.
• Person who worked with swimming pools: I’d check their water level and not do back washing unless it desperately needed it.
• In the dry months I probably get in the ocean a bit more so a bit less. But I tend to have a longer shower in the wet months so I think it evens itself out.
Drought proof what do you think it means?
• Drain cleaning that sort of thing.
• No one else really knew Do you use less water in the wet months?
• Much the same maybe a little bit less
• It could be the opposite for us. When the days get shorter and darker and colder, I tend to stick in the shower a little bit more.
• More likely to have more than 1 shower a day when it’s cold
5.7 Water saving tips and program
Where would you look for water saving tips?
• Initial instinct is Google. But if the Byron Shire was up there in the search results, I’d trust them as a resource, so it’d be good to get advice from them rather than a random blog.
• I’d look on Google too, but it would be interesting to look for our sponsor., I know they used to do these water saving campaigns and you’d get something free in the Echo several agreed.
• I have a colleague in Nimbin Community Centre where she teaches a lot of permaculture and sustainable communities. I’d go straight to her. I trust her and I
Demand Management Plan – Focus Group Outcomes Concepts of Change Page | 9
know her ethos and the fact that I’m part of the community there would mean I’d trust her judgement
• Someone else: No idea where I’d go!!
• Student: I’ll try to find out how many litres of water you are actually using in a 5 minute shower, or an average wash up or something. That would help you understand.
• When you get the bill, you’ve already used the water
Who/how would you run a program to reduce water use?
• Social media
• Facebook
• 18 29 year old. I don’t have Facebook or Instagram anymore. I’d probably see it in the ECHO.
• I’d find a text really handy and then a hotline so I can talk to a person. I like person to person contact but I don’t want to get into a car to do it.
• It requires knowledge and education no one will voluntarily do it if they don’t believe it’s a good idea.
• Community centre and library would be good places for localised contact
• For me it would be best through work
5.8 Perception of smart meters
Smart meter described then:
• I probably wouldn’t look at it (40 49 M)
• I’d look if I had a high bill
• (Swimming pool worker) From previous experience with water bills I seemed to get the same bill whether I was away or when there were two people living there, and this sticks with me so I still carry that with me I just feel like it's a guesstimate or I thought it was not really representative of the quarter, I was using. In my work I see so much wastage, so I’m not inspired to change my behaviour.
5.9 Source of water
Who provides the water?
• Not sure was the general feeling (too afraid to guess).
• Council perhaps?
• Someone looked at a bill Byron!!
• Someone else guessed Rous I sort of think I heard that Council buys it from Rous
• I think the water comes from Rocky
• Lismore?
5.10
Other comments
• I grew up on tank water, so I kind of learnt some good habits early on, because you know we have to shower with a bucket in there just to make sure we're not wasting water.
Demand Management Plan – Focus Group Outcomes Concepts of Change Page | 10
• I grew up in the UK in London, where there was this interesting fact the water out of your tap has gone through the human body nine times according to the Thames waterboard. They clean the water and reuse it and it took me years to realize that the water down here that's out of the taps here comes from a dam.
6. Lismore Discussion
6.1 Lismore Group details
Male 50-59
Male 40-49 Lismore
Female 30-39 Goonellabah
Own 15-20 Family
10-15 Family
Yes Yes House Own 5-10 Family
Male 60-69 East Lismore 2 Yes Yes House Rent 20+ Empty Nester
Female 30-39 South Lismore 3 1 Yes Yes House Own 10-15 Family
Female 40-49 Lismore Heights 5 3 Yes Yes House Own 10-15 Family
6.2 Use of water around the house
• (Goonellabah M) Normal shower and toilet. By daughter’s just become a teenager, so she’s learning how to have long showers. At work I probably use a lot more water as I’m a science teacher so there’s usually a lot of water, depending on the topic.
o I try and minimize my watering the lawn, but I probably use more water in weed spraying than actual watering.
• (Lismore M) Bulk of mine is washing and dishwashing. But my 11 year old son and I like to do a bit of gardening too
• (Goonellabah F one child 3, one child 1) We use a little bit in showers and stuff like that and pretty much after the one year old has food, we have to go and put her in the shower to get clean. We also use water in the kitchen and laundry and have veggies too
• (South Lismore F parents and 13 yr old) Daily showering, little bit of veggie gardening. Most usage probably in cooking and preparing meals washing the veggies things like that. I have a studio in town ceramic artist so I use a bit of water there painting, cleaning brushes, washing out screen printing screens.
• (East Lismore M 60 69) Just wife and myself we’ve been replacing the mixer tap in the kitchen, washers in the laundry. Actually breaking the lease doing these things. Very hefty bills lately. We don’t use a great deal of water other than those leaks. The garden also uses water. The washing machine gets a bit of a workout because my wife is always in the gym.
• (Lismore Heights F40 49) partner and 3 children [7 yr old twins and a 5 yr old]. We shower morning and night. The kids at night. We’ve been starting to practise have less showers because we're about to build a house and we’ll be on tank water so we're trying to train the kids a little bit now because we've just been quite whatever with water you know it hasn't really phased us too much. Dishwasher runs twice, sometimes 3 times a day.
Demand Management Plan – Focus Group Outcomes Concepts of Change Page | 11
Lismore
Gender Age - Yrs Town Pple in hh Of these, kids indoor outdoor Dwelling type
Own/ Rent Time in area yrs) Lifestage
Goonellabah 2 1 Yes Yes House
2 1 Yes Yes House Own
4 2
Use water..
o We’re not good at gardening. Sometimes I’ll leave the sprinkler on when it looks like the grass is dead. And then I leave it on.
o We have 4 pets which use water as well.
6.3 Behaviour change to date
• There are times when there is just a little bit of water left in the drink bottle and it’ll go on the plants rather than ditching it.
• When I’m here by myself I use minimal dishes and might only wash them every couple of days.
• And if there’re leaks or drips, I get onto it was quickly as possible.
• I’m probably not the best gardener, but I will wait till night time till the sun goes down to water the plants so it doesn’t evaporate as quickly.
• I used to rinse off everything then wash it again and then drain it. Now technology in the dishwashers is a lot better so I just basically scrape off the food and putting it straight into the dishwasher.
• I moved into a hundred year old house so lots must have been leaking because my bill was high. But comes after 3 months so you don’t know till then.
• I make sure that the pumps are working properly, and then, if you need to water, the garden or whatever we actually use the tank water
• We came here from a property where we only had tank water so we’re pretty conscious about showering time 5 maximum 10 minutes. And we recently renovated the kitchen and got a dishwasher that’s low water usage. Am hoping to invest in a tank
• While I like to do full washing loads, I can't always do them, especially when I’ve had my daughter for a handful of days, and so, if I’ve got to get her clothes wash before she goes back to mom and.
o So, so there will be some loads that are very, very small, especially like I’m very fastidious about not mixing whites and colours and not mixing reds with any other colours and that sort of thing so that's the main area that is probably where I use the most water.
• My lawn is a nice crispy shade of brown!
• If it’s yellow let it mellow, if it’s brown flush it down ok for little kids, but not teenagers. What would you like to do, but haven’t got to?
• (M 60 69 East Lismore) I would like to change the washers and rings, but we are renting, and I haven’t got the wherewithal to do that. But as long as we have to pay bucketloads of money
• We’ve talked about using the grey water for the garden, but we haven’t done it. We will do it in our new house
• A water saving irrigation system in the back yard. But the pipes and taps are in really awkward places away from the garden areas, so it creates a little bit of an issue. And the design of the house means it’s very hard to put in water tanks which I’d like to do.
• In my old house I’d like to change the plumbing because the pipes are quite thin and the bottleneck with the water means we have to run the hot water for a substantial amount longer so we’re wasting water unnecessarily.
Demand Management Plan – Focus Group Outcomes Concepts of Change Page | 12
6.4 Perceptions of volumes
How long do you spend in the shower?
• I have no idea; I just get in the shower and do what I have to do
• I would hazard a guess and say maybe 5 minutes How do you picture 160 litres of water?
• I suppose a drum or a fish tank but I don’t know how many litres they’ve got. I’d have to look at what the averages are for a wash cycle and a typical shower litres per minute. A 5 minute shower might depend on the type of shower head you have. I have no concept of the average amount of litres for all this.
• I’m trying to picture in buckets and I can’t think how many that would be.
• I’m looking at my bill and it says that the consumption per quarter was 56 Kilolitres but I don’t know how much that is.
• I think our last quarterly bill was $186 but I don’t know how it relates to litres.
• I’d visualise from when we were down on the farm and we would have to pump from the dam and our drinking water would be bought in those 10 litre plastic containers so I can picture 16 of these.
• I’d relate it back to the 1.5 litre water bottles my wife uses and 2 of those is 3 litres so multiplied by 50 is 150...
• I have no concept whatever. I could picture buckets lined up in your head but you’d need to know about turning on a tap or flushing a toilet I have no concept
6.5 Purple Pipe
• I don’t have one, but my experience with purple pipes is that they are recycled water
• No one has one in Lismore
• I know they can be in new estates and may be expand in other areas. But the infrastructure costs would be a lot
• It’s for toilets and garden
• I had no idea what a purple pipe was till you mentioned it
• I was drinking recycled water in London so I’m not averse to drinking it per se Would you use it?
• Yes, it’d be absolutely fantastic for flushing toilets and I’d use it on gardens and for outside stuff, but the I couldn’t come at the thought of drinking it.
6.6 Drought
What changes (if any) did you make during the drought?
• During that time I washed my car only 2 3 times in a whole year. But I still had showers. Not a lot of change.
• I was probably more conscious of other people around me using water not residential but looking at government.
• Nothing too drastic just we wouldn’t water outside only the established plants so they didn’t die I couldn’t bear losing the fruit trees
Demand Management Plan – Focus Group Outcomes Concepts of Change Page | 13
• At the time back then there were 7 people including teenagers, so it was harder
• Well I have to admit I was a bit blasé about it because I spent a lot of time driving through the Northern Rivers and everything was green I saw images of other parts of the state which were a barren wasteland.
6.7 Water saving tips and program
• Council website
• (M 60 69 East Lismore) I certainly wouldn’t go to Rous Water
• But Rous Water has put out water saving tip leaflets and information packages especially during the last drought. They were reasonably proactive. I think it was Rous Council or perhaps it was the state government.
• Google of course and Facebook
• If providers want us to reduce water it’s a fair comment they should be providing the tools to do it as well
• A star rating system would be good
• When I was teaching at pre school for 5 years, we had to teach sustainability, so we talked about watering plants and all sorts of things. There would be little programs where the kids would try to monitor their water at home. And it was Rous Water who came in and helped (sorry East Lismore man!)
How would you run a water saving program?
• You’d definitely need incentives whether it is rebates or shower heads.
• I’d probably be more likely to read it from the mailbox. I wouldn’t answer the phone and wouldn’t be interested in seeing it on TV because I don’t have free time to watch.
• Emails would be good for me
• Getting kids involved would be good without making it too philosophical they’re the ones who are going to shape the future
• Facebook would work for me if they’ve got a page and it’s active, I’d read it.
• Tell my husband who would tell me. And how would you reach him? ABC radio
• No financial incentives for us. We actually pay everything fortnightly so our water bills are in credit $500 we just pay the same amount each fortnight.
• I’m not on social media (M 50 59, Goonellabah) so that won’t work
6.8 Perception of smart meters
Do you know where your meter is?
• All did but had not read it one had watched it going around. After a short description of smart meters
• I think if you've got something staring you in the face saying how much you are using it would be good. I know it exists for electricity with kilowatts.
• I think if you’re looking at something spinning over you might say, hang on, there’s no taps running so what’s happening.
• Yes, it’d be useful
Demand Management Plan – Focus Group Outcomes Concepts of Change Page | 14
• It’d be good if it incorporated something that alerted you “you’ve reached x” rather than having an actual app you have to look at. Or you could set yourself a goal
6.9 Source of water
Who provides the water?
• All except one person knew it was Rous I expressed surprise no other group knew this as well.
• We have the headquarters of Rous water in Lismore a lot of the trucks go round if there's an issue with plumbing Rous water comes out okay I just assumed it.
• Rous Water is pumping water from Wilsons River back up to the dam at Rocky Creek. And then they manage the water supply and then the Councils themselves become responsible for maintenance of the pipe work that’s my understanding.
6.10
Permission to read
People were offered the opportunity
6.11 General comments
• (M 60 69 East Lismore) I find it funny that we were talking about water, especially in Lismore because we have a river running right through the town. we have an abundant supply of water but somebody somewhere along the line decided to prioritise the delivery of water to households. It’s a free resource and now we have to pay and be conscious about how we are using it. By using water we're actually helping the environment! Sorry, the Council has a vested interest in Rous Water so if they can supply the water directly, they will.
7. Ballina Discussion
7.1
Ballina Group Details
Gender Age -
Yrs Town
40-49 Skennars Head 5 3 Yes Yes House Own 5-10 Family
7.2 Use of water around the house
• (F 60 69, Lennox) We use water just around the garden for everyday things. I actually I come from the country I grew up on a farm so I try my hardest to actually not waste water.
Demand Management Plan – Focus Group Outcomes Concepts of Change Page | 15
Pple
Of
o And I’m a ceramic artist and so I use quite a bit of water in my ceramic work in my practice. indoor outdoor
in hh
these, kids
Dwelling type Own/ Rent Time in area yrs) Lifestage
2 Yes Yes
Male 50-59 Lennox Head
House Own 20+ Empty Nester
2 Yes Yes
Yes Yes
Female 60-69 Lennox Head
Unit/apartment Own 15-20 Empty Nester Female 50-59 Ballina 2
Unit/apartment Rent 20+ Empty Nester
Male
Male 30-39 East Ballina 5 or 2 1 Yes Yes House Own 5-10 Family Male 40-49 Wollongbar 5 3 Yes Yes House Own 3-5 Family
• (F50 59 Ballina) I live with my adult son, and we just do the normal things washing, dishwasher, showers, cleaning
• (M 40 49 Skennars Head) My wife and we've got three primary school aged kids and a dog so other than usual things we wash the dog with water, and we don't do a lot of gardening so there's not a lot.
o We hire out of caravans as well, so some of the water goes into tanks and then gets consumed elsewhere around.
• (F 30 39 East Ballina) But I’ve got a bit of a weird situation I live one week in a house with five people with my family and then I spend the other week in a van travelling around between the border, which is great so I work as a wedding coordinator celebrant planner also in the army reserves and a support group in Ballin. I’ve got a little boy who's five and he loves water. So I use the water for him washing the dog. Aa big one for me is I’ve got a 110 litre tank for my van so every other week I’m filling that up 110 litres. That’s for everything shower toilet and sink so I have a good concept of water use
• (M 40 49 Wollongbar) washing, showers, washing cars, gardens a little veggie at the front yard, animals.
7.3 Behaviour change to date
• I’ve thought of putting in a rainwater tank so I could top up the pool, which takes quite a bit
• I do the dishwasher once a day instead of twice
• I do little thing that I probably learnt since I was a child like when I clean my teeth, I turn the tap off between spits. I even turn off a tap in a public toilet or if I hear the toilet running, I’ll go and press it to stop. And I recycle water in my studio as much as I can. I let the sediments settle and then scrape off the top water so for some things I can use that. And I throw the water with the sediment back in the garden.
• I don't do anything, particularly but I also come from the country so I’m always being careful to like have short showers and turn the tap off. We have a tank too.
• We’re not overly conscious of it we haven’t taken any active measures. Our two little boys have just got to the age when they’re suddenly starting to enjoy being in the shower. We had empty hot water for a few weeks. Then we got a water saving tap for the bathroom I didn’t know they existed.
• When I’m at home (traveller) the rule is that unless it’s the first wee of the day ‘if it’s yellow let it mellow, if it’s brown flush it down’. Where we lived before this company came around and gave use a shower head. And a timer to stick on the shower.
• I water the lemon tree with a pee so no flushing. And dishwasher once a day even though we’re 5. Anything you wanted to do, but haven’t got around to?
• I would like have Councils and governments do something to fix the fact that we’ve got pipes going so far that by the time the water gets from the water supply to the shower it’s cold it is such as waste of cold water going down the drain. We could get a Rinnai and have it connected to our bathroom I suppose we did do that in Melbourne. The
Demand Management Plan – Focus Group Outcomes Concepts of Change Page | 16
place we live in is old and we haven’t got the money at the moment. And we haven’t got gas so we’d have to go and get a cylinder.
• My Dad collects water in buckets around the garden when it rains – and I’d like to do that. It’d be great for indoor plants. And I’d like to get a rainwater tank.
• That reminds me that a lot of wastewater is going down the drains and ends up on the beach or the sewer system. We could easily reuse shower water on the garden most of the time.
7.4 Perceptions of volumes
Can you imagine 160 litres? How would you picture it?
• I’m just looking at the bath to be honest I don’t know. But would that be 160 litres? I’m just guessing.
• In my head I’m looking at 1 litre milk containers and imagining 160 of them but it doesn’t sound like much water. I like the bath idea.
• I can’t picture it at all. So I went straight to 8 20 litre buckets that lots of fishing people have. But a 44 gallon steel drum is another way to imagine it they are 315 litres (so you’ve got pretty much half a 44 gallon drum)
• Well, I don’t know I never really thought about it because it’s not something you think about, is it? But perhaps I could imagine 20 litre buckets. That’s a lot of water when you think about it.
• 160 litres sounds like a lot of water when you think of just brushing your teeth quickly or making a cup of tea. As soon as you leave the tap running for a long time or wash the car it probably gets away from you.
• They don’t actually tell you how much a toilet is using how many litres per flush
• I don’t think necessarily about the volume of water but the minutes. I mean sometimes you go into the shower and you’re there for ages. You might wash your hair, and shave your legs, so that would be a lot of water in that time. I really think a bit more information would put it into perspective.
• Once you’ve turned the tap on you know, there are a lot of variables, so it becomes hard to be able to visualise it. You can get toilets that use masses of water and some that use nearly nothing.
• You know the water you use when watering your plants, but when you’re washing the car, it depends on how hard you turn on the tap. You should give people targets or an allowance.
• So when you have kids, you’re washing things all the time. So even if you did have an allowance it’d have to be for the whole family because the kids would use really a lot.
• I’m looking at my water bill and it says that the target consumption is 160 litres per person per day. it says that on the rates notice. It should be like a KPI kind of or something I would like to be able to see and go “okay so last quarter, I was at 187 average per person in the household let's see if we can drop it down to like 165” At the moment it doesn't really give you the exact number just gives you this stupid little graph and not good.
• And you can have really wasteful people in your household, and you can have really, really economical people. So, you know how do you balance it, especially in a group
Demand Management Plan – Focus Group Outcomes Concepts of Change Page | 17
house or if you're a parent, you know if you say “hey kids you're wasting water”. But when you’ve got people living together it's a bit harder.
• So, in a household where you’ve got little kids you might need to use a lot per little kid because they've got so much washing, whereas the adults could use less than 160 because they’re able to have shorter showers or something like that, so, in some ways it would never be policed, but it would allow us freedoms to decide how to distribute that amount.
• But you need more feedback that every 3 months. You can look at your meter but unless you do that regularly you have no idea.
7.5 Purple Pipe
Do you know what they are?
• Some had heard of them
• Some had no clue
• I have a friend in Lennox who has a second water main with recycled water. They’ve got a recycling plant in Lennox.
• I think you’re not allowed to water fruit plants or veggies with it. Well not recommended.
Would you use it?
• All would like to
o but not sure if it would be possible to get pipes to some old units and houses.
• The cost of retrofitting and laying all the infrastructure to existing properties would be better spent in refining the recycling process so that all the water can be put through the tap. It’s doable...
o I don’t want to think about it…
•
7.6 Drought
Did you make changes during the drought?
• Shorter showers and properly let my garden die. And I tried to encourage shorter showers and have the dishwasher completely full
• We gave up on the garden for a start we just said that ‘bad luck, if it survives great’ so we just had hardy things in the garden. And we had a 3 minute egg time so we were very very careful. But we don’t have that anymore. I’ve got a sore back so sometimes I’m naughty and just have a long shower and I’m feeling really guilty
• During the drought I think we were pretty much in control of our children’s water consumption because they were a lot younger. My wife probably did things, but I can’t remember doing things differently. I mean, we abided by the restrictions with watering by number though.
• We stopped using sprinklers, so it was survival of the fitters we were emptying the washing water into buckets. We still don’t have a sprinkler actually.
Demand Management Plan – Focus Group Outcomes Concepts of Change Page | 18
• We all shaved our hair, so we didn’t have to wash it. And we also didn’t wash dishes every day.
• I was a new mum and I had really bad postnatal depression, so I was doing things like not showering for a few days, but it was not because of the drought… Have you heard the term drought proof?
• Maybe like you put slow flow tap nozzles?
• Not really Do you use water differently in the winter months?
• I tend to have a longer shower
• Don’t you hate it when the Council’s got the sprinkler system on and it’s just been raining?
• I think I use less in the garden, but more in the house because it’s cooler and I want to stay under the shower longer. So I crank up the spa and stay in there.
DO you mind having a brown lawn?
• Consensus no
• Well, I prefer my lawn to look green in reality but sometimes you just have to let it go.
• Well I have fake plants and fake grass because I don’t like lawn and plant work outside.
• I prefer it when my grass is brown because I don’t have to keep paying to get it mown.
7.7 Water saving tips and program
• The local Council they’d probably have lots of tips about saving water and stuff
• I’d go to Bunnings they have tips on everything else.
• Well Google of course How could we contact you?
• Ring me
• Advertising campaign
• Ads of Facebook
• I wouldn’t do a phone conversation
• I think the thing that really works is when the community understands the vulnerability of the water supply so that’s the main thing. Even though we might have had a couple of good years
• You need to be informed when the kids are little because that’s when you care about these things, I used to let the kids sit in the shower until the hot water ran out because we were on town water. I didn’t think there was an issue with water shortages. Then I found out the dams were really, really low and we got put on water restrictions and I was really angry that it hadn’t been communicated in some form
• Through children and now grandchildren
• With a letter you only get one shot at it. With digital media you can put it in people’s faces more often not sure if that’s better though
Demand Management Plan – Focus Group Outcomes Concepts of Change Page | 19
7.8 Perception of smart meters
Do you know where your meter is and have you read it?
• Yes I read it because I had an issue with my bill
• Yes I was a geography teacher and we used to teach about water. And so my goal is to get the kids to do a project, where they had to monitor their water use in their houses and so they had to read them every day, and so they have to come into school in the class and they used to have to say how much water they had used. So I did it myself too.
• There was a time when I thought I had a leak and I don’t necessarily trust some Council figures.
7.9 Source of water
• One thought Rous
• Most Ballina
7.10 Permission to read Some were interested
8. Summary
8.1 Use of water around the house
• There was extremely varied use of water between areas and, more importantly, between different household types. For example there were marked differences between
o households with children (and the age of the children was important babies and early teenagers were reported as using the most water)
o single person households
o ‘empty nester’ households where, in many cases they had relaxed and started using more water now that they were ‘free of children’
• People who have grown up with only tank water know how to save but don’t always do it.
• For discretionary uses of water (e.g. lawns plants) there is very little knowledge of usage e.g. ‘we only water veggies’ rather than knowing how long they water or how much water used
• All people in the groups used water both in and outdoors most people had a garden of some type, with 1 2 having plants on a balcony.
8.2 Behaviour change to date
• When asked, people were usually able to cite changes they had made over time. Some people had habits from childhood often from rural areas where only tank water was available
Demand Management Plan – Focus Group Outcomes Concepts of Change Page | 20
• People were keen to tell others that they were making changes this is important in the context of a behaviour change program where word of mouth often plays an important role in encouraging change
• The drought brought about change , but not sustained.
8.3 Perceptions of volumes
• No one has a concept of 160 litres
• Volumes could be imagined with different things for different people
o buckets (9=10 litre or sometimes 20 litre)
o Bathtubs
o Litre or 1.5 litre bottles
o 44 gallon drum BUT
• Ubiquitously the need was to know how much per use (e.g. average shower, flush wash up). There was very limited knowledge of how much each source used, and where to obtain information (easily) on this particularly for existing appliances.
• Overall these comments suggest that the target of 160 litres per person per household is not effective
• Several people were able to refer to bills, but this was generally not useful because
o The usage was in Kilolitres (which people didn’t understand)
o They needed to divide the 3 month usage by people in the household so quite complicated.
o The information is provided after the water is used, so it is hard to work out why usage might have been higher or lower than usual.
8.4 Purple Pipe
• Not well known in any group.
• Most people would happily use it for the garden and toilet
• In a couple of groups people had heard of drinking recycled water in London
o Not well accepted
8.5 Drought
As above changes made but not sustained.
Some people reported that they were really surprised when they learnt that water was scarce. They had no concept that in built up areas there was a water shortage.
Little understanding of the word drought proof
8.6 Water saving tips and program
• Google
• But people who knew informed people would prefer them
• Would be good if a local Council came to the top of a Google search because it would be likely to be more relevant
• Some would like in person, but not have to drive (e.g. a hot line)
Plan – Focus Group
Concepts of Change Page | 21
Demand Management
Outcomes
• Someone suggested Bunnings because they always give tips and would have water saving devices
If there was a program how would it best be conveyed:
• There were many different ideas and this would need to be researched further most likely in a survey or focus groups specifically on this topic
• There was some support for education program in schools where kids were recognised as the target
8.7
Perception of smart meters
• Not well known
• However, lots of support for the ability to know consumption in real time easily
• In 2 of the groups the concept came up without knowledge so that they would have a better handle on their use
8.8 Source of water
• Mixed knowledge in Ballina and Byron mostly uncertain
• No one knew in Richmond Valley
• Lismore knew it was Rous because of the vans driving around
• This means that the branding of any behaviour change/education program is very important
• Very little (and sometimes incorrect) knowledge of the water cycle sources of water from the environment etc. regardless of the water utility or provider.
8.9
Permission to read
• A bit cumbersome, so not well taken up
• Also probably of little value for this group as meters were not read prior to meeting.
Demand Management Plan – Focus Group
Concepts of Change Page | 22
Outcomes
9. Appendices
Demand Management Plan – Focus Group Outcomes Concepts of Change Page | 23
Appendix 1 – Screening Questions
SCREENING QUESTIONS
1. Do you or anyone in your household work in any of the following industries? a. Marketing b. Market research c. Advertising, media, journalism d. Public relations e. Water related industries f. None of the above Continue
2. What State do you live in? a. NSW Continue b. QLD c. VIC d. Other 3. What suburb/town do you live in? _____________________ Check list and exclude if not on list 4. What is your postcode? __________________
5. How would you describe the setting of where you currently live? a. I live on acreage out of the main town centre b. I live on a residential block out of the town centre c. I live in/close to the town centre Minimum 2 living in town centre in each group
6. What type of dwelling do you live in? a. Freestanding house b. Villa c. Townhouse d. Unit/apartment e. Other, please specify:____________________
7. Do you own or rent the property you live in? a. Own with or without a mortgage b. Rent c. Other please specify:
Minimum 1 x renter in each group
8. How long have you lived in the area for (even if it’s not at the same house) a. 1 3 years b. 3 5 years c. 5 10 years d. 10 15 years e. 15 20 years f. 20+ years g. All my life
Demand Management Plan – Focus Group Outcomes Concepts of Change Page | 24
9. Do you receive quarterly water bills or do you have your own water supply?
a. I/we use town water & receive water bills b. I/we have our own water supply Terminate c. I/we have both town & tank water & receive water bills
10. Who in your household is responsible for paying the water bill? a. I am the main person that pays the water bill b. I jointly pay the water bill c. I do not pay the water bill
11. What is your life stage? a. Single no kids b. Couple no kids c. Single/couple with kids continue to Q12 d. Empty nester kids grown up & left home e. Other, please specify: _______
12. What are the ages of all of your children living with you? ___________________
13. Which of the following age brackets do you fit into? a. 18 29 years b. 30 39 years c. 40 49 years d. 50 59 years e. 60 69 years f. 70+ years
14. Are you: a. Male b. Female c. Non binary
15. Which of the following devices do you own & use? a. Tablet with WORKING webcam/camera & sound b. Desktop/laptop computer with WORKING webcam & sound c. All of the above d. None of the above Terminate
16. How would you describe your internet connection? a. Strong b. A bit hit & miss c. Not very strong
17. Have you used Zoom before? a. Yes b. No
Demand Management Plan – Focus Group
Concepts of Change Page | 25
Outcomes
Demand Management Plan – Focus Group Outcomes Concepts of Change Page | 26 Appendix 2 –
Discussion Guide
Discussion Guide
1. Before introductions
Getting impressions before they hear what others say.
Written task:
1. Jot down the ways you use water round the house and garden (to get them thinking about water use) 2. Is there anything about your water use that you would like to change? If yes, what. 3. Who do you think supplies your water? the name of the supplier
2. Introductions
Brief introductions with each person to briefly say where they live, how many people in the household and describe their household water use (New development? Out of town? Strata/multiple occupancy)
3. Discussion
3.1 Use of water around the house
Ask each person
Bathroom Kitchen Garden/outdoors Leaking taps?
3.2 Behaviours
Many people have taken actions to save water around the house…. What sort of things have you or your household done? no prompting
Bathroom 1. Installed low flow showerhead 2. Installed water restrictors 3. Turn off tap when brushing teeth 4. Use shower timer 5. Installed dual flush 6. Started to use dual flush 7. Collect grey water (by installing a system 8. Started to collect water from shower or elsewhere (buckets) 9. Fixed leaking taps 97. Something else <specify> 98. None
Kitchen 1. Started to turn on dishwasher only when full 2. Started to select economy setting on dishwasher 3. Started to reuse sink water/use a bowl to wash vegies 4. Stopped rinsing dishes 5. Bought a more water efficient dishwasher 6. Fixed leaking taps 97. Something else <specify> 98. None
Laundry 1. Bought a more water efficient washing machine
Demand Management Plan – Focus Group Outcomes Concepts of Change Page | 27
2. Started adjusting the water level to match load 3. Started to make sure washing machine is full 4. Started to recycle water from washing machine 5. Fixed leaking taps 97. Something else <specify> 98. None
Garden/ Outdoors 1. Started to turn off watering system when it rains 2. Reduced overall garden watering 3 Set retic times to shorter runs 4. Stopped garden watering altogether 5. Started to use a trigger nozzle 6. Started to mulch or compost 7. Installed a dripper system 8. Bought a tap timer 9. Started to use soil wetter 10. Replanted to have more waterwise plants 11. Bought a cover for the pool or spa 12. Installed a rainwater tank 13. Fixed dripping taps 14. Checked for leaks in pipes 15. Installed a grey water system 16. Started washing the car with buckets 97. Something else <specify> 98. None
Anything else?
Is there something you would like to do, but haven’t got around to? Explore how etc.
3.3 Volumes
Some areas similar to yours (name LGA) encourage people to use 160 litres per person per day?
o What do you think that means? How much is it? Can you picture it?
o How might you be able to picture it? Buckets, times of use, swimming pools etc open question, no answers given
3.4 Purple pipe
Do you have one?
What is it for?
3.5 Drought
What effects did this have on your water use?
Have you heard the term ‘drought proof’? What do you think it means?
Do you need to use less water in the wet months? Explore Are you supposed to make any changes to your use of water in the dry months? What? Do they mind a brown lawn? Or do they water their lawn during the region’s dryer months (Aug November) to keep it green? (if they have a lawn).
Demand Management Plan – Focus Group
Concepts of Change Page | 28
Outcomes
3.6
Water saving tips
If you wanted tips where would you go to? e.g. Council website, google
To what extent do people think that the water problem is ‘because the region’s growing?’
Discussion of a water saving program by Rous
3.7 Meters that tell you how much you are using all the time
Have you heard of them?
What do you think?
3.8 Source of water
Who do you think supplies your water? (check ‘Chat’) Where do you think the water comes from?
3.9 Read water meters
Would you be ok to give us your address so that xxx Council could read your water meter and give us the results?
Demand Management Plan – Focus Group Outcomes Concepts of Change Page | 29
