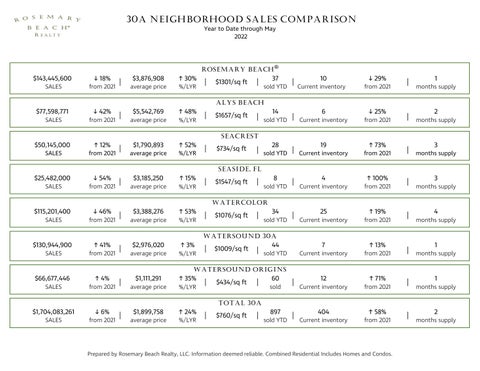
30A NEIGHBORHOOD SALES COMPARISON Year to Date through May 2022
$143,445,600
↓ 18%
SALES
from 2021
$77,598,771
↓ 42%
|
$3,876,908
↑ 30%
$5,542,769
↑ 48%
average price
%/LYR
ROSEMARY BEACH® |
$1301/sq ft
|
37
sold YTD
|
10
Current inventory
↓ 29%
from 2021
|
1
months supply
ALYS BEACH SALES
from 2021
$50,145,000
↑ 12%
|
average price
%/LYR
|
$1657/sq ft
|
14
sold YTD
6
|
Current inventory
|
Current inventory
↓ 25%
from 2021
2
|
months supply
|
months supply
SEACREST SALES
from 2021
|
$1,790,893
average price
↑ 52%
%/LYR
|
$734/sq ft
|
28
sold YTD
19
↑ 73%
from 2021
3
SEASIDE, FL $25,482,000 SALES
↓ 54%
from 2021
|
$3,185,250
average price
↑ 15% %/LYR
|
$1547/sq ft
|
8
|
34
|
sold YTD
4
Current inventory
↑ 100%
|
↑ 19%
|
from 2021
3
months supply
WATERCOLOR $115,201,400
↓ 46%
SALES
from 2021
$130,944,900
↑ 41%
|
$3,388,276
↑ 53%
average price
%/LYR
$2,976,020
↑ 3%
|
$1076/sq ft
|
sold YTD
25
Current inventory
from 2021
7
↑ 13%
4
months supply
WATERSOUND 30A SALES
from 2021
$66,677,446
↑ 4%
|
average price
%/LYR
$1,111,291
↑ 35%
|
$1009/sq ft
|
44
sold YTD
|
Current inventory
from 2021
12
↑ 71%
|
↑ 58%
|
1
months supply
WATERSOUND ORIGINS SALES
from 2021
$1,704,083,261
↓ 6%
|
average price
%/LYR
$1,899,758
↑ 24%
|
$434/sq ft
|
60
|
897
|
sold
Current inventory
from 2021
1
months supply
TOTAL 30A SALES
from 2021
|
average price
%/LYR
|
$760/sq ft
|
sold YTD
404
Current inventory
from 2021
Prepared by Rosemary Beach Realty, LLC. Information deemed reliable. Combined Residential Includes Homes and Condos.
2
months supply