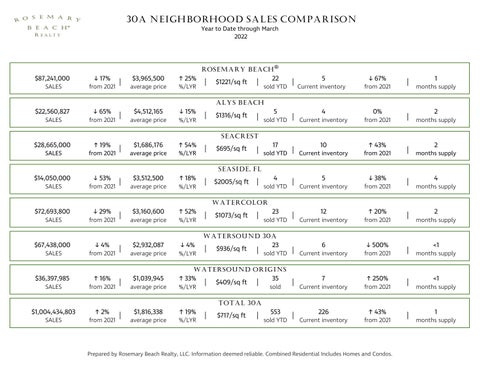
30A NEIGHBORHOOD SALES COMPARISON Year to Date through March 2022
$87,241,000
↓ 17%
SALES
from 2021
$22,560,827
↓ 65%
|
$3,965,500
↑ 25%
average price
%/LYR
$4,512,165
↓ 15%
ROSEMARY BEACH® |
$1221/sq ft
|
22
sold YTD
|
5
Current inventory
↓ 67%
from 2021
|
1
months supply
ALYS BEACH SALES
from 2021
$28,665,000
↑ 19%
|
average price
%/LYR
$1,686,176
↑ 54%
|
$1316/sq ft
|
5
sold YTD
4
|
Current inventory
|
Current inventory
0%
from 2021
2
|
months supply
|
months supply
SEACREST SALES
from 2021
|
average price
%/LYR
|
$695/sq ft
|
17
sold YTD
10
↑ 43%
from 2021
2
SEASIDE, FL $14,050,000 SALES
↓ 53%
from 2021
|
$3,512,500
average price
↑ 18% %/LYR
|
$2005/sq ft
|
4
|
23
|
sold YTD
5
Current inventory
↓ 38%
|
↑ 20%
|
from 2021
4
months supply
WATERCOLOR $72,693,800
↓ 29%
SALES
from 2021
$67,438,000
↓ 4%
|
$3,160,600
↑ 52%
average price
%/LYR
$2,932,087
↓ 4%
|
$1073/sq ft
|
sold YTD
12
Current inventory
from 2021
6
↓ 500%
2
months supply
WATERSOUND 30A SALES
from 2021
$36,397,985
↑ 16%
|
average price
%/LYR
$1,039,945
↑ 33%
|
$936/sq ft
|
23
sold YTD
|
|
Current inventory
from 2021
7
↑ 250%
|
↑ 43%
|
<1
months supply
WATERSOUND ORIGINS SALES
from 2021
$1,004,434,803
↑ 2%
|
average price
%/LYR
$1,816,338
↑ 19%
|
$409/sq ft
|
35
|
553
|
sold
Current inventory
from 2021
<1
months supply
TOTAL 30A SALES
from 2021
|
average price
%/LYR
|
$717/sq ft
|
sold YTD
226
Current inventory
from 2021
Prepared by Rosemary Beach Realty, LLC. Information deemed reliable. Combined Residential Includes Homes and Condos.
1
months supply