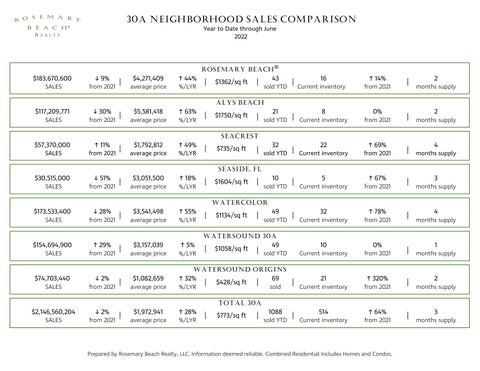
30A NEIGHBORHOOD SALES COMPARISON Year to Date through June 2022
ROSEMARY BEACH $183,670,600
↓ 9%
SALES
from 2021
$117,209,771
↓ 30%
|
$4,271,409
↑ 44%
$5,581,418
↑ 63%
average price
%/LYR
|
$1362/sq ft
|
®
43
sold YTD
|
16
Current inventory
↑ 14%
from 2021
|
2
months supply
ALYS BEACH SALES
from 2021
$57,370,000
↑ 11%
|
average price
%/LYR
$1,792,812
↑ 49%
|
$1750/sq ft
|
21
sold YTD
8
|
Current inventory
|
Current inventory
0%
from 2021
2
|
months supply
|
months supply
SEACREST SALES
from 2021
|
average price
%/LYR
|
$735/sq ft
|
32
sold YTD
22
↑ 69%
from 2021
4
SEASIDE, FL $30,515,000 SALES
↓ 51%
from 2021
|
$3,051,500
average price
↑ 18% %/LYR
|
$1604/sq ft
|
10
|
49
|
sold YTD
5
Current inventory
↑ 67%
|
↑ 78%
|
from 2021
3
months supply
WATERCOLOR $173,533,400
↓ 28%
SALES
from 2021
$154,694,900
↑ 29%
|
$3,541,498
↑ 55%
average price
%/LYR
$3,157,039
↑ 5%
|
$1134/sq ft
|
sold YTD
32
Current inventory
from 2021
10
0%
4
months supply
WATERSOUND 30A SALES
from 2021
$74,703,440
↓ 2%
|
average price
%/LYR
$1,082,659
↑ 32%
|
$1058/sq ft
|
49
sold YTD
|
Current inventory
from 2021
21
↑ 320%
|
↑ 64%
|
1
months supply
WATERSOUND ORIGINS SALES
from 2021
$2,146,560,204
↓ 2%
|
average price
%/LYR
$1,972,941
↑ 28%
|
$428/sq ft
|
69
|
1088
|
sold
Current inventory
from 2021
2
months supply
TOTAL 30A SALES
from 2021
|
average price
%/LYR
|
$773/sq ft
|
sold YTD
514
Current inventory
from 2021
Prepared by Rosemary Beach Realty, LLC. Information deemed reliable. Combined Residential Includes Homes and Condos.
3
months supply