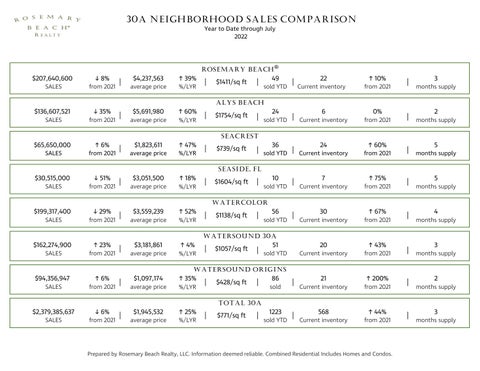
30A NEIGHBORHOOD SALES COMPARISON Year to Date through July 2022
$207,640,600
↓ 8%
SALES
from 2021
$136,607,521
↓ 35%
|
$4,237,563
↑ 39%
average price
%/LYR
$5,691,980
↑ 60%
ROSEMARY BEACH® |
$1411/sq ft
|
49
sold YTD
|
22
Current inventory
↑ 10%
from 2021
|
3
months supply
ALYS BEACH SALES
from 2021
$65,650,000
↑ 6%
|
average price
%/LYR
|
$1754/sq ft
|
24
sold YTD
6
|
Current inventory
|
Current inventory
0%
from 2021
2
|
months supply
|
months supply
SEACREST SALES
from 2021
|
$1,823,611
average price
↑ 47%
%/LYR
|
$739/sq ft
|
36
sold YTD
24
↑ 60%
from 2021
5
SEASIDE, FL $30,515,000 SALES
↓ 51%
from 2021
|
$3,051,500
average price
↑ 18% %/LYR
|
$1604/sq ft
|
10
|
56
|
sold YTD
7
Current inventory
↑ 75%
|
↑ 67%
|
from 2021
5
months supply
WATERCOLOR $199,317,400
↓ 29%
SALES
from 2021
$162,274,900
↑ 23%
|
$3,559,239
↑ 52%
average price
%/LYR
$3,181,861
↑ 4%
|
$1138/sq ft
|
sold YTD
30
Current inventory
from 2021
20
↑ 43%
4
months supply
WATERSOUND 30A SALES
from 2021
$94,356,947
↑ 6%
|
average price
%/LYR
$1,097,174
↑ 35%
|
$1057/sq ft
|
51
sold YTD
|
Current inventory
from 2021
21
↑ 200%
|
↑ 44%
|
3
months supply
WATERSOUND ORIGINS SALES
from 2021
$2,379,385,637
↓ 6%
|
average price
%/LYR
$1,945,532
↑ 25%
|
$428/sq ft
|
86
|
1223
|
sold
Current inventory
from 2021
2
months supply
TOTAL 30A SALES
from 2021
|
average price
%/LYR
|
$771/sq ft
|
sold YTD
568
Current inventory
from 2021
Prepared by Rosemary Beach Realty, LLC. Information deemed reliable. Combined Residential Includes Homes and Condos.
3
months supply