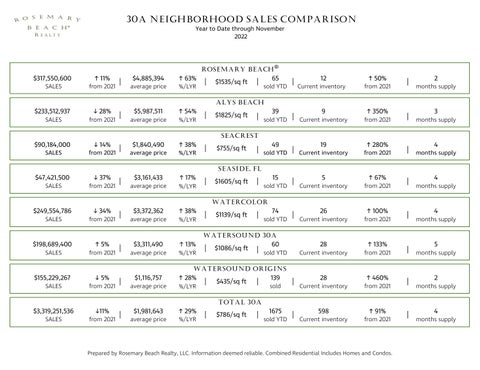
30A NEIGHBORHOOD SALES COMPARISON Year to Date through November 2022
$317,550,600
↑ 11%
SALES
from 2021
$233,512,937
↓ 28%
|
$4,885,394
↑ 63%
average price
%/LYR
$5,987,511
↑ 54%
ROSEMARY BEACH® |
$1535/sq ft
|
65
sold YTD
|
12
Current inventory
↑ 50%
from 2021
|
2
months supply
ALYS BEACH SALES
from 2021
$90,184,000
↓ 14%
|
average price
%/LYR
$1,840,490
↑ 38%
|
$1825/sq ft
|
39
sold YTD
9
|
Current inventory
|
Current inventory
↑ 350%
from 2021
3
|
months supply
|
months supply
SEACREST SALES
from 2021
|
average price
%/LYR
|
$755/sq ft
|
49
sold YTD
19
↑ 280%
from 2021
4
SEASIDE, FL $47,421,500 SALES
↓ 37%
from 2021
|
$3,161,433
average price
↑ 17% %/LYR
|
$1605/sq ft
|
15
|
74
|
sold YTD
5
Current inventory
↑ 67%
|
↑ 100%
|
from 2021
4
months supply
WATERCOLOR $249,554,786
↓ 34%
SALES
from 2021
$198,689,400
↑ 5%
|
$3,372,362
↑ 38%
average price
%/LYR
$3,311,490
↑ 13%
|
$1139/sq ft
|
sold YTD
26
Current inventory
from 2021
28
↑ 133%
4
months supply
WATERSOUND 30A SALES
from 2021
$155,229,267
↓ 5%
|
average price
%/LYR
$1,116,757
↑ 28%
|
$1086/sq ft
|
60
sold YTD
|
Current inventory
from 2021
28
↑ 460%
|
↑ 91%
|
5
months supply
WATERSOUND ORIGINS SALES
from 2021
$3,319,251,536
↓11%
|
average price
%/LYR
$1,981,643
↑ 29%
|
$435/sq ft
|
139
|
1675
|
sold
Current inventory
from 2021
2
months supply
TOTAL 30A SALES
from 2021
|
average price
%/LYR
|
$786/sq ft
|
sold YTD
598
Current inventory
from 2021
Prepared by Rosemary Beach Realty, LLC. Information deemed reliable. Combined Residential Includes Homes and Condos.
4
months supply