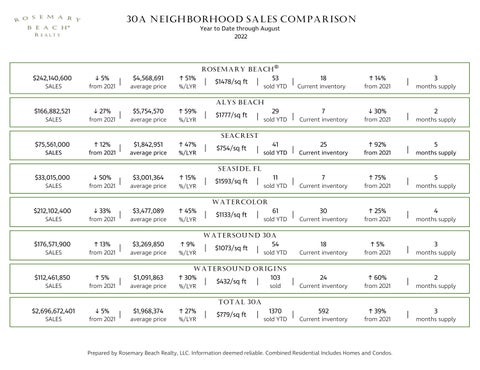
30A NEIGHBORHOOD SALES COMPARISON Year to Date through August 2022
ROSEMARY BEACH $242,140,600
↓ 5%
SALES
from 2021
$166,882,521
↓ 27%
|
$4,568,691
↑ 51%
average price
%/LYR
$5,754,570
↑ 59%
|
$1478/sq ft
|
®
53
sold YTD
|
18
Current inventory
↑ 14%
from 2021
|
3
months supply
ALYS BEACH SALES
from 2021
$75,561,000
↑ 12%
|
average price
%/LYR
$1,842,951
↑ 47%
|
$1777/sq ft
|
29
sold YTD
7
|
Current inventory
|
Current inventory
↓ 30%
from 2021
2
|
months supply
|
months supply
SEACREST SALES
from 2021
|
average price
%/LYR
|
$754/sq ft
|
41
sold YTD
25
↑ 92%
from 2021
5
SEASIDE, FL $33,015,000 SALES
↓ 50%
from 2021
|
$3,001,364
average price
↑ 15% %/LYR
|
$1593/sq ft
|
11
|
61
|
sold YTD
7
Current inventory
↑ 75%
|
↑ 25%
|
from 2021
5
months supply
WATERCOLOR $212,102,400
↓ 33%
SALES
from 2021
$176,571,900
↑ 13%
|
$3,477,089
↑ 45%
average price
%/LYR
$3,269,850
↑ 9%
|
$1133/sq ft
|
sold YTD
30
Current inventory
from 2021
18
↑ 5%
4
months supply
WATERSOUND 30A SALES
from 2021
$112,461,850
↑ 5%
|
average price
%/LYR
$1,091,863
↑ 30%
|
$1073/sq ft
|
54
sold YTD
|
Current inventory
from 2021
24
↑ 60%
|
↑ 39%
|
3
months supply
WATERSOUND ORIGINS SALES
from 2021
$2,696,672,401
↓ 5%
|
average price
%/LYR
|
$432/sq ft
|
103
|
1370
|
sold
Current inventory
from 2021
2
months supply
TOTAL 30A SALES
from 2021
|
$1,968,374
average price
↑ 27%
%/LYR
|
$779/sq ft
|
sold YTD
592
Current inventory
from 2021
Prepared by Rosemary Beach Realty, LLC. Information deemed reliable. Combined Residential Includes Homes and Condos.
3
months supply