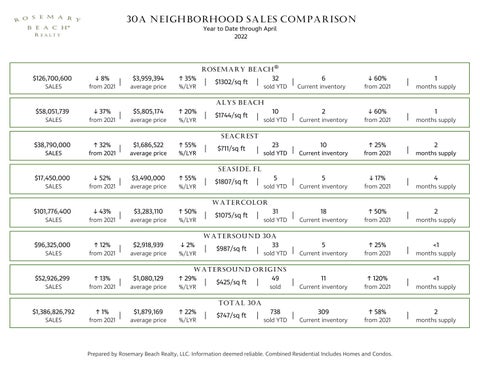
30A NEIGHBORHOOD SALES COMPARISON Year to Date through April 2022
ROSEMARY BEACH $126,700,600
↓ 8%
SALES
from 2021
$58,051,739
↓ 37%
|
$3,959,394
↑ 35%
average price
%/LYR
$5,805,174
↑ 20%
|
$1302/sq ft
|
®
32
sold YTD
|
6
Current inventory
↓ 60%
from 2021
|
1
months supply
ALYS BEACH SALES
from 2021
$38,790,000
↑ 32%
|
average price
%/LYR
|
$1744/sq ft
|
10
sold YTD
2
|
Current inventory
|
Current inventory
↓ 60%
from 2021
1
|
months supply
|
months supply
SEACREST SALES
from 2021
|
$1,686,522
average price
↑ 55%
%/LYR
|
$711/sq ft
|
23
sold YTD
10
↑ 25%
from 2021
2
SEASIDE, FL $17,450,000 SALES
↓ 52%
from 2021
|
$3,490,000
average price
↑ 55% %/LYR
|
$1807/sq ft
|
5
|
31
|
sold YTD
5
Current inventory
↓ 17%
|
↑ 50%
|
from 2021
4
months supply
WATERCOLOR $101,776,400
↓ 43%
SALES
from 2021
$96,325,000
↑ 12%
|
$3,283,110
average price
↑ 50% %/LYR
|
$1075/sq ft
|
sold YTD
18
Current inventory
from 2021
5
↑ 25%
2
months supply
WATERSOUND 30A SALES
from 2021
$52,926,299
↑ 13%
|
$2,918,939
↓ 2%
average price
%/LYR
$1,080,129
↑ 29%
|
$987/sq ft
|
33
sold YTD
|
|
Current inventory
from 2021
11
↑ 120%
|
↑ 58%
|
<1
months supply
WATERSOUND ORIGINS SALES
from 2021
$1,386,826,792
↑ 1%
|
average price
%/LYR
$1,879,169
↑ 22%
|
$425/sq ft
|
49
|
738
|
sold
Current inventory
from 2021
<1
months supply
TOTAL 30A SALES
from 2021
|
average price
%/LYR
|
$747/sq ft
|
sold YTD
309
Current inventory
from 2021
Prepared by Rosemary Beach Realty, LLC. Information deemed reliable. Combined Residential Includes Homes and Condos.
2
months supply