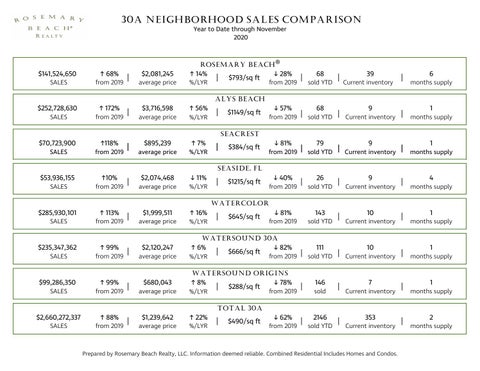
30A NEIGHBORHOOD SALES COMPARISON Year to Date through November 2020
$141,524,650
↑ 68%
SALES
from 2019
$252,728,630
↑ 172%
|
$2,081,245
ROSEMARY BEACH®
↑ 14%
average price
%/LYR
$3,716,598
↑ 56%
|
$793/sq ft
↓ 28%
from 2019
|
68
sold YTD
|
39
Current inventory
|
6
months supply
ALYS BEACH SALES
from 2019
$70,723,900
↑118%
|
average price
%/LYR
$895,239
↑ 7%
|
$1149/sq ft
↓ 57%
from 2019
|
68
sold YTD
|
9
Current inventory
|
1
months supply
SEACREST SALES
from 2019
|
average price
%/LYR
|
$384/sq ft
↓ 81%
from 2019
|
79
sold YTD
|
9
Current inventory
|
1
months supply
SEASIDE, FL $53,936,155
↑10%
SALES
from 2019
$285,930,101
↑ 113%
|
$2,074,468
↓ 11%
average price
%/LYR
$1,999,511
↑ 16%
|
$1215/sq ft
↓ 40%
from 2019
|
26
|
143
|
sold YTD
9
|
10
|
Current inventory
4
months supply
WATERCOLOR SALES
from 2019
|
average price
%/LYR
|
$645/sq ft
↓ 81%
from 2019
sold YTD
Current inventory
1
months supply
WATERSOUND 30A $235,347,362 SALES
↑ 99%
from 2019
|
$2,120,247
average price
↑ 6% %/LYR
|
$666/sq ft
↓ 82%
from 2019
|
111
sold YTD
|
10
Current inventory
|
1
months supply
WATERSOUND ORIGINS $99,286,350
↑ 99%
SALES
from 2019
$2,660,272,337
↑ 88%
|
$680,043
↑ 8%
average price
%/LYR
$1,239,642
↑ 22%
|
$288/sq ft
↓ 78%
|
↓ 62%
|
from 2019
146
|
2146
|
sold
7
|
353
|
Current inventory
1
months supply
TOTAL 30A SALES
from 2019
|
average price
%/LYR
|
$490/sq ft
from 2019
sold YTD
Current inventory
Prepared by Rosemary Beach Realty, LLC. Information deemed reliable. Combined Residential Includes Homes and Condos.
2
months supply