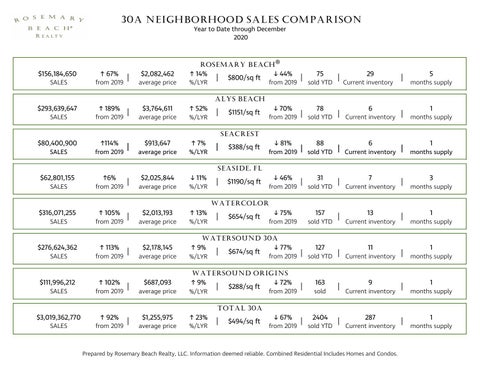
30A NEIGHBORHOOD SALES COMPARISON Year to Date through December 2020
ROSEMARY BEACH $156,184,650
↑ 67%
SALES
from 2019
$293,639,647
↑ 189%
|
$2,082,462
↑ 14%
average price
%/LYR
$3,764,611
↑ 52%
|
$800/sq ft
®
↓ 44%
from 2019
|
75
sold YTD
|
29
Current inventory
|
5
months supply
ALYS BEACH SALES
from 2019
$80,400,900
↑114%
|
average price
%/LYR
$913,647
↑ 7%
|
$1151/sq ft
↓ 70%
from 2019
|
78
sold YTD
|
6
Current inventory
|
1
months supply
SEACREST SALES
from 2019
|
average price
%/LYR
|
$388/sq ft
↓ 81%
from 2019
|
88
sold YTD
|
6
Current inventory
|
1
months supply
SEASIDE, FL $62,801,155
↑6%
SALES
from 2019
$316,071,255
↑ 105%
|
$2,025,844
↓ 11%
average price
%/LYR
$2,013,193
↑ 13%
|
$1190/sq ft
↓ 46%
from 2019
|
31
|
157
|
sold YTD
7
|
13
|
Current inventory
3
months supply
WATERCOLOR SALES
from 2019
|
average price
%/LYR
|
$654/sq ft
↓ 75%
from 2019
sold YTD
Current inventory
1
months supply
WATERSOUND 30A $276,624,362 SALES
↑ 113%
from 2019
|
$2,178,145
average price
↑ 9% %/LYR
|
$674/sq ft
↓ 77%
from 2019
|
127
sold YTD
|
11
Current inventory
|
1
months supply
WATERSOUND ORIGINS $111,996,212
↑ 102%
SALES
from 2019
$3,019,362,770
↑ 92%
|
$687,093
↑ 9%
average price
%/LYR
$1,255,975
↑ 23%
|
$288/sq ft
↓ 72%
|
↓ 67%
|
from 2019
163
|
2404
|
sold
9
|
287
|
Current inventory
1
months supply
TOTAL 30A SALES
from 2019
|
average price
%/LYR
|
$494/sq ft
from 2019
sold YTD
Current inventory
Prepared by Rosemary Beach Realty, LLC. Information deemed reliable. Combined Residential Includes Homes and Condos.
1
months supply