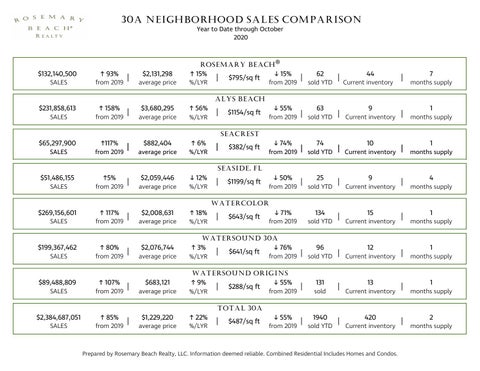
30A NEIGHBORHOOD SALES COMPARISON Year to Date through October 2020
$132,140,500
↑ 93%
SALES
from 2019
$231,858,613
↑ 158%
|
$2,131,298
ROSEMARY BEACH®
↑ 15%
average price
%/LYR
$3,680,295
↑ 56%
|
$795/sq ft
↓ 15%
from 2019
|
62
sold YTD
|
44
Current inventory
|
7
months supply
ALYS BEACH SALES
from 2019
$65,297,900
↑117%
|
average price
%/LYR
$882,404
↑ 6%
|
$1154/sq ft
↓ 55%
from 2019
|
63
sold YTD
|
9
Current inventory
|
1
months supply
SEACREST SALES
from 2019
|
average price
%/LYR
|
$382/sq ft
↓ 74%
from 2019
|
74
sold YTD
|
10
Current inventory
|
1
months supply
SEASIDE, FL $51,486,155
↑5%
SALES
from 2019
$269,156,601
↑ 117%
|
$2,059,446
↓ 12%
average price
%/LYR
$2,008,631
↑ 18%
|
$1199/sq ft
↓ 50%
from 2019
|
25
|
134
|
sold YTD
9
|
15
|
Current inventory
4
months supply
WATERCOLOR SALES
from 2019
|
average price
%/LYR
|
$643/sq ft
↓ 71%
from 2019
sold YTD
Current inventory
1
months supply
WATERSOUND 30A $199,367,462 SALES
↑ 80%
from 2019
|
$2,076,744
average price
↑ 3% %/LYR
|
$641/sq ft
↓ 76%
from 2019
|
96
sold YTD
|
12
Current inventory
|
1
months supply
WATERSOUND ORIGINS $89,488,809
↑ 107%
SALES
from 2019
$2,384,687,051
↑ 85%
|
$683,121
↑ 9%
average price
%/LYR
$1,229,220
↑ 22%
|
$288/sq ft
↓ 55%
|
↓ 55%
|
from 2019
131
|
1940
|
sold
13
|
420
|
Current inventory
1
months supply
TOTAL 30A SALES
from 2019
|
average price
%/LYR
|
$487/sq ft
from 2019
sold YTD
Current inventory
Prepared by Rosemary Beach Realty, LLC. Information deemed reliable. Combined Residential Includes Homes and Condos.
2
months supply