
Re-Assessing San Francisco’s Government Design Is City Hall Well-Structured to Meet the Current Crisis? Nicolas Heidorn, Kenneth P. Miller, and Bipasa Nadon The Rose Institute of State and Local Government Commissioned by TogetherSF AUGUST 2023

2
TABLE OF CONTENTS EXECUTIVE SUMMARY 4 INTRODUCTION 6 METHODOLOGY 6 SAN FRANCISCO’S CRISIS 7 SAN FRANCISCO’S GOVERNMENT DESIGN 11 Overview 11 Electoral System: Board of Supervisors 12 Mayor’s Powers 18 Commission System 20 Ballot Measures 21 ASSESSMENT OF CURRENT DESIGN 25 Overview 25 Electoral System: Bo ard of Supervisors 26 Mayor’s Powers 26 Commission System 28 Ballot Measures 29 OPTIONS FOR REFORM 32 Overview 32 Electoral System: Board of Supervisors 33 Mayor’s Powers 60 Commission System 61 Ballot Measures 62 SUMMARY & CONCLUSIONS 64 3
EXECUTIVE SUMMARY
San Francisco faces significant challenges, including a shortage of affordable housing, chronic homelessness, concerns about public safety, and the recent collapse of the Downtown area that is vital to the City’s economy and revenues. In combination, these problems have created a crisis that requires a sustained, effective response by City Hall. According to polls, most San Franciscans believe their government hasn’t met this test. This report suggests that San Francisco’s government structure hinders City Hall’s ability to address this crisis, and that modifying the design might better position the City to meet its current and future challenges.
TogetherSF, a non-partisan, community-based organization devoted to creating a better San Francisco, has commissioned this study to determine whether elements of the City’s governance system are impairing City Hall’s ability to address these challenges, and whether changes to that system might help it work more effectively. The report was prepared by the Rose Institute of State and Local Government at Claremont McKenna College, an academic research institute that focuses on the study of state and local governments in California. The report is based on an analysis of San Francisco’s current charter (Charter of 1996, as amended), prior charters and charter reform efforts, electoral and governance systems in San Francisco and comparison cities, social science research comparing these systems, and data related to challenges presently facing the City. The authors also conducted in-depth interviews of approximately 30 San Francisco leaders, including current and former elected officials, current and former appointed officials, and other civic leaders.
The report concludes that any reforms should prioritize the needs of the City as a whole, while respecting the City’s diversity, and enable City Hall to act decisively. The report focuses on a few critical features of the City’s current government design that could be modified to better attain these ends, namely: the mode of election of the Board of Supervisors; the powers of the Mayor; the structure of the City’s expansive commission system; and the operation of the City’s ballot measure system. The report describes the development and current operation of each of these elements of San Francisco government; assesses their strengths and weaknesses; presents possible options for reform; and discusses which reforms San Franciscans should most seriously consider.
Board of Supervisors Elections
San Francisco presently selects its 11-member Board of Supervisors through district elections, with each Supervisor representing a different part of the City. The elections are held using a voting method called Ranked Choice Voting (RCV), which uses a ranked ballot to elect a majority winner. Over the past fifty years, the City has alternated back-and-forth between electing Supervisors “by district” or from the City “at-large.”
In this report, we examine the three main types of election systems used to elect local legislative bodies in the U.S. — at large, by district, and mixed at-large and by district systems — as well as one alternative voting system, Proportional Ranked Choice Voting (PRCV), which is the multi-seat version of RCV.
The report evaluates how these systems differ in terms of their effects on policy incentives, Board demographics, and campaigns. The report emphasizes that any system of representative elections involves trade-offs, and analyzes the nature of those trade-offs. In part, the report notes, district-based systems prioritize representation of neighborhoods and communities, while at-large systems prioritize citywide needs. San Franciscans have long struggled to balance those competing values. As a way to achieve greater balance between local representation and citywide perspective, the report recommends San Francisco consider adopting a mixed system for electing the Board of Supervisors whereby some Supervisors would be elected from districts and others at large.
The at-large seats in a mixed system could be elected using either plurality voting or PRCV; the report examines both options. A plurality at-large system would likely elect Supervisors to the Board who have a more citywide perspective and are more responsive to majority viewpoints than a PRCV system; however, a PRCV system is likely to elect Supervisors who are more ideologically and demographically representative of the electorate than a plurality at-large system, and for that reason may face less risk of legal challenge.
4
Mayor’s Powers
San Francisco is a “strong mayor” city, which means that the Mayor acts as the City’s chief executive officer. The strong mayor system can be contrasted with the “city manager” or “council-manager” form of government. Although San Francisco is categorized as a strong mayor city, it is perhaps more accurately described as having a “partial” or “quasi” strong mayor system, because it has limited the mayor’s powers in various ways over time.
San Francisco’s 1996 Charter was designed to invest power in the Mayor, but subsequent Charter amendments have reduced the Mayor’s capacity to govern. Today, the Charter blurs executive authority in City Hall by limiting the Mayor’s power to appoint and remove members of commissions, by giving the Board of Supervisors appointing authority, and by granting commissions significant control over many city departments. The Charter also limits the Mayor’s capacity to manage city government by placing constraints on mayoral hiring.
The report suggests that the City consider reforms that would strengthen the office, including increasing the Mayor’s power to appoint and remove commissioners and department heads and expanding the Mayor’s hiring authority.
Commission System
As part of its governance design, San Francisco has developed an elaborate commission system. At last count, San Francisco has 130 boards, commissions, and advisory bodies created by the Charter, city ordinance, or California statute. Of these, 55 (including the Board of Supervisors) have decision-making authority; the remaining 75 boards, commissions, and task forces serve advisory functions.1 The power of appointment and removal of commissioners varies by commission but tends to be divided between the Mayor and the Board of Supervisors. The report describes the system’s benefits and problems. It concludes that while commissions provide value by allowing for public participation, the City now has too many commissions with too much independent authority. As currently constituted, the commission system can impede efficient public administration and blur the lines of political accountability for government action or inaction.
The report suggests that the City consider a thorough review of the commission system and that the review should contemplate reducing the total number of commissions; assessing their proper functions; combining commissions with overlapping jurisdictions; standardizing, where possible, rules for selection
and removal of commissioners; and rebalancing the power of the Mayor and Board to appoint and remove commissioners.
Ballot Measures
Direct democracy is an essential feature of San Francisco government, but the City’s permissive rules for placing measures raises concerns that the process is overused, creating overlong ballots and, more critically, too many mandates and prohibitions on city government that can only be amended by further ballot measures. The report suggests that the City consider modifying the ballot measure system by raising the signature threshold for citizen-initiated measures to be more in line with peer jurisdictions; eliminating the power of a minority of Supervisors to place measures on the ballot; eliminating the Mayor’s power to place measures on the ballot; giving the Mayor the power to veto Board-proposed ballot measures; and granting the Board and the Mayor limited power to amend measures after they are enacted by voters.
Would these reforms make a difference?
Although no institutional reform by itself can solve all of San Francisco’s problems, we believe carefully crafted reforms along the lines presented in this report could help the City better address its current crisis and future challenges. •
 1 David Chiu, List of City Boards, Commissions, and Advisory Bodies Created by Charter, Ordinance, or Statute. (San Francisco: Office of the City Attorney, last updated October 24, 2022), https://www.sfcityattorney.org/good-government/list-of-commissions-boards/.
EXECUTIVE SUMMARY 5
San Francisco is a world-class city in crisis.
By any account, San Francisco is one of the world’s great cities. Throughout its history, it has been a catalyst of new cultural, economic, and political ideas. Together with neighboring Silicon Valley, it has become the capital of the global technology industry. Its knowledge-based economy is highly productive. Its residents are talented, educated, and civically engaged. And its many attractions draw visitors from across the country and around the world.
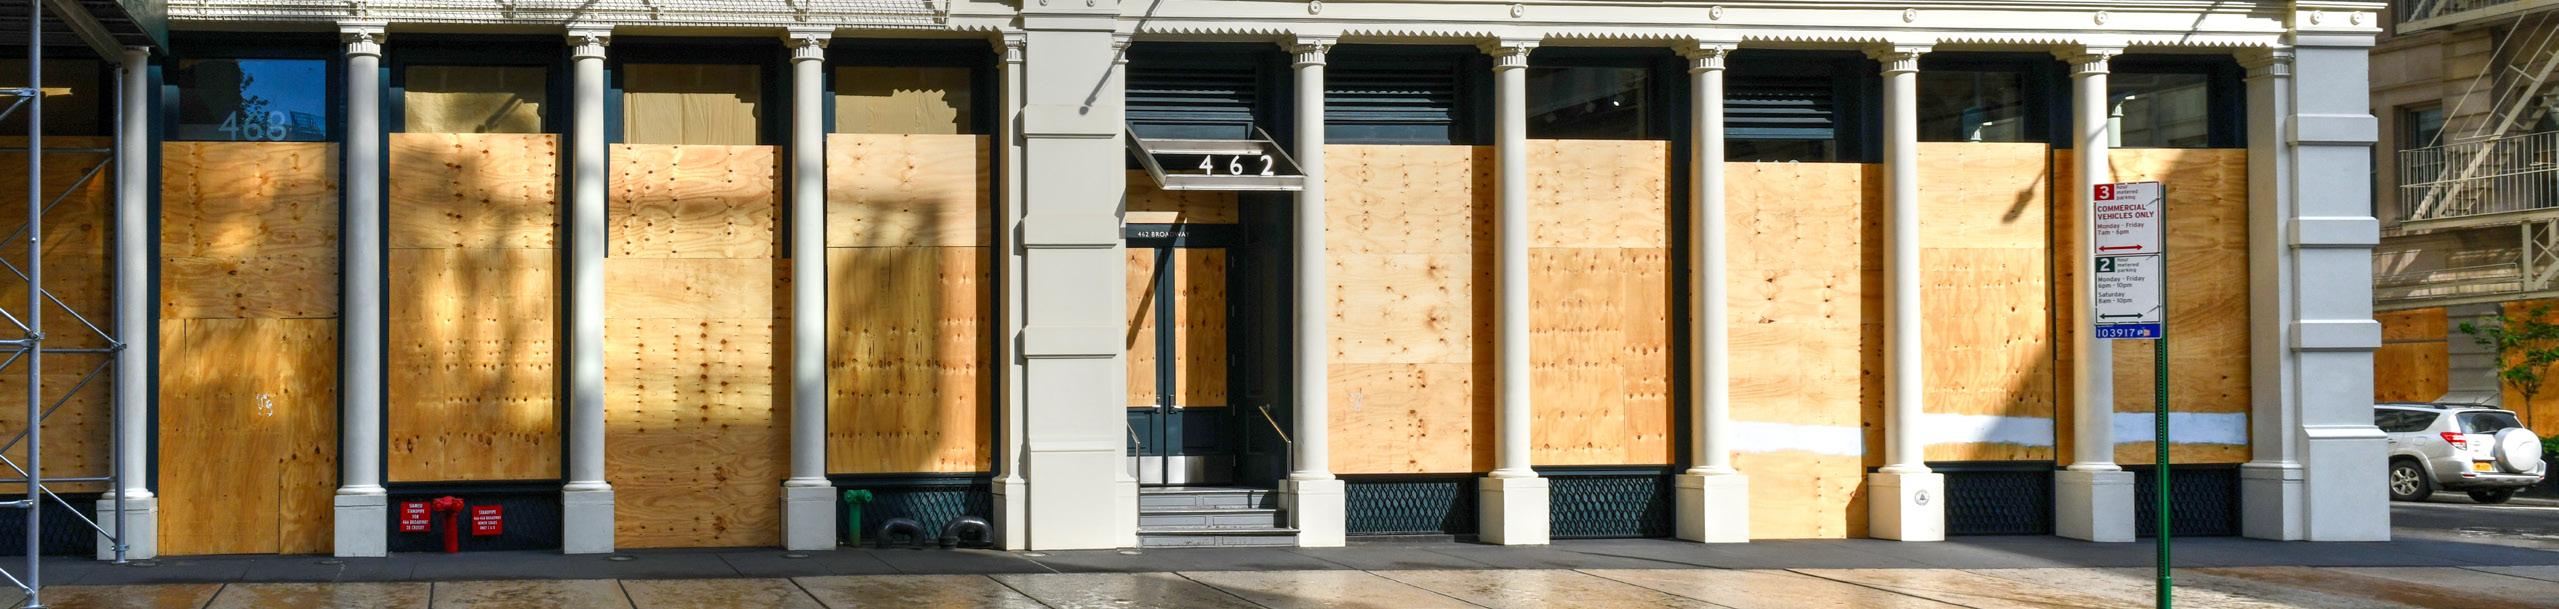
Yet, today San Francisco is beset with problems. Its challenges include exorbitant housing costs, high costs of doing business, shuttered storefronts, chronic unsheltered homelessness, rising property crime, and a growing perception that the City is unsafe. These problems have been greatly compounded by a slow recovery from the COVID-19 pandemic and the shift to remote work and online shopping, which have hollowed out Downtown, the heart of the City’s economic model and the greatest source of its revenue. For much of the 21st century, San Francisco’s flourishing economy, led by the technology sector, made the City a magnet for new residents and enterprises. In recent years, however, the City has seen people and businesses exit in large numbers. Many San Franciscans have come to believe their city is in crisis.
To meet these profound challenges and maintain its world-class status, San Francisco desperately needs effective government. Many San Franciscans believe City Hall is failing this test. Some might want to solely blame individual officeholders or political factions for government’s failures. On closer examination, however, it is clear that the structure of government has contributed to the struggle to address the City’s problems.
TogetherSF, a non-partisan, community-based organization devoted to creating a
better San Francisco, has commissioned this study to determine whether elements of the City’s current governance system are impairing City Hall’s performance, and whether changes to that system might help it work more effectively.
San Francisco has altered city government many times to help it address changing needs. This report concludes that the time is right for another reassessment. •
This report is based on an analysis of San Francisco’s current Charter (Charter of 1996, as amended), prior Charters and charter reform efforts, electoral and governance systems in San Francisco and comparison cities, social science research comparing these systems, and data related to challenges presently facing the City. The report also draws on in-depth interviews of approximately 30 San Francisco leaders, including current and former elected city officials, current and former city staff, and other civic leaders. Because the report contemplates potential changes to the powers of the Mayor and the Board of Supervisors, we believed it was important to maintain arms-length distance from the officials currently occupying those offices. Accordingly, neither the current Mayor, nor current Supervisors, nor anyone working in their offices was interviewed for this report. All interviews were conducted on a confidential basis to encourage candid responses. •
INTRODUCTION
I
METHODOLOGY
II
6
San Francisco faces several daunting, interrelated challenges, including:
• Housing affordability
• Homelessness
• Public safety
• Collapse of Downtown
These challenges affect different areas of the City in different ways, but together they form a crisis that threatens the City as a whole.
Overview
For years, San Francisco has struggled with problems that many other large American cities face—including a lack of affordable housing, persistent unsheltered homelessness, and crime. In some ways, however, these challenges have been more acute in San Francisco than elsewhere. The City’s inability to solve these problems has been vexing given its reputation for innovation and astounding success as a leader of the global technology industry.
San Francisco’s difficulties have deepened in recent years as little new housing has been permitted, homeless encampments have spread, property crimes have spiked, and the streets have felt increasingly unsafe. By themselves, these problems are serious, but they have been greatly compounded by the shocking collapse of the City’s Downtown—the Financial District and surrounding commercial areas. For years, Downtown
has been the engine that generates most of the City’s jobs, income, wealth, and tax revenues. But the COVID-19 pandemic exposed the vulnerability of Downtown’s economic model: it was overly dependent on the daily presence of high-end office workers. During the pandemic, most of those workers learned to do their jobs remotely, and many have decided not to return to their offices. The resultant hollowing out of Downtown will have long term negative consequences for the City’s economic well-being and its local tax revenues; mitigating that harm will require creative solutions of the highest order.
These problems—old and new—cause many San Franciscans to despair for their city. This section summarizes the nature of the crisis by focusing on four major areas of concern: housing affordability, homelessness, public safety, and the collapse of Downtown.
SAN FRANCISCO’S CRISIS III
7
Housing Affordability
San Franciscans looking for housing are forced to pay some of the highest prices in the nation. According to the Zillow Home Values Index, San Francisco’s median home value as of June 2023 is $1.27 million—higher than any major U.S. city except San José and well beyond the reach of middle and working class families.2 San Francisco also has the highest median rent of any major U.S. city. As of 2019, 37% of San Francisco residents were “rent-burdened,” meaning they spent more than 30% of their income on their rent. Nineteen percent were “severely rent burdened,” meaning rent swallowed up more than 50 percent of their incomes.3 These rent-burden numbers do not stand out when compared to California as a whole, largely due to the abundance of high-income earners in San Francisco. But low- and middle-income residents of the City must either spend a large portion of their income on housing or look to move elsewhere.
A major reason for the City’s exorbitant housing prices is the lack of new home construction. While state officials have enacted numerous policies to remove barriers to housing development, San Francisco has dragged its feet. The state says San Francisco needs to build 82,000 new units by 2030, but the City is unlikely to come close to that target. Between 2015 and 2021, San Francisco issued on average only about 3,500 permits annually and the rate of new construction has slowed. According to the San Francisco Planning Department’s annual housing inventory, housing production in the City decreased in 2022 by 46% from the prior year—from 4,193 units in 2021 to 2,257 units in 2022. New home construction in 2022 was 28% below the 10-year average.4
Providing affordable housing in San Francisco should be a priority for its own sake, but also due to its downstream effects. High housing costs force many middle- and low-income residents out of the City, and contribute to homelessness, because low-income, at-risk people are more likely to keep a roof over their head if affordable housing is abundant.
2 Zillow Home Values Index, “San Francisco Home Values,” n.d., accessed June 5, 2023. https://www.zillow.com/home-values/20330/san-francisco-ca/
3 Bay Area Equity Atlas, “Housing Burden: San Francisco County, CA vs. California,” citing U.S. Census Bureau American Community Survey data, n.d., accessed April 16, 2023, https://bayareaequityatlas.org/indicators/housingburden#/?geo=04000000000006075&houseburd01=2
4 J. K. Dineen, “S.F. housing production slows to a crawl as state goals loom,” San Francisco Chronicle, April 3, 2023, https://www.sfchronicle.com/bayarea/ article/san-francisco-housing-production-slows-crawl-17875749.php; Adriana Rezal and Erin Caughey, “SFNext Index: Key facts about housing in San Francisco,” San Francisco Chronicle, June 29, 2022, https://www. sfchronicle.com/projects/2022/fixing-san-francisco-problems/Housing
THE STATE SAYS SAN FRANCISCO NEEDS TO BUILD 82,000 NEW UNITS BY 2030, BUT THE CITY IS UNLIKELY TO COME CLOSE TO THAT TARGET. BETWEEN 2015 AND 2021, SAN FRANCISCO ISSUED ON AVERAGE ONLY ABOUT 3,500 PERMITS ANNUALLY AND THE RATE OF NEW CONSTRUCTION HAS SLOWED.
 III.
III.
SAN FRANCISCO’S CRISIS
8
Homelessness
San Francisco has sought to solve the problem of homelessness for decades with little success. The most recent biennial “Point in Time” (PIT) count published by the U.S. Department of Housing and Urban Development reported that the City’s homeless population on a single day in 2022 was 7,754, down 3.5 percent from 8,035 in 2019. Of these, 4,397 (or 57%) were unsheltered.5 Estimates based on other sources (such as the City’s case management data) place the number significantly higher—19,000 or more. The higher estimates include people who move in and out of homelessness.6 According to HUD’s more conservative PIT count, San Francisco has the ninth largest homeless population of any U.S. city. On a per capita basis, homelessness in San Francisco is more prevalent than in New York City or Los Angeles. San Francisco also has the seventh largest unsheltered homeless population of any U.S. city.
Considering the amount of public money and attention San Francisco has devoted to the problem of homelessness, its struggle to make meaningful headway is one of city government’s most conspicuous sources of frustration. In addition to being a crisis for unhoused people, homelessness makes the City a less attractive option for tourism, conventions, business investment, and everyday living.
Public Safety
Although San Francisco has a lower than average violent crime rate compared to other major U.S. cities, it is plagued by a high rate of property crimes, such as burglary, theft, and motor vehicle theft. In 2019, San Francisco ranked number one in the nation among major cities for property crime; in 2020, it ranked third. Notably, in the midst of these high property crime rates, the City has seen a significant change in police activity. For example, total arrests fell by roughly half from pre-pandemic levels for the first two quarters of 2022, before rebounding to about three-fourths of pre-pandemic levels in the third quarter of 2022. Stops and searches have fallen even more dramatically, by about 80% since before the pandemic. Clearance rates for property crimes fell almost 40% from 2010
to 2020. Meanwhile, the District Attorney’s office has seen its prosecutions drop 25% from pre-pandemic levels.7
While the City’s overall crime rate has not increased significantly in recent years, the combination of a high base-rate of property crimes and sharp declines in stops, searches, arrests, and prosecutions has led to negative public sentiment toward the police. A 2022 survey that asked San Francisco residents their views on the police found that 40% thought the SFPD was doing a poor or very poor job of improving quality of life in the city, while another 41% said the police were doing a fair job.8
Many San Franciscans believe that the City’s comparatively lax criminal justice system has contributed to the “culture of lawlessness” perhaps best represented by the open-air drug markets that seem to flourish undisturbed in the Tenderloin. Perceptions of permissive attitudes towards crime have also diminished San Francisco’s appeal as a site for business investment.
Collapse of Downtown
The challenges of housing affordability, homelessness, and crime are serious, but they are not new. The new and potentially greater threat to the City is the collapse of Downtown. The crash of the Financial District and surrounding commercial areas came quickly after the outbreak of COVID-19. Before the pandemic, Downtown San Francisco was thriving. Each weekday, about 245,000 people came to work in offices of the area’s tech companies, professional firms, and other businesses. This multitude of office workers generated wealth for their firms and supported a dense network of local businesses. Economists estimate that each office worker in Downtown San Francisco spent, on average, $168 per week in shops, restaurants, and other establishments near their workplace. All told, Downtown generated enormous economic output—and, consequently, contributed an outsized share of the City’s revenues.9
The shock of the pandemic, however, destroyed Downtown’s economic model. The long COVID shutdown caused the quarter-million Downtown office workforce to stay home, and most of them adapted to remote work. Many came to believe that their jobs could be performed just as well at home. Critically, when the pandemic subsided, many of them did not return to
5 San Francisco Department of Homelessness and Supportive Housing, San Francisco Homeless Count and Survey: 2022 Comprehensive Report, 2022, 21-26, https://hsh. sfgov.org/about/research-and-reports/pit-hic/#2022-pit
6 Yoohyun Jung and Mallory Moench, “How many people are homeless in San Francisco? Here’s what the data shows,” San Francisco Chronicle, May 16, 2022, https:// www.sfchronicle.com/sf/article/How-many-people-are-homeless-in-San-Francisco-17155544.php
7 Adriana Rezal and Erin Caughey, “SFNext Index: Key facts about crime in San Francisco,” San Francisco Chronicle, November 5, 2022, https://www.sfchronicle.com/ projects/2022/fixing-san-francisco-problems/crime
8 Rezal and Caughey, “Key facts about crime.”
9 Fred Brousseau, Memorandum to Supervisor Connie Chan regarding Options for Addressing Economic and Tax Revenue Trends in Downtown San Francisco (San Francisco: Board of Supervisors Budget and Legislative Analyst, February 24, 2023), 3, 17-18, https://sfbos.org/sites/default/files/BLA.DowntownSF.Economy%20Tax.022423. pdf
III. SAN FRANCISCO’S CRISIS 9
their offices. The shift to remote work is a global phenomenon, but it is especially pronounced in San Francisco.
Some grim statistics capture the effects of remote work on Downtown. Whereas economists estimate that about 245,000 came to work in offices Downtown each weekday in the third quarter of 2019, fewer than 100,000 did so in January 2023—that is, as of January of this year, San Francisco’s Downtown office workforce was only about 40 percent what it was before the pandemic.10 In a study titled “The Death of Downtown?,” researchers at U.C. Berkeley’s Institute of Governmental Studies and at the University of Toronto studied the workforces and downtown activity of 62 cities in North America in November 2019 and November 2022. In 2019, of all 62 cities in the study, San Francisco’s Downtown had the highest percentage of workers in the professional, scientific, and management sectors—workers who were best positioned to shift to on-line work. And, three years later, San Francisco had the lowest rate of recovery of downtown activity of any of the cities in the study—31 percent of its prepandemic level.11
The hollowing out of San Francisco’s Downtown has a host of negative effects. Office vacancies have spiked, commercial real estate values have plummeted, businesses dependent on office worker patrons have closed; BART and MUNI ridership has declined—and, importantly for this analysis, the flow of revenues from Downtown to the city treasury—in the form of property, sales, business, and hotel taxes—has dwindled.12
Of course, Downtown may recover more of its pre-pandemic office workforce, but many experts are doubtful, concluding that a large share of office workers have decided to keep
10 Brousseau, Memorandum, 3, 17-18.
working remotely.13 If so, the City faces a massive challenge in creating a new economic model to replace the robust pre-pandemic Downtown.
Public Pessimism
San Franciscans are pessimistic about the future of their city, with more than three-quarters of voters saying the City is headed down the “wrong track.”14 In recent surveys, voters cite housing affordability, homelessness, and crime as some of the most vexing problems facing the City.15
Many San Franciscans have concluded these problems outweigh the City’s attractions, and they are packing their bags. The U.S. Census Bureau estimates that between April 1, 2020 and July 1, 2022, San Francisco’s population fell from 873,959 to 808,437—a net loss of more than 65,000 residents, or 7.5% of the City’s population in just two years. Most of that decrease came in 2020-2021, when the City lost an estimated 62,706 residents, or 7.2% of its population. The decline was steeper in San Francisco than in comparison cities such as New York, which lost 3.8% of its population in that pandemic year, Boston 3.2%, San José 3.1%, and Los Angeles 1.1%.16
In surveying these problems, one might say that many of them— such as homelessness, crime, or empty offices—threaten some parts of the City more than others. On reflection, however, one can see that the current crisis threatens the wellbeing of the entire City and all San Franciscans. To respond to this crisis, the City’s government needs to maintain this awareness and focus on the good of the whole. •
11 Karen Chapple, Hannah Moore, Michael Leong, Daniel Huang, Amir Forohar, Laura Schmahmann, Joy Wang, and Jeff Allen. Research Brief: The Death of Downtown?: Pandemic Recovery Trajectories across 62 North American Cities. (Toronto: School of Cities, University of Toronto and Berkeley: Institute of Governmental Studies, University of California at Berkeley, June 2022, updated January 2023): 1-7, https://escholarship.org/uc/item/9sj175mr
12 Brousseau, Memorandum, 17-37; Kevin Truong, “Downtown San Francisco Vacancies Hit Record High as City Nears Breaking Point,” San Francisco Standard, April 5, 2023. https://sfstandard.com/business/downtown-san-francisco-vacancies-hit-record-high-as-city-nears-breaking-point/?utm_source=email_sitebutton
13 Barrero, Jose Maria, Nicolas Bloom, and Steven J. Davis. “Why Working from Home Will Stick,” NBER Working Paper No. 28731, April 2021, https://www.nber.org/ papers/w28731
14 San Francisco Chamber of Commerce, 2022 Dignity Health CityBeat Poll Results (May 16, 2022), https://sfchamber.com/2022-dignity-health-citybeat-poll-results/
See also Noah Arroyo, “How fed up are San Franciscans with the city’s problems?” San Francisco Chronicle, September 13, 2022, https://www.sfchronicle.com/bayarea/ article/sfnext-poll-sentiment-17435794.php (65% of residents say the city is worse than when they arrived, and 70% say the City’s problems are only slightly likely or not likely to improve).
15 Arroyo, “How fed up?”
16 U.S. Census Bureau, “Census Quickfacts: San Francisco County, California; New York city, New York; Boston city, Massachusetts; San José city, California; Los Angeles city, California,” n.d., accessed April 12, 2023, https://www.census.gov/quickfacts/.
10
III. SAN FRANCISCO’S CRISIS
SAN FRANCISCO’S GOVERNMENT DESIGN IV
• San Francisco has a unique, complex government design
• It is the only consolidated city and county in California
• It has its own charter, which enables it to design (and redesign) its form of government
• It has an 11-member Board of Supervisors, which performs functions of both a city council and a county board of supervisors
• The Supervisors are elected to four-year terms from single-member districts using a Ranked Choice Voting (RCV) electoral system
Overview
This report asks whether San Francisco’s government is well-structured to meet the extraordinary challenges the City faces. To explore that question, we begin by surveying the City’s unique and complex government design, including its origins and changes over time. This section begins with a brief history of the City’s Charter, then examines more closely the history of its mode of supervisorial elections and its governance system, and compares them with other peer jurisdictions.
The central features of San Francisco government were established in the mid-nineteenth century. In February 1850, the newly-formed California Legislature established the County of San Francisco and two months later incorporated the City of San Francisco. Initially, the two jurisdictions were distinct, but in 1856, the Legislature merged them to create a single entity, the City and County of San Francisco.17 San Francisco became the only consolidated city and county in California, and remains so today.
San Francisco was initially incorporated as a charter city and, subsequently, was made a charter city and county.18 San Francisco’s charter status gives it more flexibility than general law cities to establish its own institutional design, procedures, and policies. San Francisco’s Charter operates like a constitution, but unlike the U.S. Constitution, the Charter is
• The City has a “strong mayor” form of government, rather than a council-manager form, which means the Mayor is expected to act as the City’s chief executive officer
• However, the Mayor’s powers are constrained in various ways
• The City has established a large number of citizen commissions, which exert considerable influence within the system
• San Francisco also has the most prolific ballot measure system of any city in California
readily malleable — relatively easy to amend and even replace. After San Francisco’s first home-rule Charter took effect in 1900, voters enacted two new charters: one in 1931 (which took effect in 1932) and another in 1995 (which took effect in 1996). Moreover, San Francisco voters have approved hundreds of charter amendments over time.
These modifications have, among other things, reduced the number of Supervisors, changed the mode of supervisorial elections (multiple times), and shifted power back and forth between the Mayor, the Board of Supervisors, citizen commissions, and non-elected professional administrators — all with the goal of adapting City Hall to meet San Francisco’s changing needs. San Francisco’s governance system has features fairly typical of other large cities, such as its by district election system and strong mayor form of government. However, the City departs significantly from its peers in other ways, including its use of Ranked Choice Voting (RCV) to elect Supervisors, the number and powers assigned to its volunteer commissions, and the ease with which policy measures may be placed on the ballot.
17 At the time, the legislature reduced the size of the County of San Francisco by removing its southern portion and creating San Mateo County.
18 Peter M. Detwiler, “Creatures of Statute . . . Children of Trade: The Legal Origins of California Cities,” in California Constitution Revision Commission: History and Perspective (Sacramento: California Constitution Commission, 1996), 100.
11
Electoral System: Board of Supervisors
Types of Local Election Systems
California law generally provides for two main ways that cities can elect their legislative bodies, by district or at large,19 but generally requires that county boards be elected by district.20 In by district elections, like San Francisco’s, a local jurisdiction is divided into approximately equal population districts and the voters of each district elect a single member of the legislative body. By contrast, in at-large elections, all legislators are elected by a jurisdiction-wide electorate and there are no districts. Usually, an at-large contest is used to elect multiple members of the legislative body. California law does not expressly permit mixed election systems, which is where some members of a legislative body are elected by district and others are elected at large. Nonetheless, a few California cities have adopted mixed systems; these systems are much more common among cities of San Francisco’s size in other states.
Under the California Constitution, charter cities and charter cities and counties, like San Francisco, have “home rule” authority to decide the method of electing their legislative bodies, which could include by district or at-large voting system, a combination of these systems, or a different system entirely.21 While charter cities have broad authority to modify their election systems, federal and state voting rights laws may nonetheless restrict a city from using an at-large or mixed election method if it results in the disenfranchisement of a racial, ethnic, or language minority community.
Whether a legislative body is elected “by district” or “at-large” explains which geographic constituency gets to elect how many legislators, which political scientists commonly refer to as an electoral system’s “district magnitude.” Another important component of an election system is the voting formula, which is the set of rules used to decide which candidates are elected.
The most common voting formula is the first-past-the-post system, also known as plurality-winner system, whereby the candidate who receives the most votes (even if it is not a majority of the vote) is elected. In California, most cities are required to use the plurality-winner system whether they use by district or at-large elections. In at-large elections, voters generally get as many votes as there are seats to be elected, and the candidates receiving the most votes equal to the number of contested seats are elected.
Counties, by comparison, are generally required to use tworound runoff, which is a majority-winner system. If no candidate receives a majority in the primary, the two top vote getters advance to a runoff in the general election. Some charter cities, like Los Angeles and San José, also use runoffs, as did San Francisco previously. Unlike with plurality voting, runoffs in California are generally only used to elect council members or supervisors from single-member districts.
Pursuant to its home rule authority, San Francisco has used single-member Ranked Choice Voting (RCV) to elect its 11-member Board of Supervisors since 2004. Under RCV, voters may rank the candidates on their ballot by order of preference. If a candidate receives a majority of the first choice votes, that candidate is elected. If not, the candidate receiving the fewest first choice votes is eliminated, and any ballots cast for the eliminated candidate are instead counted towards the voter’s next-preferred candidate. This process may repeat until a candidate receives a majority of the vote, and is elected. RCV is sometimes called Instant Runoff Voting (IRV), because it simulates the results of a runoff, but without requiring a second election. Single-seat RCV is used in three other Bay Area cities, Berkeley, Oakland and San Leandro, and a multiseat variant, Proportional Ranked Choice Voting (PRCV), is used in a fourth Bay Area city, Albany.
History of San Francisco’s Supervisorial Election System
While San Francisco currently uses a by district system with RCV to elect its Supervisors, the City has alternated several times between electing Supervisors at-large versus by district. These sudden pendulum swings reflect a long and ongoing debate as to which electoral method promotes better city governance and democratic representation. Other aspects of the supervisorial election system, namely the size of the Board and the voting formula (i.e., how votes translate into seats) for electing Supervisors, have also changed over time.
In the nineteenth century, San Francisco’s legislative body was elected by district (then called “wards”) and was much larger than today’s Board of Supervisors. San Francisco’s first Charter under California law, adopted in 1850, provided for an elected Mayor and a 16-member, bicameral Common Council
19 See Cal. Gov. Code § 57116(b). There is a third category of election system called a “from district” system that is rarely used today. From district elections are a type of at-large election where candidates must reside in and are elected to represent a district, but are voted on by a jurisdiction-wide electorate. Because from district systems are rarely used and function similarly to at-large elections, this section focuses on the other two primary election systems.
20 See Cal. Gov. Code § 25040.
21 See Cal. Const. Art. XI, § 5 (city charters may provide for the “conduct of city elections” and “plenary authority is hereby granted … to provide … the manner in which [and] the method by which … the several municipal officers … shall be elected.”) See also Johnson v. Bradley, 4 Cal.4th 389, 398 (1992) (describing city elections as a “core” “home rule power” of charter cities). Charter cities and counties like San Francisco are both a charter city and a charter county, with its charter city powers superseding any conflicting charter county powers. Cal Const. Art. XI, § 6.
IV. SAN FRANCISCO’S GOVERNMENT DESIGN
12
Table 1. San Francisco’s Supervisorial Election System, 1850-Present
consisting of eight aldermen and eight assistant aldermen, with one alderman and one assistant alderman elected by plurality from each of the City’s eight wards.22 In 1856, the year the City and County of San Francisco were consolidated, voters adopted a new Charter, providing for a 12-member Board of Supervisors elected by district. During the first fifty years of its history, San Francisco went through a number of overhauls of its Charter, with reformers calling for structural changes to combat corruption and government inefficiency.23 In a small move away from districts, in the 1870s the City adopted “from district” elections, whereby supervisorial candidates had to reside in a district but were elected at large.24
In 1900, San Francisco replaced from district elections with at-large elections, which remained in place for most of the twentieth century. Municipal reformers of the late nineteenth century and early twentieth century argued that district elections, which were decided by smaller electorates than citywide elections, were too easily captured by political party bosses, who would exchange favors and the promise of government patronage for votes. Reformers also argued
that district elections promoted parochialism, because elected officials would be more responsive to the needs of their district’s neighborhoods than to the City overall.25 San Francisco Mayor James Phelan, who pushed for the change to at-large elections, argued that districts “give great advantages to the boss element. A district could be colonized and the man elected would be a district man not a representative of the city and all the people. ... The city should be protected from the ward methods which have disgraced the past, and out of which have come corrupt legislation.”26
That same 1900 Charter also expanded the number of Supervisors to 18, in an attempt to make government more responsive to the electorate. While originally Supervisors were elected by plurality vote, a runoff requirement was added in 1910, which was replaced by an early form of Ranked Choice Voting called “Bucklin Voting;” this system was subsequently abandoned because the City’s newly purchased voting machines could not handle a ranked ballot.27 In 1931 voters adopted a new Charter reducing the number of Supervisors down to the present 11.
22 Bernard Moses, The Establishment of Municipal Government in San Francisco (Baltimore: Johns Hopkins University Press, 1889), 62-63, https://archive.org/details/ establishmentofm00moserich/page/n3/mode/2up
23 Frederick M. Wirt, Power in the City (Berkeley: University of California Press, 1974), 108-112.
24 Philip J. Ethington, The Public City: the Political Construction of Urban Life in San Francisco, 1850-1900 (New York: Cambridge University Press, 1994), 389, https:// archive.org/details/publiccitypoliti0000ethi
25 Susan Welch and Timothy Bledsoe, Urban Reform and its Consequences (Chicago: University of Chicago Press, 1988), 1-8.
26 “Feared Too Much Reform,” San Francisco Examiner, March 26, 1898, 5.
27 Ashe v. Zemansky, 192 Cal. 83 (1923).
IV. SAN FRANCISCO’S GOVERNMENT DESIGN
YEARS NUMBER OF SUPERVISORS ELECTION SYSTEM VOTING FORMULA 1850-1856 16 MULTI-MEMBER DISTRICTS (8 DISTRICTS) PLURALITY 1856 4 SINGLE-MEMBER DISTRICTS PLURALITY 1856-1873 12 SINGLE-MEMBER DISTRICTS PLURALITY 1874-1899 12 FROM DISTRICTS PLURALITY 1900-1910 18 AT-LARGE PLURALITY 1910-1916 18 AT-LARGE RUNOFF 1917-1922 18 AT-LARGE BUCKLIN 1923-1931 18 AT-LARGE PLURALITY 1932-1933 15 AT-LARGE PLURALITY 1934-1977 11 AT-LARGE PLURALITY 1978-1980 11 SINGLE-MEMBER DISTRICTS PLURALITY 1981-1999 11 AT-LARGE PLURALITY 2000-2003 11 SINGLE-MEMBER DISTRICTS RUNOFF 2004-PRESENT 11 SINGLE-MEMBER DISTRICTS RCV
13
Sources: Bernard Moses, The Establishment of Municipal Government in San Francisco (Johns Hopkins University Press, 1889) and authors’ review of prior city charters and ballot measures.
This change reflected the philosophy of Progressive Era municipal reformers who favored small city councils elected at large to promote business-like efficiency. San Francisco has retained an 11-member Board since the 1930s, although its population has grown by more than 25% since then.28
The debate over at-large versus district elections was largely dormant through much of the twentieth century, but reemerged in San Francisco in the 1960s and 1970s and became fiercely contested for the remainder of the century. Between 1972 and 1996, San Franciscans voted on 12 different ballot measures to establish, repeal, or modify the City’s supervisorial election system. The first two district election ballot measures, in 1972 and 1973, failed to win voter support. However, in 1976 a coalition of neighborhood groups, progressive organizations, and labor succeeded in placing Measure T, an initiative charter amendment establishing 11 single-member supervisorial districts, on the ballot.29 Proponents argued that under the at-large system “seven of our eleven Supervisors live in just two small wealthy areas of the city” and that, as a result, the Board was “out of touch with what residents really want” and that the “concern of downtown corporations absorb too much of the Supervisors’ time and energy.” District elections
AT-LARGE VERSUS BY DISTRICT. THESE SUDDEN PENDULUM SWINGS REFLECT A LONG AND ONGOING DEBATE AS TO WHICH ELECTORAL METHOD PROMOTES
would ensure broader neighborhood representation, make campaigning less expensive so community-oriented candidates could win, and create a Board “more representative of the City’s diverse communities.”30 Opponents countered that districts were unnecessary in an area as geographically small as San Francisco, that the proposal would limit voters to electing one Supervisor instead of 11, and that districts would lead to a return to narrowly-focused ward politics.31 The third attempt at establishing district elections was the charm, and Proposition T passed 52% to 48%.
District elections substantially and immediately diversified the Board, as proponents had promised. In the very first elections using the new district boundaries, San Franciscans elected the City’s first Black woman Supervisor, Ella Hill Hutch, its first Asian Supervisor, Gordon Lau, and its first openly gay Supervisor, Harvey Milk.32 However, also part of that inaugural class of district Supervisors was Dan White, a conservative Democrat who campaigned in part on an anti-gay platform. A year after his election, White resigned from office for personal financial reasons but later regretted this decision. When then-Mayor George Moscone refused to reinstate White, he snuck into City Hall and assassinated Mayor
28 According to the U.S. Census Bureau, San Francisco had approximately 634,000 residents in 1930 and 874,000 in 2020.
29 Richard E. DeLeon, Left Coast City: Progressive Politics in San Francisco, 1975-1991 (Lawrence: University Press of Kansas, 1992), 49-51; Eugene C. Lee and Jonathan Rothman, “San Francisco’s District System Alters Electoral Politics,” National Civic Review 67, no. 4 (April 1978): 173-178.
30 San Francisco Registrar of Voters, San Francisco’s Voter Information Pamphlet, General Election, November 2, 1976, “Argument for Proposition ‘T,’” https://webbie1.sfpl. org/multimedia/pdf/elections/November2_1976short.pdf.
31 San Francisco Registrar of Voters, San Francisco’s Voter Information Pamphlet, General Election, November 2, 1976, “Argument against Proposition ‘T,’” https://webbie1. sfpl.org/multimedia/pdf/elections/November2_1976short.pdf
32 Wade Crowfoot, “District Elections in San Francisco,” Urbanist, SPUR, February 1, 2000, https://www.spur.org/publications/urbanist-article/2000-02-01/districtelections-san-francisco
GOVERNMENT DESIGN
IV. SAN FRANCISCO’S
THE CITY HAS ALTERNATED SEVERAL TIMES BETWEEN ELECTING SUPERVISORS
14
BETTER CITY GOVERNANCE AND DEMOCRATIC REPRESENTATION.
Moscone and Supervisor Milk. White’s subsequent conviction of voluntary manslaughter, rather than murder, outraged the City’s gay community and others and led to mass protests and riots at City Hall.33
A few years later, voters repealed district elections by a slim margin. Proponents of the 1980 initiative to reestablish at-large elections argued that districts had led to the election of fringe candidates who were not focused on solving city problems. The Moscone and Milk assassinations also likely loomed large in the minds of many voters, who may have agreed with proponents that a return to at-large elections would help “pick up the pieces and put San Francisco back together again.”34
The political push for district elections would resurface in the late 1980s and early 1990s. Responding to growing political pressure, in 1994 the Board placed Measure L on the ballot asking voters if the City should create a nine-member Elections Task Force – consisting of three members appointed by the Mayor, three by the Board, and three by the Registrar of Voters — to study and provide recommendations on different methods for electing the Board. The Board, which signed the official pro argument in the ballot pamphlet, explained that:
“for nearly 20 years, we have chosen sides in a debate over district or at-large elections of supervisors. What we have never done is put people of different views together jointly to look at and then propose a system of electing supervisors that meets the needs of the entire city as well as of our individual neighborhoods.”35
The proposal to create the Elections Task Force narrowly passed with 52% of the vote.
The task force met in early 1995 and heard arguments from academics as well as different community organizations. In its final report, the task force concluded that “the present system of electing supervisors was flawed and failed to provide adequate representation for most of the diverse populations of San Francisco” and that a different system should be adopted to “more closely reflect the ethnic, political, social, and economic diversity of San Francisco.”36
The task force recommended four alternative voting systems to the Board:
• District Elections: Create 11 single-member districts, elected by majority vote using a runoff election, if necessary
• At-Large Elections using Proportional Ranked Choice Voting (PRCV): Elect the 11-member Board at large using the multi-seat version of RCV, with five Supervisors elected in one election cycle and six the next
• At-Large Elections using Cumulative Voting: Elect the 11-member board at-large but use cumulative voting, a system where voters may cast all their votes for one candidate instead of multiple candidates
• Multimember District Elections using PRCV: Divide the City into five districts and elect three candidates from each district using PRCV. This proposal required expanding the Board to 15 members37
The Board voted to place two of the task force’s proposals on the 1996 ballot: Proposition G, which would re-establish district elections, and Proposition H, which would keep at-large elections but elect Supervisors using PRCV. Proposition G proponents did not organize an official campaign, but received the support of the Democratic Party, Republican Party, League of Conservation Voters, and an array of neighborhood and elected leaders.38 Repeating arguments from prior campaigns, proponents argued that districts would decrease the cost of campaigning and make candidates less dependent on big donors, empower ethnic communities, and ensure Supervisors would address neighborhood issues. The primary opponent listed in the ballot pamphlet was the Alice B. Toklas LGBTQ Democratic Club, which argued that, while districts had made sense in the 1970s, the Board today was diverse and districts could “hurt groups that are geographically dispersed, such as Gays/Lesbians, Asians and Pacific Islanders,
33 DeLeon, Left Coast City, 50-51.
34 Shaun Bowler and and Todd Donovan, The Limits of Electoral Reform (New York: Oxford University Press, 2013), 11-15; San Francisco Registrar of Voters, Voter Information Pamphlet and Sample Ballot, August 19, 1980 Special Election, “Argument in Favor of Proposition A,” https://webbie1.sfpl.org/multimedia/pdf/elections/ August19_1980.pdf
35 San Francisco Registrar of Voters, Voter Information Pamphlet and Sample Ballot, November 8, 1994 Consolidated General Election, “Proponent’s Argument in Favor of Proposition L,” https://webbie1.sfpl.org/multimedia/pdf/elections/November8_1994short.pdf
36 San Francisco Elections Task Force, A Report of the Elections Task Force to the Board of Supervisors, City and County of San Francisco (May 1, 1995), 3, https://archive.org/ details/reportofelection1199sanf/mode/2up
37 San Francisco Elections Task Force, A Report, 9-12.
38 Richard E. DeLeon, Steven Hill, and Lisel Blash, “The Campaign for Proposition H and Preference Voting in San Francisco, 1996,” Representation 35, no. 4 (1998): 265274; San Francisco Department of Elections, Voter Information Pamphlet and Sample Ballot: November 5, 1996 Consolidated Presidential General Election, “Proponent’s Argument in Favor of Proposition G,” 154, https://webbie1.sfpl.org/multimedia/pdf/elections/November5_1996short.pdf
IV. SAN FRANCISCO’S GOVERNMENT DESIGN
15
Hispanics, and African Americans, by making them a minority in every district.”39
Proposition H proponents mounted a more traditional campaign and built a broad coalition of supporters, including the Democratic Party (which endorsed both measures) and numerous Democratic political clubs, including the Alice B. Toklas Club; labor groups; civil rights organizations, including MALDEF; third parties like the Green and Libertarian parties; and a long list of community and elected leaders printed in the ballot pamphlet. Proponents argued that PRCV would create “fair and representative government” in San Francisco; by lowering the threshold of votes needed to win office, PRCV would enable candidates with strong neighborhood support to win office but also candidates whose support was more dispersed in “communities throughout the City, such as small business owners, tenants, gays and lesbians, [and] ethnic groups.”40 The primary opposition to Proposition H came from the Chamber of Commerce, which argued that PRCV was “difficult for voters to understand and costly to administer” and that “the effects on voters and city government are unclear.”41
On Election Day, Proposition G passed with 57% in favor to 43% against, establishing San Francisco’s present district-based election system, while Proposition H was defeated with only 44% in favor and 56% against. Exit polling found that, for voters who opposed Proposition H, the top reasons for doing so were that PRCV was too complicated (36%), the current system worked fine (21%), or that districts were a preferable solution (20%).42
The first district elections were held in 2000. In 2002, to eliminate the need for holding what critics called “expensive [and] low-turnout” December runoff elections, voters passed Proposition A to use single-seat RCV (then called “Instant Runoff Voting”) for all city elections, including the Board of Supervisors.43 RCV elections were first held in 2004. Supervisorial elections have been conducted by district using RCV since then.
Comparison with Local Election Systems in California and the U.S.
In 2004, San Francisco became the first U.S. city to use single-seat RCV in modern history. Since then, while still not the norm, the reform has grown significantly at both the state and local levels. According to FairVote, a nonprofit organization that advocates for the adoption of RCV, 61 local governments now use either single or multi-seat RCV for their elections, including New York City, Santa Fe, and Minneapolis. Two states, Alaska and Maine, use RCV for state and federal elections. In California, eight cities now use or are set to use RCV, including Albany, Berkeley, Eureka, Oakland, Palm Desert, Redondo Beach, and San Leandro.44
Where San Francisco is far more mainstream is in its use of by district elections to elect its legislative body. All 58 California counties elect their supervisors by district.45 In addition, according to a forthcoming 2023 study by the Rose Institute, more than 200 of California’s 482 cities now use by district elections. While a majority of California cities use at-large elections, these are mostly smaller jurisdictions, and even this number has been falling fast over the past two decades as cities have converted to by district elections under threat of litigation under the California Voting Rights Act (CVRA).46 The CVRA is a 2002 law, discussed further below, that prohibits a local government from using an at-large election system, or a mixed election system, that in practice dilutes the voting power of a race or language minority group and impairs that group’s ability to “elect candidates of its choice or its ability to influence the outcome of an election.”47 Typically, upon proving a CVRA violation, a court will order a jurisdiction to adopt district-based elections and award plaintiffs their attorney’s fees. Since the CVRA’s enactment, more than 170 cities have transitioned to by district elections, most voluntarily to avoid costly litigation and most in the last ten years.48
Only two (0.4%) California cities, Oakland and Downey, use a mixed electoral system; however, in each case, only one council
39 San Francisco Department of Elections, Voter Information Pamphlet and Sample Ballot: November 5, 1996
Consolidated Presidential General Election, “Opponent’s Argument in Opposition to Proposition G,” 155, https://webbie1.sfpl.org/multimedia/pdf/elections/November5_1996short.pdf
40 DeLeon, Hill, and Blash, “Campaign for Proposition H,” 265-274; San Francisco Department of Elections, Voter Information Pamphlet and Sample Ballot: November 5, 1996 Consolidated Presidential General Election, “Proponent’s Argument in Favor of Proposition H,” https://webbie1.sfpl.org/multimedia/pdf/elections/ November5_1996short.pdf
41 San Francisco Department of Elections, Voter Information Pamphlet and Sample Ballot: November 5, 1996 Consolidated Presidential General Election, “Opponent’s Argument in Against of Proposition H,” https://webbie1.sfpl.org/multimedia/pdf/elections/November5_1996short.pdf
42 DeLeon, Hill, and Blash, “Campaign for Proposition H,” 271.
43 San Francisco Department of Elections, Voter Information Pamphlet And Sample Ballot, March 5, 2002 Consolidated Primary Election, “Proponent’s Argument In Favor Of Proposition A,” https://webbie1.sfpl.org/multimedia/pdf/elections/March5_2002.pdf
44 FairVote, “Where is Ranked Choice Voting Used?” https://fairvote.org/our-reforms/ranked-choice-voting-information/, n.d., accessed April 28, 2023.
45 Jonathan Vankin, “District vs. At-Large Races: The Final Frontier of Voting Rights,” California Local, June 7, 2021, https://californialocal.com/localnews/statewide/ca/ article/show/396-district-vs-at-large-elections-explained
46 Pieter van Windergen, The Transformation of California’s City Council Election Systems, Claremont, CA: Rose Institute of State and Local Government, forthcoming.
47 Cal. Elec. Code § 14027.
48 Jim Smith, “Woodland’s district elections are helping minorities,” Daily Democrat (Woodland, CA), November 2, 2020, https://www.dailydemocrat.com/2020/11/02/ district-elections-are-helping-minorities/
IV. SAN FRANCISCO’S GOVERNMENT DESIGN
16
Table 2. Council Election System in the Top Ten California Cities by Population
*The city council includes a mayor elected at large.
Sources: U.S. Census Bureau 2022 population estimates; Rose Institute review of city websites and charters.
member is elected at large with the remaining members elected by district. This is not substantially different from cities that have a city council elected by district but with a mayor elected at large who is also a member of the council.
California’s ten largest cities, San Francisco’s closest in-state peers, have even less variation than the state as a whole.
As illustrated in Table 2, council members in nine out of ten cities, excepting only Oakland, are elected solely by district. As a result of the CVRA, the largest California city to still have an all at-large city council is Irvine, with a population of just over 300,000. However, Irvine is in the process of considering a move to by district elections.49 The next largest city, Santa Clarita (230,000) has already committed to transitioning to by district elections beginning in 2024.50
Nationally, the distribution of municipal election systems differs significantly from California, especially as to mixed election systems, which are far more common in other states. According to a 2018 survey by the International City/County Management Association (ICMA), 68% of city councils in American cities are elected at large compared with only 18.4% by district and 13.6% through a mixed system.51
However, in the nation’s 100 largest cities, by district elections and mixed elections are far more common. In research conducted for this report, the Rose Institute found that a small majority (55%) use by district elections, including cities like New York, Chicago, Phoenix, Austin, and Las Vegas. Conversely, at-large elections are relatively rare, with only 12% of large cities using this system. Columbus, Ohio, is the only city with more than 500,000 residents to use purely at-large elections. Other at-large cities include Cincinnati, St. Louis, and Plano, Texas. A far greater number of cities, 33%, use mixed elections, including Houston, Philadelphia, Jacksonville, Seattle, Denver, and Baltimore. In cities with mixed systems, on average eight council members are elected by district and three at large, or about a 2:1 ratio in favor of district council members.
For San Francisco’s closest-in-size peer jurisdictions, the incidence of mixed systems is even higher at 50%. Table 3 lists the city council election system used in the ten U.S. cities with populations between 700,000 and 1,000,000, including San Francisco which has a population of 808,437 as of the most recent Census Bureau estimate.52
49 Yursa Farzan and Hanna Kang, “How might district-based elections change voting in Irvine?” Orange County Register, February 7, 2023, https://www.ocregister. com/2023/02/07/how-might-district-based-elections-change-voting-in-irvine/
50 City of Santa Clarita, “District Elections,” n.d., accessed March 31, 2023, https://www.santa-clarita.com/city-hall/district-elections
51 International City/County Management Association, 2018 Municipal Form of Government Survey: Summary of Results (Washington, DC: ICMA, July 2019), 10, https:// icma.org/sites/default/files/2018%20Municipal%20Form%20of%20Government%20Survey%20Report.pdf
52 U.S. Census Bureau, “QuickFacts: San Francisco city, California,” n.d., accessed June 5, 2023, https://www.census.gov/quickfacts/fact/table/sanfranciscocitycalifornia/ PST045221
IV. SAN FRANCISCO’S GOVERNMENT DESIGN
COUNCIL SEATS CITY TYPE AT-LARGE BY DISTRICT TOTAL LOS ANGELES BY DISTRICT 0 15 15 SAN DIEGO BY DISTRICT 0 9 9 SAN JOSÉ BY DISTRICT 0 10 11* SAN FRANCISCO BY DISTRICT 0 11 11 FRESNO BY DISTRICT 0 7 7 SACRAMENTO BY DISTRICT 0 8 9* LONG BEACH BY DISTRICT 0 9 9 OAKLAND MIXED 1 7 8 BAKERSFIELD BY DISTRICT 0 7 7 ANAHEIM BY DISTRICT 0 6 7*
17
Table 3. Council Election System in U.S. Cities Between 700,000 and 1,000,000 Population
Sources: U.S. Census Bureau 2022 population estimates; Rose Institute review of city websites and charters.
Mayor’s Powers
San Francisco is a “strong mayor” city, which means that the Mayor acts as the City’s chief executive officer. The strong mayor system can be contrasted to the “city manager” or “council-manager” form of government. In the council-manager system, the mayor has limited, mostly ceremonial powers, and an appointed, professional city manager serves as the city’s chief executive. Strong mayor cities are the exception in California: Los Angeles, San Diego, Oakland, and Fresno are the only other cities in the state that currently use the strong mayor form of government.
Although San Francisco is categorized as a strong mayor city, it is perhaps more accurately described as having a “partial” or “quasi” strong mayor system, because it has limited the Mayor’s powers in various ways over time. The Charter of 1900 provided for a strong Mayor, but reformers soon raised concerns about concentration of power and corruption in the Mayor’s office. Influenced by the Progressive Era’s ideal of professional, non-political administration, reformers sought to convert San Francisco to the city manager system. Although they failed to achieve their goal, their efforts had effect.
The Charter of 1932 weakened the Mayor and introduced a
split form of executive authority by creating a new, powerful non-elected office of Chief Administrative Officer (CAO).53 While the Mayor retained certain executive powers, especially with respect to appointments and the budget, the CAO was assigned a wide range of executive powers, including supervision of city departments. Under this new arrangement, the Mayor would appoint the CAO, subject to Board confirmation, but could not remove that officer. Instead, the CAO enjoyed life tenure and could be removed only for cause by a supermajority vote of the Board of Supervisors, or by recall by the voters. (A charter amendment in 1977 created a ten-year term for the CAO.) In addition, a number of commissions were established to supervise city departments.
This division of executive power between the Mayor, CAO, and commissions lasted for more than 60 years. Over time, however, the arrangement was criticized for blurring lines of executive authority. A central goal of the 1996 Charter was to restructure the executive branch by abolishing the office of CAO and replacing it with the new office of City Administrator, which would have lesser powers, report to the Mayor and Board of Supervisors, and serve a shorter (5-year) term.
IV. SAN FRANCISCO’S GOVERNMENT DESIGN
53 The 1932 Charter also introduced the independent office of Controller.
COUNCIL SEATS CITY TYPE AT-LARGE BY DISTRICT TOTAL AUSTIN, TEXAS BY DISTRICT 0 10 11* JACKSONVILLE, FLORIDA MIXED 5 14 19 SAN JOSÉ, CALIFORNIA BY DISTRICT 0 10 11* FORT WORTH, TEXAS BY DISTRICT 0 8 9* COLUMBUS, OHIO AT-LARGE 7 0 7 CHARLOTTE, NORTH CAROLINA MIXED 4 7 12* INDIANAPOLIS, INDIANA BY DISTRICT 0 25 25 SAN FRANCISCO, CALIFORNIA BY DISTRICT 0 11 11 SEATTLE, WASHINGTON MIXED 2 7 9 DENVER, COLORADO MIXED 2 11 13
*The city council includes a mayor elected at large.
18
The current Charter clearly establishes the Mayor as the City’s chief executive officer. Among other responsibilities, it directs the Mayor to:
• Provide general administration and oversight of all departments and governmental units in the executive branch
• Coordinate all intergovernmental activities of the City and County
• Submit ordinances and resolutions for consideration by the Board of Supervisors
• Present a statement of policies and budget priorities for the coming year
• Submit to the Board of Supervisors proposed budgets as well as supplemental appropriations
The Charter also empowers the Mayor to:
• Veto ordinances and resolutions passed by the Board of Supervisors (subject to override)
• Veto budget line items (subject to override)
• Hire staff (subject to restrictions listed below)
• Exercise emergency powers (subject to various limitations)
• Fill vacancies in any elective office until a successor is elected
• Submit ballot measures to voters
• Appoint the city administrator, controller, some department heads, and some commission members (often subject to approval of the Board of Supervisors)
• Remove some city officials and commission members (sometimes subject to the approval of the Board of Supervisors)54
The new Charter also gave the Mayor power to appoint department heads.55 More broadly, the 1996 Charter created a unified executive under the Mayor and shifted power to elected officials (i.e., the Mayor and Board of Supervisors) and away from unelected officials and commissions.
The Mayor of San Francisco thus possesses considerable powers, especially those related to the budget process. Under the Charter, the Mayor is tasked with developing the City’s budget and has a team assigned to that responsibility. By contrast, the Charter gives the Board of Supervisors a secondary role on budgetary matters. The Board reviews the Mayor’s budget and can make limited cuts, which it can then reallocate through the “add back” process.
Yet, at the same time that the Charter vests substantial powers in the Mayor, it also places constraints on those powers. It does so partly through direct limitation. For example, the Charter prohibits the Mayor from appointing deputy mayors to oversee departments and caps the amount of compensation that can be paid to members of the Mayor’s senior staff.56 The Charter also restricts the Mayor’s appointive powers by requiring Board approval for the Mayor’s appointment and removal of key officials such as the City Administrator and Controller; by limiting the Mayor’s power of appointment and removal of members of numerous boards and commissions; and by requiring the Mayor’s selection of some department heads serving under boards or commissions to come from a list of three nominees submitted by the board or commission.57 In addition, the Charter gives boards and commissions significant supervisory authority over many city departments, rather than reserving that power to the Mayor’s office. It also divides between the Mayor, the Board of Supervisors, and other city officials the power of appointment of boards and commissions (as discussed further below). Over time, a series of charter reforms have weakened the Mayor by, among other things, creating more commissions and granting the Board of Supervisors more power to appoint commissioners.
54 Charter of the City and County of San Francisco, Art. III, §§ 3.100 et seq.
55 The power of appointment and removal of the City Administrator is established as follows: “The Mayor shall appoint or reappoint a City Administrator, subject to confirmation by the Board of Supervisors. The appointee shall have at least ten years’ governmental management or finance experience with at least five years at the City, County, or City and County level. The City Administrator shall have a term of office of five years, and may be removed by the Mayor subject to approval by the Board of Supervisors. Charter of the City and County of San Francisco, Art. III, § 3.104. The power of appointment and removal of the Controller is established as follows: “The Mayor shall appoint or reappoint a Controller for a ten-year term, subject to confirmation by the Board of Supervisors. The Controller may only be removed by the Mayor for cause, with the concurrence of the Board of Supervisors by a two-thirds vote.” Charter of the City and County of San Francisco, Art. III, § 3.105(a).
56 Charter of the City and County of San Francisco, Art. III, § 3.100.
57 Charter of the City and County of San Francisco, Art. III-IV, §§ 3.104, 3.105, 4.102(5).
IV. SAN FRANCISCO’S GOVERNMENT DESIGN
19
Commission System
At last count, San Francisco has 130 boards, commissions, and advisory bodies created by the Charter, city ordinance, or California statute.58 Of these, 55 (including the Board of Supervisors) have decision-making authority and their members are required to file financial disclosures with the Ethics Commission under the City’s Conflict of Interest Code. The remaining 75 boards, commissions, and task forces serve advisory functions; their members do not have to file financial disclosures.59
Decision-making commissions may be subdivided into two general types. Executive commissions have some ability to direct the conduct of the agencies they oversee. The Planning Commission, for example, approves building permits. Quasijudicial commissions, on the other hand, do not set policy or guide agency action, but instead resolve disputes as to whether a party has complied with City law. Some commissions blend both functions. The Police Commission, for example, has the ability both to set policing policy and to conduct disciplinary hearings to review allegations of police misconduct. Commissions were originally meant to act as something like a company board of directors, to develop policy guidance for departments to execute.60 Under the 1932 Charter, the Mayor appointed commission members, with the exception of police and fire commissioners. The Mayor could not remove commission members and had no formal authority over their executive power — indeed, the 1932 Charter was designed to remove those powers from the Mayor. Of note, the commission system remained small through most of the twentieth century. In the early 1970s, for example, San Francisco had only about 20 boards and commissions. That number has grown to the current 130 over the past 50 years.
Currently, the decision-making commissions are generally established by the City’s Charter (70%), whereas most of the advisory commissions are created by ordinance. The Charter delineates the powers and duties of boards and commissions61 which include the power to:
• Formulate, evaluate, and approve goals and programs consistent with the overall objectives of the City and County, as established by the Mayor and Board of Supervisors
• Approve (after public hearing) of applicable departmental budgets, subject to the Mayor’s final authority to initiate and prepare the annual proposed budget
• Nominate applicants to the Mayor for the position of department head (unless otherwise specifically provided for)
• Remove department heads
• Hold hearings and take testimony from the public
The size of the 55 decision-making commissions varies from as few as three members on the Refuse Rate Board, to 27 on the Asian Art Commission, to as many as 62 on the Fine Arts Museums Board of Trustees. Most commissions, however, have six or seven members. The Mayor appoints all members to 23 commissions and majority of members to eight, but less than a majority to 24. In many cases, the Mayor’s appointment power is further limited by a requirement that the Board of Supervisors approve the Mayor’s nominees.
Consider two important commissions: Planning and Police. The Mayor nominates four of the seven members of both
IV. SAN FRANCISCO’S GOVERNMENT DESIGN
58 Chiu, List.
59 Chiu, List.
60 Wirt, Power in the City, 120.
61 Charter of the City and County of San Francisco, Art. IV, § 4.102.
20
AT LAST COUNT, SAN FRANCISCO HAS 130 BOARDS, COMMISSIONS, AND ADVISORY BODIES CREATED BY THE CHARTER, CITY ORDINANCE, OR CALIFORNIA STATUTE.
commissions. The President of the Board of Supervisors nominates the remaining three members of the Planning Commission, while the Rules Committee of the Board of Supervisors nominates the remaining three members of the Police Commission. Although the Mayor formally nominates a majority of the members of these commissions, the Board of Supervisors must approve all nominees. This arrangement effectively gives the Board a veto over the Mayor’s nominees without granting the Mayor the same power over the Board’s nominees. In a real sense, this means that the Board, rather than the Mayor, has greater control over the appointments to these commissions. Many of the leaders we interviewed pointed to this imbalance as a flaw in the commission system. Moreover, on some commissions, members may be removed only for cause, further insulating appointed commissioners from oversight or direction by San Francisco’s elected branches of government.
Ballot Measures
San Francisco has one of the nation’s most active systems of direct democracy, and ballot measures are a central feature of the City’s government design. In 1898, San Francisco became one of the first jurisdictions in California (along with Vallejo) to adopt the initiative, referendum, and recall, more than a decade before Californians adopted these procedures for the state in the Special Election of 1911.62 In San Francisco, as at the state level, the initiative, referendum, and recall are powerful devices: the initiative process allows citizens to bypass their representatives and enact laws directly; the referendum process (sometimes called the veto referendum) allows citizens to overturn a new law enacted by their representatives; and the recall allows citizens to remove a representative from office before the end of the representative’s term. In San Francisco, these three forms of direct democracy are supplemented by measures placed on the ballot by the Board of Supervisors, the Mayor, and the non-elected Ethics Commission.63
The San Francisco Charter fuels the use of ballot measures by setting a low signature requirement for qualifying a non-charter measure (that is, an initiative ordinance or declaration of policy) at 2% of all registered voters, and also by allowing onethird of the Board of Supervisors (four of 11) and the Mayor
on his or her own to place ordinances or declarations of policy before the voters.64 The qualification rules for both citizen-initiated and Board-sponsored charter amendments are more stringent than for non-charter measures. Amendments to San Francisco’s Charter are governed by state law, which permits a majority of the Board of Supervisors or citizens, by petition, to place the proposed amendments before the voters. To place a charter amendment on the ballot by initiative petition, citizens must collect signatures equal to 10% of registered voters.65
In addition, once a non-charter ballot measure is approved by voters, the Board of Supervisors cannot amend it (unless the measure, by its terms, so allows), which means that voters are often called upon to consider changes to previously approved measures.66 In combination, these provisions, together with the City’s participatory political culture, have caused San Francisco to have far more ballot measures than its peer jurisdictions in the state.
Comparing San Francisco to other California cities reveals that it is an outlier in helping citizens qualify initiatives for the ballot.
The California Elections Code sets signature requirements for citizens of charter cities (and charter cities and counties) to place charter amendments on the ballot. The standard is 15% of the number of registered voters in charter cities. By comparison, the state has established a lower threshold for citizens in San Francisco (California’s only city and county), where citizens need to gather signatures equal to only 10% of registered voters to place a charter amendment on the ballot.67
General law cities (about three-fourths of all cities in California) follow state law and require proponents to gather signatures from 10% of registered voters to qualify a statutory initiative. Charter cities, however, can set their own rules for qualifying these measures. Many charter cities have opted to follow the state’s standard (10% of registered voters), but others have chosen a different signature threshold. Among California’s ten largest cities, six follow the standard requirement of 10% of registered voters. The remaining four vary. Los Angeles, for example, requires proponents to gather signatures equaling 15% of the number of votes cast for mayor in the last election; San José, by comparison, requires signatures from 5% of registered voters. Of course, the total number of registered voters is far greater than the number of votes cast in a mayoral election. In San Francisco, for example, the number of votes
63 Charter of the City and County of San Francisco, Art. II, § 2.113; Art. XV, § 15.102.
64 Charter of the City and County of San Francisco, Art. II, § 2.113.
65 Cal. Elec. Code §§ 9255(b)(1) and (c)(2).
66 Charter of the City and County of San Francisco, Art. XIV, § 14.101 (b).
67 Cal. Elec. Code § 9255 (c)(1)-(2).
IV. SAN FRANCISCO’S GOVERNMENT DESIGN
62 Tracy M. Gordon, The Local Initiative in California (San Francisco: Public Policy Institute of California, 2004).
21
Table 4. Signature Requirements for Ballot Access, 10 Largest CA Cities (All Charter Cities)
Sources: *Cal. Elec. Code §§ 9215, 9236, 11221; Official City of Los Angeles Charter (current through December 2022); City Charter of the City of San Diego (amended through November 2020); Charter of the City and County of San Francisco (amended through November 2022); San José City Charter (amended through November 2022).
cast in the most recent mayor’s race (in 2019) was 179,58768, whereas in May 2023, the City’s number of registered voters totaled 502,122, or more than 2.8 times the number who voted in the last mayoral election.69
Among the state’s top-ten cities, San Francisco has long maintained the least demanding requirement for placing non-charter initiatives on the ballot. Until 2022, the City’s Charter required initiative proponents to gather, within 180 days, signatures equaling 5% of the votes cast in the last mayoral election. Following the 2019 election, this rule required proponents to gather only 8,979 valid signatures to place an initiative on the ballot.70
In 2022, voters approved Proposition H, a measure placed on the ballot by the Board of Supervisors to shift city elections to even-numbered years (consolidating them with state and federal elections). The measure was designed to increase voter turnout in city elections. Because San Francisco’s signature requirement for qualifying ballot measures was tied to the votes cast in mayoral elections, it was foreseeable that the change would raise the bar for qualifying initiatives, as well as referendums and recalls.
Last year, Proposition H changed the signature threshold for non-charter ballot initiatives from 5% of the vote cast in the last mayoral election to 2% of registered voters. This amendment effectively maintained the existing signature requirement for
68 San Francisco Department of Elections, “Statement of the Results, City and County of San Francisco, Consolidated Municipal Election - November 5, 2019.” (San Francisco Department of Elections, November 26, 2019), 4. https://www.sfelections.org/results/20191105/data/20191125/CertificationLetterNov2019.pdf. The “Round 0” total is 177,192. The “Round 1” total is 179,587; it adds to Round 0 the second- and third-choice selections whenever the preceding choice is blank or invalid. Both the Round 0 and the Round 1 totals are reported in the “Statement of Results.”
69 San Francisco Department of Elections, “Current Registration Counts,” last updated May 9, 2023, https://www.sfelections.org/tools/election_data/index.php
70 See San Francisco Department of Elections, Voter Information Pamphlet and Sample Ballot: November 8, 2022 Consolidated General Election, “Digest for Proposition M,” https://sfpl.org/sites/default/files/2022-10/N22_SFVIP_EN.pdf; San Francisco Department of Elections, Results Summary: November 8, 2011 Consolidated Municipal Election, https://www.sfelections.org/results/20111108/.
IV. SAN FRANCISCO’S GOVERNMENT DESIGN
CITY CHARTER AMENDMENT INITIATIVE (GENERAL ELECTION) INITIATIVE (SPECIAL ELECTION) REFERENDUM RECALL ANAHEIM 15% REGISTERED VOTERS 10% REGISTERED VOTERS 5% GUBERNATORIAL VOTES 10% REGISTERED VOTERS BAKERSFIELD 15% REGISTERED VOTERS 10% REGISTERED VOTERS 5% GUBERNATORIAL VOTES 10% REGISTERED VOTERS FRESNO 15% REGISTERED VOTERS 10% REGISTERED VOTERS 5% GUBERNATORIAL VOTES 10% REGISTERED VOTERS LONG BEACH 15% REGISTERED VOTERS 10% REGISTERED VOTERS 5% GUBERNATORIAL VOTES 10% REGISTERED VOTERS LOS ANGELES 15% REGISTERED VOTERS 15% MAYORAL VOTES 10% MAYORAL VOTES 15% REGISTERED VOTERS OAKLAND 15% REGISTERED VOTERS 10% REGISTERED VOTERS 5% GUBERNATORIAL VOTES 10% REGISTERED VOTERS SACRAMENTO 15% REGISTERED VOTERS 10% REGISTERED VOTERS 5% GUBERNATORIAL VOTES 10% REGISTERED VOTERS SAN DIEGO 15% REGISTERED VOTERS 10% REGISTERED VOTERS 5% REGISTERED VOTERS 15% REGISTERED VOTERS SAN FRANCISCO 10% REGISTERED VOTERS* 2% REGISTERED VOTERS 10% MAYORAL VOTES 10% MAYORAL VOTES 5% MAYORAL VOTES IF ORDINANCE GRANTS ANY FRANCHISE 10% REGISTERED VOTERS SAN JOSÉ 15% REGISTERED VOTERS 5% ELIGIBLE VOTERS 8% ELIGIBLE VOTERS 8% ELIGIBLE VOTERS 12% REGISTERED VOTERS
22
Table 5. How Measures Reached the Ballot in San Francisco, 2013-2022
*Does not include MR3, a multi-county measure put on the ballot by the Bay Area Toll Authority. **Does not include Measure AA, a multi-county measure put on the ballot by the Board of the San Francisco Bay Restoration Authority
these measures. Under the old rule (5% of the vote in the last mayor’s election), the threshold for qualifying a ballot measure for elections in the current cycle was 8,979 valid signatures; under the new rule (2% of registered voters), the bar moved only slightly, to about 10,000 signatures.71 Either way, San Francisco’s signature requirement for non-charter initiatives is far lower than in peer jurisdictions.
Of note, San Francisco also allows proponents to force an early (special) election for a non-charter ballot initiative if the proponents can gather signatures equal to 10% of the vote in the last mayor’s election. Proposition H of 2022 did not change this requirement.
By comparison, San Francisco’s ballot access rules for other forms of direct democracy (referendum and recall) are
generally comparable to its peer jurisdictions. San Francisco’s Charter requires proponents to gather signatures equal to 10% of registered voters to force a recall election, and (with some exceptions) signatures equal to 10% of the vote in the last mayoral election to place a veto referendum on the ballot.72 (See Table 4.)
San Francisco has also opened the door wide for Supervisors and the Mayor to place non-charter measures on the ballot. The customary rule at both the state and local level is that legislative bodies must approve a measure by at least a majority vote before presenting the measure to the electorate. By contrast, as noted above, the San Francisco Charter allows a minority of the Supervisors (presently four of 11) to submit a non-charter measure to voters.73 (Charter amendments require
71 Charter of the City and County of San Francisco Art. XIV, § 14.101 (amended by Proposition H, approved November 8, 2022.)
72 *Cal. Elec. Code § 9255 (c) (1) (for charter amendments for cities); **Cal. Elec. Code § 9255 (c) (2) (for charter amendments for cities and counties); Charter of the City and County of San Francisco, Art. XIV, § 14101 (requirements initiative special election); Art. XIV §14.102 (requirements for legislative referendum); Art. XIV, § 14103 (requirements for recall).
73 Charter of the City and County of San Francisco, Art. II, § 2.113.
IV. SAN FRANCISCO’S GOVERNMENT DESIGN
YEAR ALL METHODS BOARD OF SUPERVISORS MAYOR SIGNATURE PETITION OTHER CITY ENTITY (ETHICS COMMISSION) MAJORITY MINORITY (LESS THAN 6) TOTAL 115 68 12 3 30 2 59.1% 10.4% 2.6% 26.1% 1.7% 2022 22 13 3 1 5 0 2021 0 2020 17 13 1 2 1 0 2019 6 3 2 0 1 0 2018 * 14 6 1 0 7 0 2017 0 2016 ** 27 19 3 0 4 1 2015 11 4 1 0 5 1 2014 14 9 1 0 4 0 2013 4 1 0 0 3 0
Source: San Francisco Voter Information Pamphlets, San Francisco Public Library, https://sfpl.org/locations/main-library/government-information-center/san-francisco-government/san-francisco-1/san
23
Table 6. Number of Ballot Measures, 10 Largest CA Cities and Associated Counties, 2013-2022 (Includes both Citizen-Sponsored Ballot Measures and Measures Placed on the Ballot by City Governments)
Mean excluding San Francisco = 27.9
Source: California Elections Data Archive, California State University, Sacramento, Institute for Social Research, accessed April 9, 2023, https://csucsus.esploro.exlibrisgroup.com/esploro/outputs/dataset/California-Elections-Data-Archive-CEDA/99257830890201671?institution=01CALS_USL
*Does not include MR3, a multi-county measure put on the ballot by the Bay Area Toll Authority.
**Does not include Measure AA, a multi-county measure put on the ballot by the Board of the San Francisco Bay Restoration Authority
a majority vote of the Board, followed by majority approval by voters.) San Francisco also allows the Mayor to assume the quasi-legislative function of placing, without Board approval, proposed ordinances on the ballot.74 Finally, the Charter has empowered the City’s Ethics Commission, a non-elected body, to place measures on the ballot, as well.75
Over the past decade, the Board of Supervisors has been the leading source of the City’s ballot measures (80 of 115). In 12 of those cases, a majority of the Board did not support the measure. Citizens were the next most frequent source, placing 30 measures on the ballot. The Mayor placed three measures on the ballot and the Ethics Commission two (See Table 5).
With all these easy access points, it is unsurprising that far more measures make it to the ballot in San Francisco than in California’s other major cities. Table 6 catalogs measures on
the ballot in the state’s ten largest cities over the past decade, adding the number of measures each year for the city as well as the county in which the city is located. From 2013 to 2022, 115 measures appeared on the San Francisco ballot. In the runner up city, San Diego, voters encountered less than half that many (55, including 41 city and 14 county measures). Excluding San Francisco, in the past ten years, the average number of measures in the nine jurisdictions (city plus county) was 27.9, one-quarter San Francisco’s total. San Francisco’s sheer number of ballot measures — more than ten in most years and as high as 27 in 2016 and 22 in 2022 — is an outlier among peer jurisdictions and a major feature of the City’s government design (See Table 6). •
IV. SAN FRANCISCO’S GOVERNMENT DESIGN
74 Charter of the City and County of San Francisco, Art. III, § 3.100. 75 Charter of the City and
of San Francisco, Art. XV, § 15.102.
County
TOTAL 2022 2021 2020 2019 2018 * 2017 2016 ** 2015 2014 2013 SAN FRANCISCO 115 22 0 17 6 14 0 27 11 14 4 SAN DIEGO 55 5 0 9 0 13 0 24 0 4 0 OAKLAND 41 10 0 11 0 8 0 5 0 7 0 LOS ANGELES 35 6 0 4 0 3 6 6 2 1 7 LONG BEACH 29 5 0 7 0 7 1 6 0 2 1 SAN JOSÉ 23 1 0 4 0 8 0 7 0 3 0 SACRAMENTO 22 8 0 4 0 3 0 5 0 2 0 ANAHEIM 17 1 0 1 0 3 0 3 0 9 0 FRESNO 15 4 0 0 0 5 0 3 0 2 1 BAKERSFIELD 14 3 0 2 0 5 0 2 1 0 1
24
ASSESSMENT OF CURRENT DESIGN V
• The structures of San Francisco government impair in various ways City Hall’s ability to meet current challenges

• The pure by district system of supervisorial elections prioritizes representation of local neighborhoods and communities, but creates weaker incentives for individual Supervisors to consider the needs of the City as a whole
• Mayors are expected to exert effective executive authority and to provide a citywide vision, but are not adequately empowered to meet these expectations
• Commissions provide a useful means to gather citizen input and provide oversight of government officials, but the commission system as a whole has become too large, complex, and burdensome
• The ballot measure system similarly allows citizens to have direct input in policy making, but the sheer number and cumulative effects of ballot measures further limits the capacity of elected officials to govern
• Procedural rules and norms often allow small groups or even individuals to delay or block essential decision-making
• In the interest of making government “more democratic,” many elements of the system instead limit the ability of democratically elected officials to carry out the will of the people—that is, to solve the City’s most pressing problems
Overview
Recent public opinion surveys confirm that many San Franciscans have lost faith in City Hall’s ability to solve the pressing challenges the City faces. Similarly, nearly all the leaders consulted for this report – including former Supervisors, other current and former elected and appointed officials, and business and civic leaders — expressed the view that City Hall is failing to address core City needs. Many of them described San Francisco government as “dysfunctional.” Some of the leaders we interviewed suggested the problem is largely political: San Francisco is divided into two factions, Progressives and Moderates, and the two sides have failed to unite on a vision for moving the City forward. Others, however, stressed that the structures of government deserve at least some blame for City Hall’s failures. This section assesses how various features of San Francisco government limit the City’s ability to address the current crisis.
25
Electoral System: Bo ard of Supervisors
Many San Franciscans have a low view of the performance of the City’s Board of Supervisors. In a recent San Francisco Standard poll, only 23% of respondents approved of the Board’s work, compared with 77% who disapproved.76 A San Francisco Chronicle poll found similarly “low marks for the Supervisors — which cut across nearly all racial, ethnic, gender and age groups.”77 To put this in context, the Board’s popularity is far lower than Californians’ approval of the Legislature (49% approve) and almost identical to state residents’ assessment of the politically-divided Congress (27% approve).78
Several leaders we interviewed expressed the opinion that the City’s district-based method of electing Supervisors incentivizes members to focus on issues of parochial concern to their districts at the expense of the macro challenges –homelessness, housing affordability, public safety concerns, and the economic challenges facing Downtown – looming over the City as a whole. For example, based on their observations of and interactions with the Board, numerous respondents told us that:
• Supervisors spend more of their time addressing district or constituent issues than citywide policy issues
• The Board gives significant deference to individual Supervisors to delay, demand modifications, or block proposed housing and other development projects that are located in their districts, even though doing so may not serve the interests of the City as whole
• The Board is more responsive to the public policy demands of well-connected interest groups than to the policy preferences of average San Franciscans
Several leaders, including a majority of the former Supervisors consulted for this report, expressed the view that a different electoral system might better serve the City’s needs.
Mayor’s Powers
Although San Francisco has opted for a “strong mayor” form of government and placed expectations on the Mayor to provide executive leadership, it has contradicted that institutional
76 Mike Ege, “Frustrated San Francisco Voters Poised
choice in various ways. The 1996 Charter was originally designed to invest power in the Mayor, but a subsequent series of charter amendments has reduced those powers. Today, the Charter blurs executive authority in City Hall by limiting the Mayor’s authority to appoint and remove members of commissions, by granting the Board of Supervisors appointment authority, and by giving commissions significant power over many city departments. The Charter also limits the Mayor’s capacity to manage city government by placing constraints on mayoral hiring.
A few of the leaders we interviewed expressed the view that the Mayor’s office has enough institutional resources to lead effectively if the Mayor is politically skilled. A larger number, however, said that the City’s institutional design undermines the Mayor’s ability to govern. One stated: “Over the past 25 years, the powers of the Mayor have been methodically chipped away.” Another said, “Over the past 20 years there has been a slew of charter amendments moving power to the Board of Supervisors.” Several pointed to the Mayor’s limited ability to control commissions that oversee city departments, in part due to the Board of Supervisors’ increasing power over the appointment of commissioners, and in part due to the Mayor’s inability to remove commissioners and department heads.
As we noted above in our discussion of the commission system, the Board of Supervisors has proposed and the voters have adopted numerous charter amendments that reduce the Mayor’s power and increase the Board’s power to appoint members of important city commissions. More specifically, the affected commissions include the Planning Commission (Proposition D, March 2002), Police Commission (Proposition H, November 2003), Municipal Transportation Agency (Proposition D, November 2005), Public Utilities Commission (Proposition E, June 2008), Historic Preservation Commission (Proposition J, November 2008), and Building Inspection Commission (Proposition B, June 2022). The Board has also proposed ballot measures to create new commissions to oversee departments that were formerly under more direct control of the Mayor or City Administrator, including a new Sanitation and Streets Commission (Proposition B, November 2020), Public Works Commission (same), and Homeless Oversight Commission (Proposition P, November 2022).79
Election,” San Francisco Standard, October 31, 2022, https://sfstandard.com/politics/ frustrated-san-francisco-voters-poised-to-flip-the-script-this-election/
77 J. D. Morris, “Here’s how bad the job performance rating is for S.F. supervisors,” San Francisco Chronicle, September 13, 2022, https://www.sfchronicle.com/sf/article/ sfnext-poll-sf-supervisors-17430978.php. The poll found that only 12% of residents thought the Board was doing an excellent or good job, whereas 40% thought the Board was doing a poor or very poor job.
78 Mark Baldassare, Dean Bonner, Rachel Lawler, and Deja Thomas, PPIC Statewide Survey: Californians and Their Government, (San Francisco: Public Policy Institute of California, February 23, 2023), https://www.ppic.org/publication/ppic-statewide-survey-californians-and-their-government-february-2023/
79 For detail on these measures, see individual voter information pamphlets at San Francisco Department of Elections, San Francisco Voter Information Pamphlets and Ballots, n.d. Accessed May 14, 2023, https://sfpl.org/locations/main-library/government-information-center/san-francisco-government/san-francisco-1/san
V. ASSESSMENT OF CURRENT DESIGN
to Flip the Script This
26
The Police Commission and Planning Commission again offer good examples of how the Mayor’s powers have been scaled back over time. Prior to 2003, the Police Commission was structured to be fully accountable to the Mayor. At the time, the Police Commission consisted of five members appointed by the Mayor. These appointments were not subject to Board confirmation, but the Board, by a 2/3 vote, could reject an appointee. Commissioners served a four-year term, but the Mayor could remove commissioners at any time and for any reason. In 2003, the Board placed on the ballot and the voters passed Proposition H, which significantly restructured the Commission, giving the Board far greater control over the appointments process. As noted above, under the current structure, the Commission consists of seven members. Instead of the Mayor appointing all commissioners, the Mayor may nominate only four of the seven members, who also require confirmation by a majority of the Board. The remaining three commissioners are nominated by the Board’s Rules Committee and confirmed by the Board. Whereas previously the Mayor could remove her appointees at will, now mayoral appointees may only be removed with a vote of a majority of the Board.80
The Mayor’s authority over the Planning Commission was similarly reduced. Under the 1996 Charter, the Mayor appointed all seven commissioners, who were automatically confirmed unless the Board rejected them by a two-thirds vote, and the Mayor could remove commissioners at will. However, in 2002 the Board placed a charter amendment on the ballot, which the voters approved, drastically undercutting the Mayor’s
appointment powers. Under the new charter requirements, the Mayor nominates four members and the Board President nominates three, and all nominees may be approved or rejected by a majority vote of the Board. Planning Commissioners may now be removed only for official misconduct.81
Each of these changes has further diluted the Mayor’s ability to direct the executive branch, including her authority over department heads who are often nominated or subject to removal by their oversight commission. One leader we interviewed said, “We need to let the Mayor do her job; we have screwed up the Mayor’s appointment powers.”
An additional concern is the level of staff resources in the Mayor’s office. If the Mayor is expected to provide executive leadership to the City, the Mayor requires a team of sufficient size and expertise to meet the responsibility. The Charter’s limitations on the Mayor’s staff, including the prohibition on the appointment of deputy mayors and the cap on compensation of any mayoral staffer, represent a reluctance to resource the office.82 A number of the respondents we interviewed emphasized this topic. One interviewee said, “If we believe the Mayor should be responsible — if we want the Mayor to be a CEO — we need to consider how the Mayor’s office should be sized to carry that out. Currently, the office isn’t built to drive day-to-day operations.” Another concurred: “We need to build up the Mayor’s office to have a larger staff to be able to manage things.”
https:// webbie1.sfpl.org/multimedia/pdf/elections/March5_2002.pdf; see also Charter of the City and County of San Francisco, Art. IV, § 4.105.
82 Charter of the City and County of San Francisco, Art. III, § 3.100(12).
V. ASSESSMENT OF CURRENT DESIGN
80 San Francisco Department of Elections, Voter Information Pamphlet, November 4, 2003 Consolidated Municipal Election, “Digest for Proposition H,” https://webbie1.sfpl. org/multimedia/pdf/elections/November4_2003.pdf. See also Charter of the City and County of San Francisco, Art. IV, § 4.109. 81 San Francisco Department of Elections, Voter Information Pamphlet And Sample Ballot, March 5, 2002 Consolidated Primary Election, “Digest for Proposition D,”
“
27
“IF WE BELIEVE THE MAYOR SHOULD BE RESPONSIBLE — IF WE WANT THE MAYOR TO BE A CEO — WE NEED TO CONSIDER HOW THE MAYOR’S OFFICE SHOULD BE SIZED TO CARRY THAT OUT. CURRENTLY, THE OFFICE ISN’T BUILT TO DRIVE DAY-TO-DAY OPERATIONS.”
Commission System
In our interviews, several respondents noted positive features of the commission system. The most prominent benefit is that commissions provide a forum for a large amount of public input on the City’s policies and programs. Citizens are invited to fill more than 1,200 positions on the City’s long list of commissions, thus allowing many concerned and interested people to take part in governing San Francisco. Most of the commissioner positions are unpaid and those that are paid, pay very little, although some commission members receive health care coverage for their service. Members of the Planning Commission, for example, are compensated only about $10,000 a year for a workload that can be close to a full-time job.83 Nevertheless, many San Franciscans are willing to take these positions, offer their expertise, and help govern the City.
Commissioner involvement is only one aspect of public input. Among the powers and duties enumerated in the Charter for boards and commissions is the power to hold hearings and take testimony.84 This is an important way for the general public to provide comment and criticism on city programs. San Francisco’s 55 decision-making commissions alone encompass a vast range of subject matter, including the airport, arts, buildings, the environment, entertainment, fire, police, immigration rights, libraries, public utilities, public works, sanitation, and small business. Commissions absorb
and transmit public sentiment to the executive branch and to the Board of Supervisors on these subjects and many more. As one interviewee said, “The commission system does allow for a remarkable amount of public input and engagement.” Another said, “Commissions defuse lots of potential problems by holding hearings on all kinds of issues. People want to be able to complain to citizen commissioners. If you didn’t have a place for people to go, they might go to the Board of Supervisors.”
Another noted that public comment through commissions helped to surface conflicts or problems early in the process of policy development. San Francisco has long valued active (and activist) participation in the life of the City and commissions are one mechanism to channel that input and participation.
Finally, some commissions serve an important oversight role. The Board of Appeals, for example, “hears and decides appeals from departmental decisions involving the grant, denial, suspension, or revocation of permits, licenses, variances, zoning administrator determinations, and other use entitlements by various commissions, departments, bureaus, agencies, and officers of the City.”85 Similarly, the Police Commission “is the oversight and policy-making body for the Police Department and the Department of Police Accountability. The Commission also adjudicates discipline cases involving sworn members of the Police Department.”86 Both of these commissions operate
83 Mike Ege, “Explainer: San Francisco Has 100 Boards and Commissions. Why?” San Francisco Standard, March 31, 2022, https://sfstandard.com/politics/city-hall/ explanier-san-francisco-boards-and-commissions/
84 Charter of the City and County of San Francisco, Art. IV, § 4.102(10).
85 Burk E. Delventhal and Paul Zarefsky, Mayoral Appointments to and Seats on Boards, Commissions, and Other Bodies; and Related Matters. (San Francisco: Office of the City Attorney, July 11, 2018).
86 Delventhal and Zarefsky, Mayoral Appointments.

V. ASSESSMENT OF CURRENT DESIGN
28
as judicial bodies to hear and decide appeals (Planning) and adjudicate disciplinary cases (Police). They thus serve as a check on those executive departments. One of the interviewees noted, “When it is working well, the commission system can allow for more specialization in oversight than can happen at the Board of Supervisors level.”
At the same time, many interviewees were sharply critical of the commission system. Some noted that the large number of commissions, with an array of differing methods for appointments and operations, is confusing. Back in 2017, the City Attorney’s office highlighted this problem in its compilation of the City’s boards and commissions.87
As noted above, San Francisco’s commissions are filled by more than 1,200 appointees, most of whom need some support from city staff. The sheer number is a drain on staff resources. Former City Hall staffers shared that the process of identifying, vetting, and selecting that many commissioners requires a huge expenditure of staff time and attention. One of the leaders we interviewed said, “The care and feeding of the commissions requires a lot of Mayor, Board, and staff time. They’re all forced to devote a lot of time and effort to managing this apparatus rather than managing operations.”
The most serious criticism of the commission system is that it seriously curtails executive authority. We could cite many examples but will confine our discussion to three. First, the Charter ties the Mayor’s hands with respect to appointing department heads. The Charter states that, unless otherwise provided, “each appointive board, commission or other unit of government of the executive branch of the City and County shall: … submit to the Mayor at least three qualified applicants, and if rejected, to make additional nominations in the same manner, for the position of department head, subject to appointment by the Mayor.”88 Thus, for many departments, the Mayor can choose the top official only from a list provided by the commission. This is not the way most cities and political jurisdictions operate. We have a long tradition in this country of the chief executive appointing his or her own cabinet to execute the administration’s policies.
A second example relates to the Mayor’s power to remove officials. The Charter states that “the Mayor may recommend removal of a department head to the commission, and it shall be the commission’s duty to act on the Mayor’s recommendation
by removing or retaining the department head within 30 days[.]”89 Thus the mayor cannot fire most department heads without the agreement of the commission.
The third, related way that the commission system weakens the Mayor is that the Mayor lacks full control of commission appointments. In many cases, the Charter or an ordinance assigns to the Board of Supervisors or other departments or entities the power to appoint commissioners. And many of the appointments the Mayor does have are subject to approval by the Board of Supervisors.
The fact that the Mayor lacks direct control over many departments and commissions results in muddled lines of authority and accountability. One interviewee said, “The commission system is distracting. It leads to policy non-alignment.” Many interviewees advocated giving the Mayor direct authority over department heads and most commissions and then holding the Mayor accountable for the results.
Several interviewees also noted that the commission system does not always succeed in its oversight responsibilities, pointing to the recent corruption scandal in the Department of Building Inspection.
Ballot Measures
Direct democracy is deeply embedded in San Francisco’s political culture. For more than a century, the City’s residents have been able to vote directly on hundreds of local policy questions. Like citizens throughout the state, many San Franciscans cherish this power.90 We consider the people’s right to vote on ballot measures to be foundational to the City’s governance system—and, on balance, a beneficial feature. At the same time, San Francisco’s heavy use of the process has produced negative consequences.
As documented above, San Francisco’s permissive ballot access rules for measures placed on the ballot by citizens, through petition, and by city officials have resulted in far more measures on the ballot in San Francisco than in peer jurisdictions.
A first-level consequence is that the City’s long ballot (with local San Francisco measures layered on top of state propositions) can overwhelm many voters. In November 2022, for example,
87 The City Attorney’s Office prepared this list in response to the Civil Grand Jury’s June 2014 report entitled “Survey of San Francisco Commission Websites.” That report found that “[there is no easy reference to all of the commissions in San Francisco,” and recommended that the City Attorney compile a list annually. See Dennis J. Herrera, List of City Boards, Commissions, and Advisory Bodies Created by Charter, Ordinance, or Statute. (San Francisco: Office of the City Attorney, last updated August 25, 2017).
88 Charter of the City and County of San Francisco, Art. IV, § 4.102(5).
89 Charter of the City and County of San Francisco, Art. IV, § 4.102(6).
90 See Mark Baldassare, Reforming California’s Initiative Process (San Francisco: Public Policy Institute of California: October 2013), https://www.ppic.org/wp-content/ uploads/content/pubs/atissue/AI_1013MBAI.pdf (statewide survey finding that 72% of respondents said that, “in general, it is a good thing … that a majority of voters can make laws and change public policies by passing initiatives[.]”
V. ASSESSMENT OF CURRENT DESIGN
29
San Franciscans were presented with 14 local measures, on topics including: adjustments to city employee pensions; the creation of a homelessness oversight commission; two competing plans for facilitating construction of affordable housing; an extension of property taxes to fund public libraries; an extension of a sales tax to fund transportation programs; the imposition of a new tax on owners of vacant residential properties; and the establishment of a new parcel tax to fund San Francisco City College. The City’s Voter Information Pamphlet, which summarized the measures and presented their full text, was 239 pages long.91 In addition to these city measures, San Francisco voters were asked to vote on seven statewide propositions, which were presented to voters in the state’s 128-page Official Voter Information Guide.92 And the General Election ballot was less formidable in 2022 than many other years. In November 2016, for example, San Franciscans were asked to vote on 25 local measures and wade through a 303-page local Voter Information Pamphlet, on top of 17 statewide ballot propositions, presented in a 224-page state Voter Information Guide — for a cumulative total of 42 propositions and 527 dense pages of ballot information.93 It is reasonable to ask whether the system is demanding too much of the average voter.
More critically, San Francisco’s ballot system has contributed to the City’s governance struggles. The cumulative effects of the adoption of hundreds of ballot measures over time has been to lock in multiple layers of policies that constrain City Hall’s ability to adapt to changing circumstances. As noted above, San Francisco’s ballot measure system prevents the Board of Supervisors from amending voter-approved ballot measures, unless the measure itself expressly provides for future Board amendment. Instead, an ordinance enacted by the voters can be amended or repealed only by placing the question back on the ballot. The practical effect of this rule is that many policies and programs cannot easily be changed, which constrains City Hall’s ability to respond to current conditions.
This feature of direct democracy is especially problematic in the area of fiscal policy. Scholars have written extensively about “ballot box budgeting”— that is, the ability of voters to enact
(and lock in) ballot measures that impose (or limit) taxes or mandate (or cap) spending.94 These policies are adopted in an ad hoc way, with voters approving a specific tax (or tax limitation) or a spending mandate (or cap) without having to consider the trade-offs inherent in the budgeting process. Voters often approve measures that impose a discrete tax or fund a popular program, without taking into account the long-term, aggregate implications of their choice. In San Francisco today, the cumulative effects of ballot box budgeting are clear to see. According to the Mayor’s 2020-2021 and 2021-2022 Proposed Budget, more than one-third of the City’s General Fund is set-aside “due to voter-approved minimum spending requirements.”95
According to a San Francisco Chronicle analysis, ballot measure set-aside spending increased from $200 million in 1994-1995 to $1.6 billion in 2017.96 Similarly, much of the City’s tax policy has been determined by individual ballot measures. In the past decade alone, 21 different local tax measures have appeared on the San Francisco ballot.
Several leaders we interviewed focused on this problem. One said, “A large share of the budget has been taken over by ballot box budgeting. Actually only about one-half to one-third of the budget is truly discretionary.” Several respondents focused on the ease with which proponents can place tax measures on the ballot. One stated, “We’ve seen a lot of popular but strange tax proposals. They’re designed to pass rather than create solid tax design.” Others expressed concern about the overall number of tax increase proposals and the cumulative effect on the City’s economic competitiveness.
California’s requirements for adopting local tax measures are complex. In 1996, California voters approved Proposition 218, a state constitutional amendment that increased the requirements for local tax hikes. Prop. 218 requires local government bodies to refer increases in taxes or property-related fees, assessments, and charges to voters for their approval.
Proposed increases in “general” taxes (that is, taxes that are intended for general government purposes rather than for specific purposes) require only simple majority voter approval, whereas proposed increases in “special” taxes (that is, taxes
91 San Francisco Department of Elections, Voter Information Pamphlet and Sample Ballot: November 8, 2022
Consolidated General Election, https://sfpl.org/sites/default/ files/2022-10/N22_SFVIP_EN.pdf
92 California Secretary of State, Official Voter Information Guide: California General Election, Tuesday November 8, 2022, https://vig.cdn.sos.ca.gov/2022/general/pdf/ complete-vig.pdf
93 San Francisco Department of Elections, Voter Information Pamphlet and Sample Ballot: Tuesday, November 8, 2016
Consolidated General Election, https://webbie1.sfpl.org/ multimedia/pdf/elections/November8_2016.pdf; California Secretary of State, Official Voter Information Guide: California General Election, Tuesday, November 8, 2016, https://vig.cdn.sos.ca.gov/2016/general/en/pdf/complete-vig.pdf
94 See, e.g., Jessica A. Levinson and Robert M. Stern, “Ballot Box Budgeting in California: The Bane of the Golden State or an Overstated Problem?” Hastings Constitutional Law Quarterly 37, no. 4 (Summer 2010): 689-744.
95 London N. Breed, Proposed Budget: Fiscal Years 2021-2022 and 2022-2023 (San Francisco: Mayor’s Office of Public Policy and Finance, July 2020): 54, https://sfmayor. org/sites/default/files/FY22%20and%20FY23%20Budget%20Book%20Final%20for%20Web.pdf.
96 Dominic Fracassa, “SF examines impacts of its many budget set-asides,” SFGate, September 28, 2017, https://www.sfgate.com/bayarea/article/SF-examines-impactsof-its-many-budget-set-asides-12239112.php
V. ASSESSMENT OF CURRENT DESIGN
30
that raise revenues dedicated to specific purposes) require two-thirds voter approval.97
In recent years, a dispute emerged over whether citizen-initiated local tax increases for special purposes fall outside Prop. 218’s two-thirds vote requirement. In 2017, the California Supreme Court held that citizen-initiated local tax increases should be treated differently than tax increases referred to voters by local governments.98 Subsequent litigation, including unsuccessful challenges to two 2018 citizen-initiated San Francisco special tax measures that won majority, but not two-thirds, support, seem to have settled the matter: All local tax measures placed on the ballot by citizen petition require only simple majority approval.99 This outcome underscores the possibility that an increasing number of citizen-initiated tax measures could impose further “ballot-box” constraints on San Francisco’s budget process and impair its ability to adapt to changing circumstances. (A proposition has qualified for the statewide 2024 ballot that would increase the vote requirements for approving local citizen-initiated tax measures, but the fate of that measure is uncertain.)

The ease with which elected officials can place measures on the ballot raises a separate concern. Over the past decade, the Board of Supervisors has been the largest source of ballot measures, many of which have been an extension of political conflict between members of the Board or between the Board and the Mayor. The ability of a minority of the Board of Supervisors, as few as four of the eleven, to access the ballot was a recurring issue in our interviews. Although minority-initiated measures account for only 10% of the total from the past decade, just the possibility that so few representatives can use ballot access to block a program or push their own policy objective, likely has the effect of constraining both the Board majority’s and the executive branch’s policy choices. •

97 Cal. Const. Art. III C and Art. XIII D. 98 California Cannabis
v.
3 Cal.5th 924 (2017). 99
V. ASSESSMENT OF CURRENT DESIGN “
Coalition
City of Upland,
See, e.g., City and County of San Francisco v. All Persons Interested in the Matter of Proposition C, 51 Cal.App.5th 703 (2020).
31
“WE’VE SEEN A LOT OF POPULAR BUT STRANGE TAX PROPOSALS. THEY’RE DESIGNED TO PASS RATHER THAN CREATE SOLID TAX DESIGN.”
OPTIONS FOR REFORM VI
Options for reform include:
1. Elections
• Re-establish at-large supervisorial elections

• Create a mixed district/at-large election system
• Use Proportional Ranked Choice Voting for at-large elections
2. Mayor’s powers
• Enhance the Mayor’s power to appoint and remove officials
• Increase Mayor’s staff so the office can manage city government more effectively
• Modify or eliminate restrictions on the Mayor’s hiring of staff, such as the prohibition on hiring deputy mayors
3. Commissions
• Reduce the number of commissions
• Increase Mayor’s power to appoint and remove commissioners
• Reduce or eliminate Board of Supervisors’ power to reject mayoral appointments
• Standardize rules for selection and removal of commission members
• Remove commission role in appointing and dismissing department heads
• Reform discretionary review process
4. Ballot Measures
• Increase signature requirement for citizen-initiated measures
• Eliminate the Board of Supervisors’s power to place measures on the ballot with less than a majority vote
• Eliminate Mayor’s power to place measures on the ballot
• Allow the Mayor to veto Board-sponsored ballot measures
• Allow a process for the Board of Supervisors and Mayor to amend certain ballot measures following voter approval
Overview
As a charter city and county, San Francisco has the ability to modify its electoral and governance systems. This section presents various options for reform. We begin with an in-depth analysis of alternative methods of election of San Francisco’s Board of Supervisors, followed by discussion of possible changes to the powers of the Mayor, the commission system, and the ballot measure process.
32
Electoral System: Board of Supervisors
For the past 25 years, San Francisco has elected its Board of Supervisors by district, a choice that has advantages, but also drawbacks. Although district elections ensure that Supervisors will come from diverse neighborhoods of the City and bring this perspective to the policymaking process, districts may also promote parochialism, where Supervisors focus primarily on the interests of their district, potentially to the detriment of the City at large. This section considers a range of alternatives for electing Supervisors in San Francisco. The section first compares the main types of local election systems used in California and nationally (traditional at-large and district) by evaluating the trade-offs associated with each system, particularly as related to a system’s potential effects on (1) legislation and public policy, (2) Board diversity, and (3) supervisorial campaigns. The section then presents the option of “hybrid” or mixed systems that would elect some Supervisors by district and others at large as a way to balance the benefits and costs of at-large and district election systems. Finally, the section considers the option of Proportional Ranked Choice Voting (PRCV) for supervisor elections. In 2004, San Francisco pioneered the modern usage of Ranked Choice Voting (RCV) in local U.S. elections. This section considers whether PRCV, the at-large form of RCV, might produce a representative Board of Supervisors with a greater focus on citywide concerns. Our discussion assumes maintaining the Board at or near its current size of 11 members.
At-Large vs. By District Systems
Legislative and Policy Effects
Many of the stakeholders interviewed for this report complained that San Francisco’s Supervisors are too narrowly focused on district issues at the expense of larger city issues. This section examines how election systems affect legislator behavior in office.
100 Welch and Bledsoe, Urban Reform,” 64.
Council member representational focus
Survey research of council members across the United States over the decades has found that council members perceive their role somewhat differently depending on how they were elected. One of the largest such studies, which surveyed nearly 1,000 council members in U.S. cities with more than 50,000 residents, found that at-large council members were far more likely than district council members to report having a citywide perspective: 89% of at-large members said representing the city as a whole was a focus of theirs (and 51% said it was their “primary” focus), compared with only 72% of district council members calling the city a focus (and only 15% a primary focus). On the other hand, 73% of district council members reported having a neighborhood focus, compared with only 22% of at-large members.100 Very similar results were found in a 1994 Texas study and a 2016 Canadian study, suggesting this is a stable pattern.101
Neighborhood versus city orientation also affected how council members spent their time. The Texas study found that district council members spent 22% more of their time on constituent service than at-large members; other studies have found a similar but more modest discrepancy.102 Several of the stakeholders we interviewed shared their impression that Supervisors spend more time on constituent and district issues than citywide policy.
Board dynamics
A few studies have found that city councils whose members are elected by district report somewhat more council conflict than in cities where all council members are elected at large.103 District council members are each elected from different constituencies which may have different preferences and priorities; at-large council members are elected from the same constituency (the whole city) so are more likely to share perspectives on city priorities. Less conflict may make at-large councils more effective at enacting and implementing policy; however, it may also mean that certain perspectives are being ignored in the policymaking process, which might lead to worse policy or more inequitable policy.
Overall policy effects
There is no strong evidence that the choice of a local electoral system itself pushes policy in a more liberal or conservative
101 J. L. Polinard, Robert D. Wrinkle, Tomas Longoria, and Norman E. Binder, Electoral Structure and Urban Policy: The Impact on Mexican American Communities (Armonk, N.Y.: M.E. Sharpe, 1994): 71 (87% of district council members were motivated to run to represent their district compared with 79% of at-large members); Royce Koop and John Kraemer, “Wards, At-Large Systems and the Focus of Representation in Canadian Cities,” Canadian Journal of Political Science 49, no. 3 (September 2016): 443-448 (95% of at-large members focus on the city as a whole compared with 73% of district members; 21% of at-large members focus on geographic areas compared with 70% of by district).
102 Welch and Bledsoe, Urban Reform, 73; Polinard, et al., Electoral Structure, 83. See also James C. Clingermayer and Richard C. Feiock, Institutional Constraints and Policy Choice: An Exploration of Local Governance (Albany: State University of New York Press, 2001), 57 (finding district members spend more time on constituent work but only because they receive more requests for assistance).
103 Welch and Bledsoe, Urban Reform, 97; Polinard, et al., Electoral Structure, 86-87.
VI. OPTIONS FOR REFORM
33
direction. One recent study of every city with a population over 20,000 found that, overall, city council policy positions mostly align with the policy preferences of the city electorate and that electoral structure had “little consistent impact on policy responsiveness.”104 Some earlier scholarship found that district elections might lead to more liberality in public spending, perhaps because district council members are more incentivized to fight for resources (or “pork”) for their district.105 However, recent studies have failed to find statistically significant differences in local spending between cities based on their local electoral system.106
Policy effects: policing
The evidence is similarly inconclusive when it comes to many major municipal functions, such as policing. One study from 2005 found that cities with councils elected by district hired larger police forces;107 however, a 2012 study found that, after controlling for socioeconomic factors, electoral structure had no predictive effect on force size.108 A 2003 study of 1991 crime statistics in 958 cities found that at-large cities had significantly higher crime rates than by district cities after controlling for other factors like poverty. The author speculated that this “may be because district-based political representation enhances the responsiveness of local governments, which may in turn, lead to policies that reduce violent crime.”109 However, a 2011 longitudinal study looking at crime rates
in 280 cities over a 20-year period failed to replicate these findings: after controlling for factors like poverty, local electoral structure again had no statistically significant effect on crime rates.110
Based on the foregoing, it is not clear that Board structure will strongly incentivize any particular approach to policing, except that an at-large Board may be more responsive to citywide voter preferences on policing policy.
Policy effects: housing and homelessness
On the other hand, one area where studies consistently find that electoral structure affects policy is with respect to land use decisions. District council members are strongly incentivized to oppose projects that impose significant costs (or perceived costs) on the immediate neighbors of the project, even if the project going forward would be of greater benefit to the city overall.
For example, a 1994 study found that cities with by district elections were “strongly associated with the exclusion of group homes” serving juvenile offenders, recovering drug users, and people with developmental disabilities in their municipal zoning ordinances, compared with at-large cities which were more likely to allow these facilities.111
More recent studies have found that local electoral systems can have a strong impact on housing production. For example,
104 Chris Tausanovitch and Christopher Warshaw, “Representation in Municipal Government.” American Political Science Review 108, no. 3 (August 2014): 605.
105 Richard T. Boylan, “The Impact of Court-Ordered District Elections on City Finances,” Journal of Law and Economics 62, no. 4 (2019): 633–61 and Lynn MacDonald, “The Impact of Government Structure on Local Public Expenditures,” Public Choice 136, no. 3/4 (2008): 457–73.
106 MacDonald, “Impact of Government Structure,” 457.
107 Thomas D. Stucky, “Local Politics and Police Strength,” Justice Quarterly 22, no. 2 (June 2005): 139.
108 Jihong Zhao, Ling Ren, and Nicholas P. Lovrich, “Political Culture Versus Socioeconomic Approaches to Predicting Police Strength in U.S. Police Agencies: Results of a Longitudinal Study, 1993-2003” Crime & Delinquency 58, no. 2 (2012).
109 Thomas D. Stucky, “Local Politics and Violent Crime in U.S. Cities,” Criminology 41, no. 4 (2003): 1101-1136.
110 Jihong Zhao, Ling Ren, and Nicholas P. Lovrich, “Local Political Structures and Violent Crime in U.S. Cities: Patterns of Association in a Longitudinal Panel Study,” Criminal Justice Policy Review 22, no. 4 (2011): 448.
111 James C. Clingermayer, “Electoral Representation, Zoning Politics, and the Exclusion of Group Homes,” Political Research Quarterly 47, no. 4 (December 1994): 969–84.
VI. OPTIONS FOR REFORM
34
ONE AREA WHERE STUDIES CONSISTENTLY FIND THAT ELECTORAL STRUCTURE AFFECTS POLICY IS WITH RESPECT TO LAND USE DECISIONS. DISTRICT COUNCIL MEMBERS ARE STRONGLY INCENTIVIZED TO OPPOSE PROJECTS THAT IMPOSE SIGNIFICANT COSTS (OR PERCEIVED COSTS) ON THE IMMEDIATE NEIGHBORS OF THE PROJECT, EVEN IF THE PROJECT GOING FORWARD WOULD BE OF GREATER BENEFIT TO THE CITY OVERALL.
a 2022 study of 238 cities that had converted from at-large to by district elections between 1980 and 2018 found that the number of housing units permitted decreased by 20% on average, with larger effects in whiter and higher-income cities.112 Cities with districts may be more likely to impose conditions on development, which might help to offset the impacts to affected communities, but raise the costs of development. For example, a 2008 study of Florida counties found that county commissions elected by district were more likely to adopt development impact fees, which increases the cost of development and may result in fewer or smaller projects overall, than county commissions elected at large.113
If a project benefits the city as a whole (e.g., by alleviating the housing unit shortage), why wouldn’t the other district council members outvote the objecting member whose district includes the project to approve it, especially since the costs do not spill into their districts? There are two leading explanations, both of which may apply in San Francisco. It could be that by district councils are more likely to adopt restrictive zoning and development rules from the start that make it slower and more difficult to build projects that receive significant public opposition. San Francisco, for example, has the longest permitting process in the State and is the only city to permit any person to appeal a building permit after a project has already been entitled.114
Another theory is that permitting decisions on major projects are frequently appealed to the city council, and district council members may defer to the councilmember in whose district the project is located so that the same deference will be extended to them on projects in their districts, in essence giving each Supervisor a veto over district projects. The stakeholders we spoke with all agreed that some type of “supervisorial privilege” exists in San Francisco which could stop, slow down, or require modifications to a project. Developers felt that supervisorial privilege is pervasive and has had a deeply chilling effect on housing production in the City. However, the former Supervisors we interviewed disagreed as to how significant of an impediment this was to permitting housing. Some felt it was very significant, whereas others felt this privilege was generally only respected for less consequential projects.
On the other hand, while at-large cities may be more likely to permit multi-family housing and beneficial but locally unwanted land uses (LULUs), there is some evidence that they are less likely to equitably distribute the burdens of these projects. A 2023 study looking at 60 California cities that transitioned from at-large to by district elections found that the switch led to a significant decrease in the permitting of multifamily housing, especially in racially segregated cities, where permitting decreased by more than 70%. However, in looking closely at where multifamily housing was permitted in a six city subsample, the authors found that multifamily permitting, although decreasing overall, became more equitably distributed across a city after the adoption of districts. Under at-large elections, cities permitted 36% more multifamily housing in minority neighborhoods than white neighborhoods, but after the adoption of districts there was no statistically significant difference between White and minority neighborhoods in where housing was permitted. From these findings, the authors concluded that “at-large representation may facilitate the production of goods with diffuse benefits and concentrated costs, but it does so by forcing less politically powerful constituencies to bear the brunt of those costs.”115
While the effects of transitioning from an at-large to a by district election system have been well studied, the converse, a transition from by district to at-large, has not. These types of conversions are rare in the past half century; most large cities, in particular, have instead converted to district or mixed systems to provide greater neighborhood representation or to resolve or avoid the risk of voting rights litigation. One of the studies cited above, which found that conversion from at-large to by district elections immediately decreased the number of units a city permitted, also found that for those (few) jurisdictions that went from by district to at-large the number of units stayed about the same.116 This may suggest that restrictions on development take longer to remove than to impose. It may also be that board culture changes faster when a jurisdiction adopts districts than when it removes them, possibly because of higher incumbent turnover rate in the former case. When a council first adopts districts, incumbents who live close together may be drawn into a district, leading to the defeat or resignation of at least some previously at-large incumbents. By contrast, when going from district to at-large, there is no structural
112 Evan Mast, “Warding Off Development: Local Control, Housing Supply, and NIMBYs,” Review of Economics and Statistics (May 2022): 1. https://doi.org/10.1162/ rest_a_01192
113 Richard C. Feiock, Antonio F. Tavares, and Mark Lubell, “Policy Instrument Choices for Growth Management and Land Use Regulation,” Policy Studies Journal 36, no. 3 (July 2008): 461. Mark Lubell, Richard C. Feiock, and Edgar E. Ramírez De La Cruz, “Local Institutions and the Politics of Urban Growth.” American Journal of Political Science 53, no. 3 (July 2009): 649.
114 Heather Knight, “‘It’s insane’: Only-in-S.F. tactic,” San Francisco Chronicle, February 23, 2023, https://www.sfchronicle.com/sf/bayarea/heatherknight/article/matthaney-housing-appeals-17799039.php
115 Michael Hankinson and Asya Magazinnik, “The Supply–Equity Trade-off: The Effect of Spatial Representation on the Local Housing Supply,” Journal of Politics (forthcoming).
116 Mast, “Warding Off Development,” 15.
VI. OPTIONS FOR REFORM
35
impediment to all previously by district incumbents running for and winning reelection at large.
Policy effects: downtown focus
At-large elections would likely lead to a greater policy emphasis on Downtown issues, particularly since Downtown is the economic driver of the City. In our interviews, stakeholders shared their perception that non-Downtown Supervisors had less of an understanding or interest in the challenges facing the financial district. (For a non-Downtown Supervisor, taking an active role in planning and other decisions uniquely affecting Downtown may also be risky, as it might invite Downtown members to then interfere in their own district.) When San Francisco previously had at-large elections, a recurring criticism by anti-growth activists and others was that it had led to an overemphasis on Downtown and business interest perspectives.117 An example of this policy emphasis may be the explosive growth in Downtown high-rise construction from the 1960s to the mid 1980s — dubbed the “Manhattanization” of San Francisco by critics — when elections were mostly held at large.118
Risk of unrepresentative results
Both election systems have features that can cause them to produce unrepresentative electoral results. District elections are uniquely susceptible to gerrymandering, which is when district boundaries are manipulated to give one party or group
an unfair electoral advantage. This is generally done through either “cracking” or “packing.” Cracking is when a group of voters is divided up and spread across several different districts to dilute its voting power, making it less able to win any seat. Packing is when a group is concentrated into just a few districts, so that it wins fewer seats overall. For example, if 60% of the electorate votes for the green faction and 40% of the electorate for the purple faction, we might expect green to win three seats and purple two seats on a five-member legislative body. However, depending on the geography of the jurisdiction, it may be possible to draw districts where the minority (purple) has no representation, or, conversely, where the minority is overrepresented and even controls the legislative body instead of the majority (green) (See Figure 1.).
Gerrymandering is often considered primarily a problem of state or federal partisan politics. However, although local elections are nonpartisan, in many large cities the redistricting process can be heavily contested between political factions seeking to gain an advantage through the placement of district boundaries.119 “[I]t is hardly surprising that a faction or coalition of factions in control of a local legislature’s redistricting process might attempt to draw lines to its own advantage and to the detriment of its opponents’ electoral prospects,” explained a California redistricting scholar.120 Local gerrymandering, especially incumbency-protection gerrymandering but also partisan
https://www.nytimes.com/1985/07/03/us/
VI. OPTIONS FOR REFORM
117 Richard E. DeLeon, Left Coast City, 49 and 51.
118 Richard E. DeLeon, Left Coast City, 51; Robert Lindsey, “Buildings Curbed by San Francisco,” New York Times, July 3, 1985,
buildings-curbed-by-san-francisco.html
119 Bruce Cain and David Hopkins, “Mapmaking at the Grassroots: The Legal and Political Issues of Local Redistricting,” Election Law Journal (2002): 517.
120 Cain and Hopkins, “Mapmaking at the Grassroots,” 517.
Figure 1. Examples of Different Electoral Outcomes Based on District Lines
50 PRECINCTS 60% GREEN | 40% PURPLE GREEN WINS 5 DISTRICTS 5 GREEN | 0 PURPLE PURPLE WINS 5 DISTRICTS 2 GREEN | 3 PURPLE 36
Source: Adapted from Steven Nass, “A chart illustrating gerrymandering in its most basic form,” Wikimedia Commons (February 22, 2015) (CC BY-SA 4.0).
or faction-based gerrymandering, has been extensively documented at the local level in California.121 San Francisco’s process, in particular, has been the repeated subject of political controversy and accusations of gerrymandering.122
Unlike most cities, San Francisco assigns redistricting to a Redistricting Task Force consisting of three Mayoral appointees, three Board appointees, and three Elections Commission appointees. However, Task Force members were accused this past cycle of taking direction from their appointing elected officials and the Task Force itself adopted a report decrying “unprecedented assaults on its independence by political actors” during the cycle.123
At-large election systems do not have districts, so are not susceptible to gerrymandering. However, plurality at-large elections may also produce politically unrepresentative results. Because voters in this system get as many votes as there are seats, if a majority that supports one faction votes cohesively as a bloc it may be able to win every available seat, effectively preventing a minority faction from winning any representation. Plurality at-large elections can also produce the opposite result if a political majority splits its vote between too many candidates, enabling a political minority to win more seats than its overall share of the vote.124
Summary of legislative and policy effects
In summary, district council members and at-large council members have different areas of focus, corresponding to the different constituencies they are accountable to. Council members elected at large take a more citywide view; district council members must be more attentive to neighborhood concerns. For most policies that have a citywide application, like policing, the choice of electoral structure is unlikely to have a significant effect; the underlying politics of the city or district will drive decision-making on that issue. However, if the policy preferences of the electorate in a majority of districts do not align with the policy preferences of a majority of the citywide electorate, possibly as a result of gerrymandering, then district and at-large systems may be expected to produce different results. One area where structure does clearly influence policy is housing: at-large cities are more likely to permit the construction of multi-family housing, but are less likely to equitably distribute this construction.
For San Francisco, this suggests that a move to at-large elections could be beneficial with respect to three of the four main policy crises facing the City. From existing research, we would expect that a Board elected at large would be more likely to: permit more housing, potentially over the objections of neighbors; permit more place-based supportive services, housing, or shelters for the unhoused community, potentially over the objections of neighbors;125 and prioritize Downtown revitalization given its importance to the City’s economic future, as the Board did in the 1970s and 1980s. As to the fourth priority, public safety, it is unclear that electoral structure would have a significant effect. A significant risk to returning to at-large elections, however, would be that the benefits and costs of addressing these crises will not be evenly distributed across City neighborhoods – which many residents felt was the case in the past, and powered the two campaigns for district elections. District elections are vulnerable to gerrymandering, a charge that has frequently been made against the City’s prior redistrictings, but at-large elections also risk producing unrepresentative outcomes, such as the over-representation of the majority due to bloc voting, or minority rule due to vote-splitting.
Effects on Board Diversity
Respecting and embracing diversity is a core value for San Franciscans. This section examines how local electoral structure may affect diversity on the Board of Supervisors.
Racial and ethnic representation
One of the primary criticisms of at-large election systems is that they can result in significant under-representation of racial minorities. In a traditional plurality-winner at-large election, the voter has as many votes as there are seats to be filled; as a result, a cohesively-voting racial majority group could elect every available seat. So, for example, in a city with a high degree of racially polarized voting, which is where voters of different racial groups sharply diverge in their candidate preferences, a 60% White electorate could elect 100% of its preferred city council candidates, preventing a 40% non-White electorate from electing any of its preferred candidates.
Districts, however, may promote more equitable representation in such cases, under certain conditions. If a city with
121 Cain and Hopkins, “Mapmaking at the Grassroots;” Nicolas Heidorn, California Local Redistricting Commissions: Landscape, Considerations, and Best Practices (Sacramento, CA: California Local Redistricting Project, 2017 Updated), https://sf.gov/sites/default/files/2023-03/CA_Local_Redistricting_Commissions_-_Aug_2017.pdf; Nicolas Heidorn, The Promise of Fair Maps: California’s 2020 Local Redistricting Cycle: Lessons Learned and Future Reforms, ACLU of Northern California et al. (January 2023), https://www.aclunc.org/ sites/default/files/ThePromiseofFairMapsreport.pdf
122 See, e.g., Rachel Gordon, “S.F. redistricting map OKd by task force,” San Francisco Chronicle, April 15, 2002; Rachel Gordon, “S.F. supervisors prepare for redistricting battle,” San Francisco Chronicle, January 17, 2011; Cain and Hopkins, “Mapmaking at the Grassroots,” 514; Heidorn, “The Promise of Fair Maps,” 73.
123 2021-2022 San Francisco Redistricting Task Force, “Final Report” (May 23, 2022); Heidorn, “The Promise of Fair Maps,” 73.
124 Douglas J. Amy, Behind the Ballot Box: A Citizen’s Guide to Voting Systems (Westport, CT: Praeger, 2000), 43, 59.
125 See, e.g., Trisha Thadani, “S.F. could kill plan for tiny homes for homeless due to ‘overwhelming’ backlash, ‘absurd’ costs,” San Francisco Chronicle, February 15, 2023, https://www.sfchronicle.com/sf/article/homeless-sf-tiny-cabins-mission-district-costs-17775286.php
VI. OPTIONS FOR REFORM
37
significant racial residential segregation is divided into districts, a racial group that is a minority of the citywide electorate could potentially be a majority, plurality, or more substantial percentage of the electorate in a given district, giving that group a better chance of electing a representative of its choice. Numerous studies have found that transitioning from at-large to by district elections increases the representation of racial minorities on city councils, provided that the minority population is large enough and meets a certain level of geographical compactness. For example, a 2008 national study found that cities with districts had on average 5% more Black and 1.5% more Latino council members than cities with at-large elections.126 The effect on minority representation was significantly larger where the Black and Latino population was geographically concentrated; however, at lower geographic concentrations, districts provided no greater minority representation than at-large elections (and resulted in somewhat worse Black representation).
California studies have found similar results. A 2021 study examined 30 California cities that had switched from at-large to by district elections and found that, on average, moving to by district elections increased the probability of a person of color being elected to a city council by 10% to 12%.127 However, these gains were highly dependent on the size of the minority community in each city. In cities where just over 40% of the population was Latino, the conversion to district elections increased minority representation on the city council by 21%; however, in cities below that threshold, minority representation increased by only 4%, below the level of statistical significance. Similarly, a 2020 study of California school district elections found that converting from at-large to district elections increased Latino representation on school boards where “Latinos constitute a sufficiently large share of the voting population, and in large and residentially segregated districts.” However, where the Latino community was more residentially integrated across the district, or where the Latino community constituted only a small fraction of the overall population, district conversion had no effect on increasing Latino representation on school boards.128
San Francisco’s own history of district elections provides mixed evidence for their effectiveness in promoting Board diversity. When San Francisco initially converted to districts in the 1970s, the number of Supervisors of color significantly increased. In the very first use of districts, San Franciscans elected the City’s first Black woman Supervisor and first Asian Supervisor. Although the Board reverted to at-large elections in the 1980s, the Board was fairly diverse for most of the 1990s. Some of this diversity was due to Mayor Willie Brown appointing diverse Supervisors to fill vacancies and those Supervisors going on to win re-election at large, albeit with the advantage of incumbency 129 Contrary to expectations, when San Francisco returned once more to using district elections in 2000, there was no significant change in Board diversity between the ten year period before and the ten year period after the switch. However, racial diversity
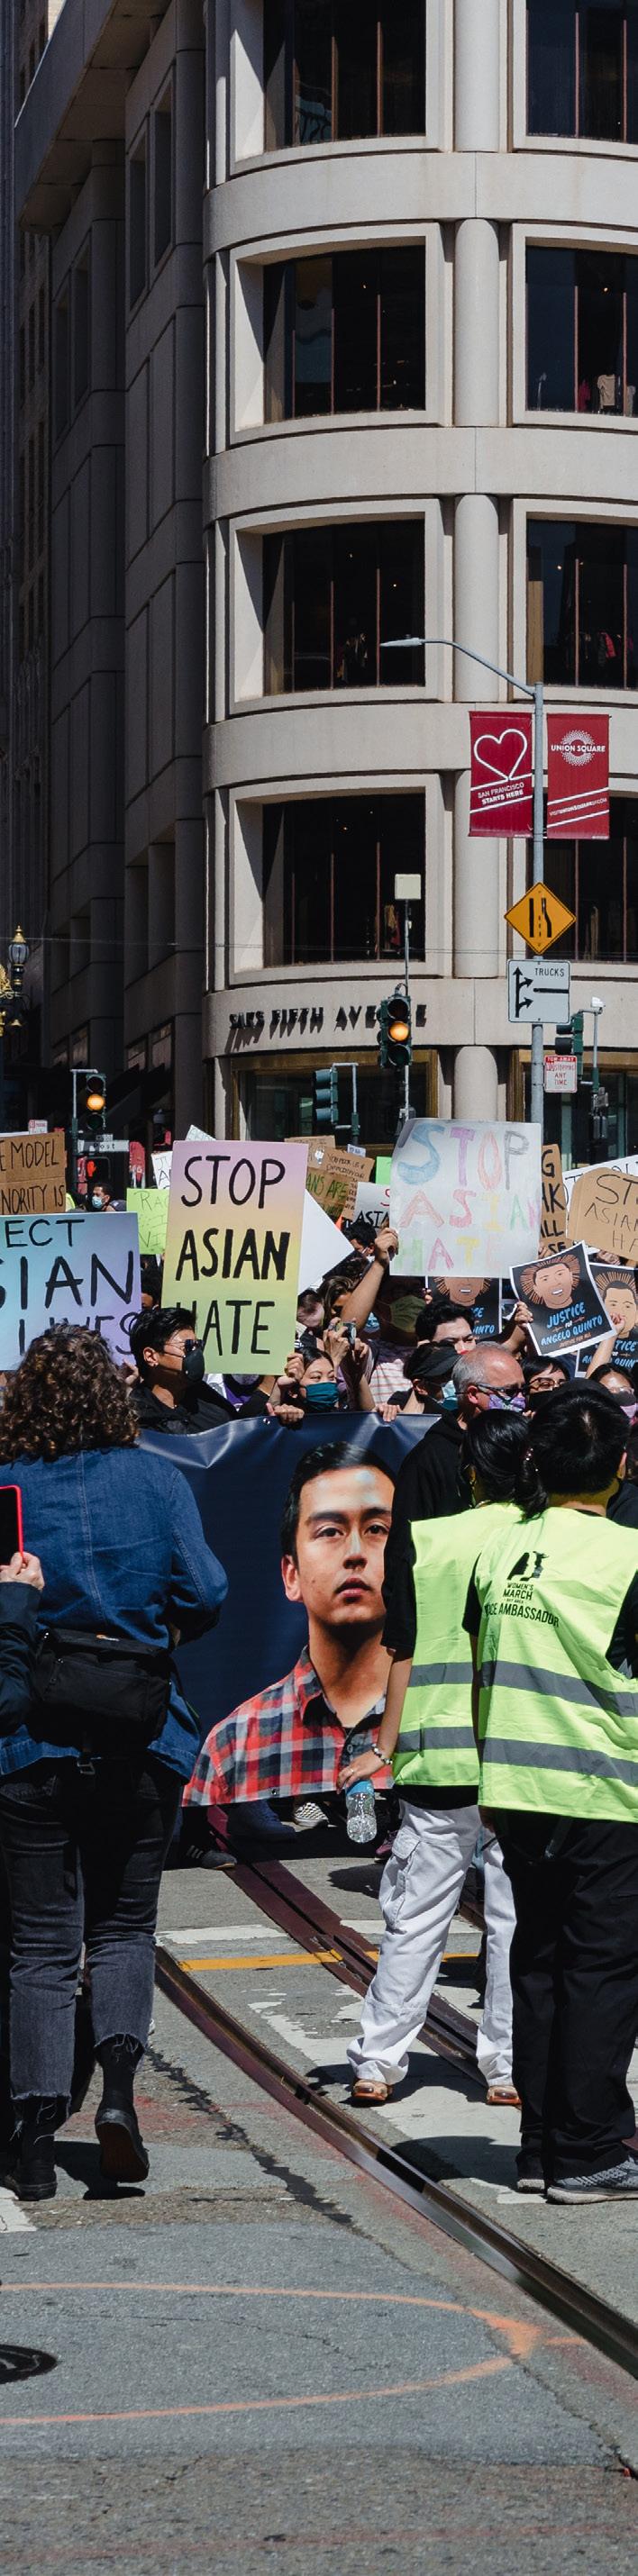
VI. OPTIONS FOR REFORM
126 Jessica Trounstine and Melody E. Valdini, “The Context Matters: The Effects of Single-Member versus At-Large Districts on City Council Diversity,” American Journal of Political Science 52, no. 3 (July 2008): 564.
127 Loren Collingwood and Sean Long, “Can States Promote Minority Representation? Assessing the Effects of the California Voting Rights Act,” Urban Affairs Review 57, no. 3 (May 2021): 731.
128 Carolyn Abott and Asya Magazinnik, “At-Large Elections and Minority Representation in Local Government,” American Journal of Political Science 64, no. 3 (July 2020): 717.
38
129 DeLeon, Hill, and Blash, “The Campaign for Proposition H,” 265-274.
Table 7. Average Racial Representation on the Board of Supervisors by Decade
Table 8. 2023 San Francisco Officeholders by Race
Notes: *Supervisor Asha Safaí and School Trustee Lainie Motamedi are ethnically Iranian, which is classified as White in the Census, although many disagree with this classification. See, e.g., Sarah Parvini and Eliis Simani, “Are Arabs and Iranians white? Census says yes, but many disagree,” Los Angeles Times, March 28, 2019, https://www.latimes.com/projects/la-me-census-middle-east-north-africa-race/ † District Attorney Brooke Jenkins identifies as both a Black and Latina
VI. OPTIONS FOR REFORM
WHITE BLACK ASIAN LATINO 2020 CENSUS 39.1% 5.2% 33.7% 15.6% BOARD OF SUPERVISORS 72.7%* 9.1% 9.1% 9.1% ALL AT-LARGE ELECTED OFFICIALS 19.0% 28.6% 33.3% 23.8% EXECUTIVE BRANCH CITY ELECTED OFFICIALS 0.0% 28.6% † 42.9% 42.9% † BOARD OF EDUCATION 42.9% 28.6% 14.3% 14.3% COMMUNITY COLLEGE BOARD OF TRUSTEES 14.3% 28.6% 42.9% 14.3%
woman.
WHITE BLACK ASIAN LATINO 1990 CENSUS 46.90% 10.70% 28.80% 13.30% 1990-2000 BOARD (AT-LARGE) 66.94% 9.92% 14.05% 9.09% 2001-2010 BOARD (BY DISTRICT) 63.64% 9.09% 12.73% 14.55% 2011-2020 BOARD (BY DISTRICT) 36.36% 13.64% 36.36% 11.82% 2021-2023 BOARD (BY DISTRICT) 52.17% 11.07% 23.32% 12.65% 2020 CENSUS 39.10% 5.10% 33.70% 15.60% 39
Table 9. Average Gender
on the Board of Supervisors by Decade
DECADE/SYSTEM FEMALE
1990-2000 (AT-LARGE) 51.24%
2001-2010 (BY DISTRICT) 21.82%
2011-2020 (BY DISTRICT) 40.00%
2021-2023 (BY DISTRICT) 36.36%
on the Board increased significantly in the 2010s, but has decreased somewhat in recent years.
While the transition to districts may have contributed to diverse Board representation previously, it is not clear how much districts contribute to Board diversity today. Whites are significantly overrepresented on the current Board, whereas Asians, the next largest racial group that should theoretically benefit the most from districts, are the most underrepresented. Although 35.5% of San Franciscans are Asian130, after the most recent election there is currently only one Asian Supervisor (9%) on the City’s 11 member Board.131 By contrast, Asians are almost perfectly represented amongst San Francisco’s at-large elected officeholders, including the San Francisco’s citywide elected officials (Mayor, Sheriff, District Attorney, Public Defender, Assessor-Recorder, Treasurer, and City Attorney), its at-large Board of Education trustees, and its at-large Community College Board trustees. Unlike Asians, Latinos and Blacks are represented on the Board approximately in proportion with those communities’ share of the total population. However, as with Asians, Latinos and Blacks are even better represented in the City’s cohort of at-large elected officeholders.
Gender representation
The overall effects of district elections on gender representation on city councils is more contested than for racial representation. Because women are generally about 50% of
the population and residential segregation generally does not occur with respect to sex, districts in theory should result in similar levels of female representation on city councils elected by district compared with at-large elections. Research from the 1970s to 1990s found mixed results on local electoral system effects on women’s representation.132 Recent research has been similarly ambiguous. A 2008 study of 7,500 cities found that women’s representation increased slightly – by 2% – when cities used at-large election systems, with White women gaining the most and Black women not at all. The authors speculated that the multimember nature of at-large elections may benefit women “because the competition is not zero-sum, meaning that voters need not choose women at the expense of men” as in single-member district elections.133 However, a 2012 study limited to 239 large cities (of 100,000 residents and above) found that local electoral systems made no difference in council gender representation.134 Finally, a 2015 study examining only California cities found that women were more likely to run and more likely to win office in by district over at-large city council elections.135 The authors proposed that, due to gender stereotyping, women are more successful at winning district seats which are perceived as “less prestigious” and more constituent-oriented than at-large seats. However, women in San Francisco’s recent history were far more successful winning representation using at-large elections than they have been using district-based elections. During the period from 1990 to 2000, when the City used
130 U.S. Census Bureau, “American Community Survey Population Estimate San Francisco, CA,” accessed April 16, 2023, https://data.census.gov/ table?q=san+francisco+population&tid=ACSDP1Y2021.DP05
131 Joe Fitzgerald Rodriguez, “For the First Time in 2 Decades, This Majority-Asian SF District Will Not Have an Asian Supervisor,” KQED, November 19, 2022, https:// www.kqed.org/news/11932780/for-the-first-time-in-2-decades-this-majority-asian-sf-district-will-not-have-an-asian-supervisor
132 Adrienne R. Smith, Beth Reingold, and Michael Leo Owens, “The Political Determinants of Women’s Descriptive Representation in Cities,” Political Research Quarterly 65, no 2 (June 2012): 316.
133 Trounstine and Valdini, “Context Matters,” 557.
134 Smith, Reingold, and Owens, “Political Determinants,” 321.
135 Melody Crowder-Meyer, Shana Kushner Gadarian, and Jessica Trounstine, “Electoral Institutions, Gender Stereotypes, and Women’s Local Representation,” Politics, Groups, and Identities 3, no. 2 (April 2015): 318.
VI. OPTIONS FOR REFORM
Figure 2. Representation in San Francisco Offices by Gender, 2023
Representation
36.4% 52.4% 28.6% 71.4% 57.1% BOARD OF SUPERVISORS ALL AT-LARGE ELECTED OFFICIALS EXECUTIVE BRANCH CITY ELECTED OFFICIALS BOARD OF EDUCATION COMMUNITY COLLEGE BOARD OF TRUSTEES 4.8% 14.3% 0.0% 0.0% 0.0% FEMALE NON-BINARY 40
Representation on the Board of Supervisors by Decade
STANDARD POLL 2022)
at-large elections, women constituted about half of the Board’s Supervisors, a higher average level of women’s representation than in any decade since. For one four-year stretch in the 1990s, women Supervisors even constituted a seven-member Board majority. Women’s representation on the Board fell precipitously after the first district election, from five women Supervisors before districts to one Supervisor immediately after. In the 2010s and 2020s, women’s representation has increased, but remains about 10% below gender parity.
Women are also better represented, on average, amongst San Francisco’s at-large elected officials than on the Board. Women are significantly overrepresented on the Board of Education and at gender parity on the Community College Board. Although Mayor London Breed is San Francisco’s most prominent local politician, overall women are significantly underrepresented in terms of the City’s executive branch elected officials. A potential explanation for this discrepancy, consistent with some of the academic research on gender stereotypes described above, is that women may do better in at-large multi-member election contests, instead of head-tohead contests where electing a female candidate may come at the expense of electing a male candidate. Another possibility is that different gender role stereotypes of women as more nurturing may help women in elections for education offices, but penalize women in other contests where the office is associated with more stereotypically male topics, like public safety or finance. One recent study of California local elections
found that female candidates had a higher win rate than male candidates in city council and especially school board contests, but a lower win rate than male candidates in mayoral elections, providing support for the stereotype theory.136
LGBTQ+ representation
Unlike for race and gender, there has been very little scholarly literature examining how election systems affect LBGTQ descriptive representation in local government. Some scholars have hypothesized that, because gays and lesbians are generally a small proportion of the overall population, like racial minorities, the community may benefit from district-based elections.137 Supervisor Harvey Milk’s landmark election to the Board in 1977 is a good example of this. Milk had previously run for the Board’s at-large seat and lost, as had other gay candidates. However, when the City adopted districts, he ran for the seat which included the Castro neighborhood, his residence and the center of the City’s gay community, and was able to win with around 30% of the vote.138 The creation of gay influence districts in San Diego and Sacramento in the 1990s and 2010s, respectively, also led to the election of the first out lesbian and gay council members in those cities, respectively. More recently, the LGBTQ+ Victory Fund launched a campaign to lobby for LGBTQ+-friendly districts at the state and local level during the 2020 redistricting cycle, reinforcing the merits of a districting strategy.139
136 Sarah F. Anzia and Rachel Bernhard, “Gender Stereotyping and the Electoral Success of Women Candidates: New Evidence from Local Elections in the United States,” British Journal of Political Science 52, no. 4 (2022): 1544.
137 See, e.g., Donald P. Haider-Markel, Out and Running Gay and Lesbian Candidates, Elections, and Policy Representation (Washington, DC: Georgetown University Press, 2010): 8.
138 Gary M. Segura, “Institutions Matter: Local Electoral Laws, Gay and Lesbian Representation, and Coalition Building Across Minority Communities,” in Gays and Lesbians in the Democratic Process, ed. Ellen D. B. Riggle and Barry L. Tadlock (New York: Columbia University Press, 1999): 227.
139 Ally Mutnick, “LGBTQ advocates target a new way to grow political power: Redistricting,” Politico, August 11, 2021, https://www.politico.com/news/2021/08/11/ LGBTQ+-grow-political-power-redistricting-503549; Matthew S. Bajko, “Political Notebook: Sacramento could see its first out councilman,” Bay Area Reporter, November 30, 2011, https://www.ebar.com/story.php?242073
VI. OPTIONS FOR REFORM
DECADE/SYSTEM LGBTQ+ 1990-2000 (AT-LARGE) 20.66% 2001-2010 (BY DISTRICT) 18.18% 2011-2020 (BY DISTRICT) 15.45% 2021-2023 (BY DISTRICT) 18.18% TOTAL POPULATION
BOARD OF SUPERVISORS ALL AT-LARGE ELECTED OFFICIALS EXECUTIVE BRANCH CITY ELECTED OFFICIALS BOARD OF EDUCATION COMMUNITY COLLEGE BOARD OF TRUSTEES 23.0% 27.3% 19.0% 14.3% 14.3% 28.6% 41
Figure 3. 2023 San Francisco Officeholders by Open LGBTQ+ Status Table 10. Average LBGTQ+
(SF
However, as voters have become less prejudiced against the LGBTQ+ community, especially in very Democratic cities, others have argued that districts may not offer the same benefits as before. One scholar, writing in the late 1990s as San Francisco was about to switch back to district elections, argued that, with the exception of certain neighborhoods, the City’s LGBTQ+ community was large enough (around 20% of the population, he estimated) but too geographically dispersed to benefit from districts, and that gay candidates stood to win more seats competing at-large and drawing votes citywide. The Alice B. Toklas Club, representing LGBTQ+ Democrats, had opposed the 1996 ballot measure creating districts for that reason.140
In fact, LGBTQ+ representation did decline slightly on the Board after the re-adoption of districts. For most of the 1990s, there had been either two or three gay Supervisors, whereas there were never more than two gay Supervisors in the decade that followed. In the early 2010s, LGBTQ+ representation on the Board fell to an average of 15%, significantly below the estimated 23% of the population that identifies as being LGBTQ+;141 however, with the most recent election, three LGBTQ+ Supervisors serve on the Board.
Complicating the picture, while the number of LGBTQ+ Supervisors decreased somewhat after the adoption of the districts, there is significantly greater LGBTQ+ representation on the Board now than amongst the City’s at-large officeholders.
Neighborhood representation
The lack of neighborhood representation on the Board was a significant argument for moving to district-based elections in
140 Segura, “Institutions Matter,” 227.
San Francisco in the 1970s and again in the 1990s. Without a constraint on candidate residency, at-large elections generally produce far worse geographic or neighborhood representation than by district elections. One survey of electoral systems reported that “experts have found that it is common for many or most of the city councilors elected at large to live in one area of the city—typically a middle-class white area.”142 For instance, when San Francisco adopted districts for its 1977 elections, five of the 11 incumbent at-large Supervisors were drawn into the same district.143
Summary of effects on board diversity
At-large elections can result in significantly worse representation for racial minorities than by district elections in cities with significant levels of racial residential segregation and where voting is strongly polarized along racial lines. This is because plurality voting enables a cohesively-voting majority to win all seats up for election. However, in San Francisco, it is not clear that districts would necessarily provide more diverse representation: the City’s initial transition from at-large to by district elections in 2000 did not produce a more racially diverse Board and presently the City’s at-large officeholders are more diverse than the by district Board. Nonetheless, if a return to at-large voting prevented communities of color from being able to elect a candidate of their choice, this voting system could be struck down under the California Voting Rights Act (CVRA).
Existing research is split as to which system most benefits women’s representation and underdeveloped as to effects on the LGBTQ+ community. San Francisco’s history with at-large elections, both past and present, suggest that women may
141 Liz Lindqwister, “Beyond the Rainbow: A Closer Look at San Francisco’s LGBTQ+ Voters,” San Francisco Standard, October 27, 2022, https://sfstandard.com/researchdata/san-francisco-LGBTQ+-queer-gay-transgender-lesbian-voter-profile
142 Amy, Behind the Ballot Box, 59.
143 Lee and Rothman, “San Francisco’s District System.”
VI. OPTIONS FOR REFORM
42
benefit from at-large elections. The LGBTQ+ community, which is also residentially integrated in most parts of the City, may also benefit from at-large elections, but the evidence for this is not strong.
Neighborhood representation, on the other hand, is clearly enhanced by district elections. Under San Francisco’s prior at-large system, Supervisors often resided in the same neighborhoods or regions of the City; officeholder district residency requirements now make this impossible.
Legal risk
Because at-large elections can result in the under-representation of racial minorities, local at-large election systems have a far greater risk of being struck down under federal or state voting rights laws than district-based election systems. Under both the federal Voting Rights Act (VRA) and the California Voting Rights Act (CVRA), it may be impermissible for a local government to maintain an at-large election system if the system dilutes the voting power of minority communities. The traditional remedy if a local jurisdiction’s at-large election system violates the VRA or CVRA is for that jurisdiction to transition to district based elections. By contrast, a local jurisdiction’s by district election system cannot be challenged under the CVRA and, while election district boundaries may be challenged under the federal VRA for disenfranchising minority groups, the usual remedy is to adjust election district boundaries, rather than changing the election system.
Section 2 of the federal Voting Rights Act (VRA) prohibits the use of an election system that “results in a denial or abridgement of the right of any citizen of the United States to vote on account of race or color” or being a member of a language minority group.144 To prove a violation of the VRA, a plaintiff must first show that the minority group is large and compact enough to constitute a “majority in a single-member district,” that the minority group votes cohesively, and that the majority votes sufficiently as a block to usually defeat the minority group’s preferred candidates in an at-large election system. If these preconditions are met, and the “totality of the circumstances” indicate the election system is not equally open to participation by minority voters, for example due to past or
144 Voting Rights Act of 1965, 52 U.S.C. § 10301(a).
present racial discrimination, the at-large system may be struck down and replaced with a district-based system.145
The CVRA, which is a state law, also prohibits the use of local at-large election system if it “impairs the ability of [a racial or language minority group] to elect candidates of its choice or its ability to influence the outcome of an election, as a result of the dilution or the abridgment of the rights of voters” who are members of that minority group.146 To prove a CVRA violation, a plaintiff must show that there is racially polarized voting which usually results in the defeat of candidates preferred by the minority group.147 The CVRA was intended to make it easier for plaintiffs to succeed in bringing claims of minority vote dilution against jurisdictions with at-large elections and was generally understood, unlike the federal VRA, to not require that plaintiffs first show that the affected minority group could constitute the majority of a district, although that issue is presently being litigated before the California Supreme Court.148 The traditional remedy for a CVRA violation is the adoption of a district-based election system, but alternative voting systems may also be appropriate.149
Whether the adoption of an at-large election system in San Francisco would violate the VRA or CVRA is a legal question beyond the scope of this report. There is some evidence that racially polarized voting in San Francisco has been decreasing across all racial groups in recent years.150 In addition, during the most recent redistricting, a consultant hired by the City to examine the City’s legal risk under the VRA found that there was no “legally and statistically significant racially polarized voting” between White and Asian voters.151 However, even if racially polarized voting has not occurred in recent city elections, if the City adopted an at-large election system and polarized voting emerged in future elections, the City might become vulnerable to suit under the VRA or CVRA at that time.
Campaign Effects
Local electoral systems can have significant effects on campaign dynamics, including how candidates campaign and how much money and incumbency matter to candidate success. In at-large elections, candidates must appeal to the whole electorate, instead of just a subset as in district elections. In San
145 See Thornburg v. Gingles, 478 U.S. 30 (1986). See also Wisconsin Legislature v. Wisconsin Elections Commission, 142 S. Ct. 1245 (2022).
146 Cal. Elec. Code § 14027.
147 See Yumori-Kaku v. City of Santa Clara, 59 Cal. App. 5th 385 (2020).
148 See Assembly Floor Analysis of Senate Bill 976 (June 12, 2002). See also Yumori-Kaku v. City of Santa Clara, supra. But see Pico Neighborhood Association v. Santa Monica, 51 Cal.App.5th 1002 (2020).
149 Cal. Elec. Code § 14029.
150 Jason McDaniel, “Does More Choice Lead to Reduced Racially Polarized Voting? Assessing the Impact of Ranked-Choice Voting in Mayoral Elections.” California Journal of Politics and Policy 10, no. 2 (2018): 8.
151 Ana Flores, Gus Guibert, and Andrew Shen, Memorandum to the Redistricting Task Force re Voting Rights Act Section 2 Analysis. San Francisco: Office of the San Francisco City Attorney, March 14, 2022, Attachment B, https://www.sfcityattorney.org/wp-content/uploads/2022/03/2022-03-14-Memo-re-Voting-Rights-Act-Section-2Analysis-rev.2_.pdf
VI. OPTIONS FOR REFORM
43
Francisco, for example, district candidates need to reach only 1/11th of the citywide electorate. In large cities, candidates in at-large elections often need to rely more heavily on direct mail and advertising than in district based elections, where the electorate may be small enough for a door-to-door canvassing to reach most voters.152 Other campaign dynamics may change as well. Because at-large elections have multiple winners, candidates may have greater incentive to campaign as part of a slate than they would in single-member districts. Campaign expenditures are frequently higher in at-large elections, reflecting both higher candidate costs to reach more voters but also a potentially broader pool of interested donors. However, perhaps counterintuitively, because there are many seats up for election at once, outspent candidates and candidates challenging incumbents are generally more likely to be competitive in at-large than by district elections.
Cost of campaigning
The high cost of campaigning in at-large elections was a prominent argument of district election proponents in San Francisco in both the 1976 and the 1996 campaigns. Some scholars argue that at-large elections lead to more expensive campaigns, as candidates need more money to reach a larger electorate and can appeal to a broader base of donors; however, other scholars argue that candidates remain equally incentivized under both systems to raise as much as possible. Relatively few studies have empirically examined how local electoral systems affect campaign financing. One early study, from the 1980s, examined whether campaign costs increased or decreased in five large cities (population over 100,000) that transitioned from at-large to by district or mixed election systems. The study found mixed results, with campaign expenditures decreasing in two cities but increasing in three.153 A 2010 study, which examined 11 cities that used either at-large, by district, or mixed election systems, including San Francisco, found that at-large elections were “only marginally more expensive in absolute terms” than district elections, but suggested additional research was needed.154 However, one of the largest studies on this topic, a Master’s students’ study of candidate campaign expenditures in
19 American cities with between 500,000 and one million residents, including San Francisco, found that in cities with at-large elections the median winning candidate spent almost three times more than winning candidates in cities with by district elections. After controlling for differences in city population, number of seats in a jurisdiction, turnout differences, and other factors, the author found that winning candidates in large U.S. cities with at-large elections spent on average $76,000 more (in 2012 dollars) than winning candidates in cities with district elections.155
Studies of San Francisco’s transitions from at-large to by district elections have also generally concluded that districts have lowered the cost of campaigning. One study of San Francisco’s first experiment with districts in the 1970s found that, while most winning candidates spent more than $50,000 on their campaigns when elections were held at large, only two candidates exceeded that amount in the first district elections in 1977, with the average winning candidate spending just over $30,000.156 However, it is likely this reduction was affected by an ordinance, enacted in 1976, limiting campaign contributions to $500 per contributor.
San Francisco’s second transition back to district elections, in 2000, also saw a decline in campaign spending. One study, which compared spending in two at-large supervisorial elections (1996 and 1998) with spending in by district elections (2000, 2002, and 2004), found that winning candidate spending fell from $338,108 in at-large races to $135,667 in district races.157 Overall spending among all candidates fell, too, from $188,729 at-large to $74,200 by district. A second study of San Francisco elections, this time comparing spending by competitive non-incumbent candidates in the City’s last at-large election (1998) and its first four by district elections (2000-2006), also found that spending decreased, but in a less dramatic fashion: non-incumbent spending fell from around $111,776 at-large to $94,555 by district.158 However, because San Francisco implemented several other election reforms immediately after its first use of district elections in 2000 –including a campaign public financing program in 2002 and the elimination of runoffs in 2004 – it is possible the decrease in
152 Eric J. Oliver, Shang E. Ha, and Zachary Callen, Local Elections and the Politics of Small-Scale Democracy (Princeton, NJ: Princeton University Press: 2012): 111. See also Eric A. Lindgren, Comparing San Francisco’s At-Large and District Supervisor Elections’ Average Spending and Participation Rates.” California Politics & Policy 11 (June 2007): 42.
153 Peggy Heilig and Robert J. Mundt, Your Voice at City Hall: The Politics, Procedures, and Policies of District Representation (Albany: State University of New York Press, 1984).
154 Brian E. Adams, “Financing Local Elections: The Impact of Institutions on Electoral Outcomes and Democratic Representation.” PS: Political Science & Politics 44, no. 1 (January 2011): 111-112 (citing Brian E. Adams, Campaign Finance in Local Elections: Buying the Grassroots. FirstForumPress, 2010).
155 Jason Malinowski, “Campaign Spending in City Council Elections: A Comparison of At-Large and District Contests.” (University of Washington Bothell Master of Arts capstone project), 2013.
156 Lee and Rothman, “San Francisco’s District System,” 173-178.
157 Lindgren, “Comparing San Francisco’s At-Large,” 38.
158 Brian E. Adams, Campaign Finance in Local Elections: Buying the Grassroots. (Boulder, CO: FirstForumPress, 2010).
VI. OPTIONS FOR REFORM
44
candidate spending was due to these other reforms rather than the adoption of districts.159
While spending appears to be overall higher in jurisdictions with at-large elections, spending per registered voter is significantly lower. A 2018 study of municipal elections in 61 California cities between 2008 and 2015 found that competitive candidates spent between $.74 and $.94 per registered voter in at-large elections, depending on jurisdiction size, compared with $2.73 to $3.53 per registered voter in district elections, or about three to four times higher.160 A study of San Francisco’s 1970s transition to districts found a similar jump in expenditures when measured on a dollars-per-voter basis.161 Money is also less of a predictor of campaign success in at-large elections than by district elections. In the 2018 study of California city elections, only 27 to 36% of winning candidates in district elections were outspent, compared with 37 to 59% in at-large elections.162
Competitiveness
There is some evidence that at-large elections are more competitive than district elections, in part because they attract far more candidates. For example, in San Francisco’s last two at-large elections, 17 candidates ran for Supervisor in 1996 and 28 in 1998, compared with an average of 3.5 candidates per district in the two most recent supervisorial elections in 2020 and 2022.163 At-large elections are also more likely to attract more viable candidates than district elections, where entrenched incumbents often face no challengers or only token opposition. The 2018 study of California city elections found that between 71% and 92% of at-large elections were competitive, compared with 54% to 73% of by district elections.164

In addition, while that study found that the incumbency advantage remained high under both systems, it was lower in at-large election systems, where incumbents were re-elected only 72% to 87% of the time, compared with a 89% to 98% rate in by district elections.165 In San Francisco, Supervisors rarely lose reelection: only one elected incumbent Supervisor has lost reelection since 2002 — a more than 90% re-election rate — although four appointed incumbents filling a partial term have also been defeated.166 Other studies have similarly found that incumbents have higher reelection rates in district
159 Adams, Campaign Finance, 28, 190.
IN SAN FRANCISCO, SUPERVISORS
RARELY LOSE REELECTION: ONLY ONE ELECTED INCUMBENT SUPERVISOR HAS LOST REELECTION SINCE 2002 — A MORE THAN 90% RE-ELECTION RATE — ALTHOUGH FOUR APPOINTED
INCUMBENTS FILLING A PARTIAL TERM HAVE ALSO BEEN DEFEATED.
160 Brian E. Adams, “Campaigning in Lilliput: Money’s Influence in Small and Mid-Sized City Elections.” California Journal of Politics and Policy 10, no. 2 (2018): 6.

161 Lee and Rothman. “San Francisco’s District System.”
162 Adams, “Campaigning in Lilliput,” 8.
163 San Francisco Department of Elections, “Past Election Results,” https://sfelections.sfgov.org/past-election-results, n.d., accessed May 8, 2023.
164 Adams, “Campaigning in Lilliputt,” 11.
165 Adams, “Campaigning in Lilliput,” 12.
166 J. D. Morris and Nami Sumida, “No elected incumbent supervisor has lost in San Francisco in two decades. Here’s why,” San Francisco Chronicle, September 28, 2022. The statistics in this article have been updated to reflect the fact that incumbent Supervisor Gordon Mar lost re-election in 2022.
VI. OPTIONS FOR REFORM
45
compared with at-large elections.167 The stronger incumbency advantage in district elections may be because it is easier for incumbents to build their name recognition with a subset of the electorate than the whole electorate; district incumbents can more easily claim sole credit for projects in their district, as opposed to sharing the credit with other at-large members; and district elections attract fewer viable challengers than at-large elections.
Mixed Systems
Few of the stakeholders interviewed for this report who were critical of district elections for the Board wanted a return to a purely at-large system. Most acknowledged that neighborhood representation was important, but argued that San Francisco needs a better blend of community and citywide oriented Supervisors to meet the City’s significant challenges. In theory, mixed election systems, which combine some members elected at large and some by district, should provide both perspectives. Surprisingly, although this election system is common in large cities across the U.S., especially of San Francisco’s size, there is relatively little scholarship looking at how a council elected through a mixed system may differ from one elected purely by district or at large.
Reassuringly, most studies that do examine this variation tend to find that mixed systems perform somewhere between the two pure systems, as one might expect. In terms of council diversity, mixed systems generally result in greater representation of people of color than at-large systems, close to but somewhat less than by district systems.168 Racial minorities in mixed systems are more likely to be elected in the district seats than the at-large seats; however, part of the explanation for this seems to be that candidates of color were more likely to run for district than at-large seats in these cities.169 Because mixed systems generally result in better descriptive representation than pure at-large systems, they are less vulnerable to a voting rights challenge under the VRA or CVRA; however, these
systems still include at-large elections and so are not a safe harbor from challenge under either law.170 In terms of gender diversity, mixed systems do not appear to significantly help or hurt women’s representation compared with purely at-large or purely by district systems.171 There are no studies that we are aware of looking at LGBTQ+ representation and mixed systems. In terms of geographic or neighborhood diversity, the district seats in a mixed system ensure that council members reside in different areas of the city; however, at-large members could still live in the same neighborhoods, so this system is likely to produce less neighborhood diversity than a purely by district system.
The policy orientation of council members in mixed cities tends to reflect the system that they were elected under: at-large members were much more likely to report focusing on the city as a whole than district members in the same city. However, in mixed cities both at-large and district members report spending similar time on constituent work, unlike in purely at-large cities where council members report doing less constituent work than council members in purely by district cities.172 At-large council members in mixed cities report more conflict on the council than council members in purely at-large cities.173 This is likely because, as with purely by district cities, mixed cities are more likely to elect at least some council members with different views than is the case in at-large cities.
Proponents of a mixed system argue that it combines the best attributes of both systems: district members ensure no part of the city is neglected or left without an advocate and at-large members ensure that the most pressing needs of the city are also addressed.174 Unfortunately, the policy effects of mixed cities, as distinct from the other two systems, have received little academic study. For simplicity, most studies examining local electoral systems either omit mixed cities or group mixed cities with either at-large or by district cities for the purpose of analysis. Some studies suggest that mixed cities produce policy outcomes somewhere between purely at-large and purely by district cities, suggesting a balancing effect is taking place. For example, one study found that cities were more likely to
167 Jessica Trounstine, “Turnout and Incumbency in Local Elections.” Urban Affairs Review 49, no. 2 (2013): 167-189.
168 Barbara L. Berry and Thomas R. Dye, The Discriminatory Effects of At-Large Elections, Florida State University Law Review 7, no. 1 (Winter 1979): 85-122; Richard A. Walawender, “At-Large Elections and Vote Dilution: An Empirical Study,” Michigan Journal of Law Reform 19, no. 4 (Summer 1986): 1221-1242; Chandler Davidson and Bernard Grofman, “The Effect of Municipal Election Structure on Black Representation in Eight Southern States” in Quiet Revolution in the South: The Impact of the Voting Rights Act, 1965-1990, ed. Chandler Davidson and Bernard Grofman, Princeton, NJ: Princeton University Press,1994, 307; Susan A. MacManus, “Mixed Election Systems: The Newest Reform Structure,” in Local Government Election Practices, ed. Roger L. Kemp; (Jefferson, NC: McFarland, 1999), 42; Tari Renner, “Election Processes and Minority Representation” in Local Government Election Practices, ed. Roger L. Kemp (Jefferson, NC: McFarland, 1999), 153; and Melissa Marschall and Anna Mikulska, The Process of Minority Incorporation in Local Politics and Government, Rice University Kinder Institute for Urban Research (2013). However, see Susan Welch, “The Impact of At-Large Elections on the Representation of Blacks and Hispanics,” Journal of Politics 52, no. 4 (November 1990): 10591065, finding that mixed systems improved Latino representation compared with at-large systems, but that the systems were about equivalent for Blacks.
169 Welch, “The Impact of At-Large Elections;” Polinard et al., Electoral Structure,” 55.
170 For the California Voting Rights Act (CVRA), see Cal. Elec. Code § 14026(a)(3).
171 Adrienne R. Smith, Beth Reingold and Michael Leo Owens, “The Political Determinants of Women’s Descriptive Representation in Cities,” Political Research Quarterly 65. No. 2 (June 2012), 321, 326, n.11.
172 Welch and Bledsoe, Urban Reform, 76-77.
173 Polinard et al., Electoral Structure 86.
174 Douglas J. Amy, Behind the Ballot Box: A Citizen’s Guide to Voting Systems (Westport, CT: Praeger, 2000), 60.
VI. OPTIONS FOR REFORM
46
adopt smart growth policies as the percentage of at-large seats increased on a city council. The author concluded that this was because at-large members had a “more comprehensive perspective of the public good and are less responsive to territorial groups” than district members.175 Another study, looking at housing production, found that mixed cities produced more housing than by district cities, but did not specify the degree of the difference or how it compares with at-large cities.176 One study, however, found that mixed cities spend more than either purely at-large or by district systems, which may suggest that mixed cities may produce their own dynamic apart from the other two systems.177
Candidate campaign costs in mixed systems also fall in between the two pure systems: more expensive on average than purely by district elections, but less expensive than purely at-large systems.178 Candidates spend more campaigning for at-large council seats in a mixed system than they do for district seats in the same jurisdiction, which may indicate that donors consider at-large seats to be more impactful.179 If San Francisco kept an 11-member Board but reduced the number of district seats to add at-large seats, the remaining districts would grow in size, which would likely also increase campaign costs for those seats. Because mixed systems have districts, the potential for gerrymandering would remain; bloc voting in the at-large seats could also create the risk of over-representing the political majority as to those seats.
There is no set rule for how many seats in a mixed system should be elected by district versus at-large. The Baltimore City Council has 14 district members (93%) to only one at-large member (7%), whereas Kansas City (MO) City Council has six district (50%) to six at-large members (50%). On average, however, most large U.S. cities with mixed systems have a 2:1 ratio of district to at-large seats, which for an 11-member Board would mean between 7-8 by district seats and 3-4 at-large seats. One academic theorist has argued that the best arrangement to maximize an individual’s voting power in a mixed system is for the at-large seats to be equal to the square root of the total number of seats, which also comes out to between 3-4 seats on an 11-member Board.180
Alternative System: PRCV
The prior sections examined the benefits of by district, plurality at-large, or mixed election systems (using plurality voting for the at-large seats). Plurality voting is the most common form of at-large voting in the U.S., and the primary form that has been extensively studied. However, there are other forms of at-large voting that are less likely to result in the under-representation of racial and political minorities, one of the more significant potential downsides to plurality at-large voting.
One such system is Proportional Ranked Choice Voting (PRCV), also known as Single Transferable Vote (STV), which is the multi-seat version of RCV that San Francisco uses for its single-member district supervisorial elections.181 PRCV is frequently described as a candidate-based form of proportional representation, where every candidate who reaches a certain threshold of voter support is elected. PRCV can be used fully at-large, as part of a mixed system, or in multimember districts.
Who Uses PRCV?
PRCV is currently used for local elections in five cities in the U.S.:
• Albany, California, for its City Council and School Board
• Alden, Delaware, for its Town Council and Board of Assessors
• Cambridge, Massachusetts, for its City Council and School Board
• Minneapolis, Minnesota, for two local boards
• Palm Desert, California, for its City Council
An additional four jurisdictions are set to use PRCV in the near future: Amherst, Massachusetts (2023); Arlington, Virginia (2023 - primary only); Portland, Maine (2023); and Portland, Oregon (2024).182
175 Edgar E. Ramírez de la Cruz, “Local Political Institutions and Smart Growth: An Empirical Study of the Politics of Compact Development,” Urban Affairs Review 45, no. 2 (2009): 218-246.
176 Mast, “Warding Off Development,” 1–29.
177 Reza Baqir, “Districting and government overspending,” Journal of Political Economy 110, no. 6 (December 2002): 1345.
178 Malinowski, “Campaign Spending,” 15-16.
179 Malinowski, “Campaign Spending,” 17. See also Heilig and Mundt, Your Voice at City Hall.
180 Paul H. Edelman, “Making Votes Count in Local Elections: A Mathematical Appraisal of At-Large Representation,” Election Law Journal 4, no. 4 (2005): 258-278. Maximizing an individual’s voting power was defined as maximizing the “voter-citizen’s ability to affect the choice of her representatives (both districted and at-large)” and “the representative-voter’s ability to affect the outcome of a council decision.”
181 Other forms include limited voting and cumulative voting.
182 FairVote, “Where is Proportional RCV Used?”
VI. OPTIONS FOR REFORM
47
1 2 4 3
Historically, PRCV was also used in 24 U.S. cities in the early and mid-twentieth century, including Cincinnati, Cleveland, Boulder, Sacramento, and New York City. However, by the 1940s and 1950s, most of these cities had repealed this election system, with the notable exception of Cambridge, which has used this system continuously since 1941.183 The traditional view is that PRCV was repealed, in significant part, because of a racist reaction to racial minorities, and particularly Blacks, winning representation under this system and because of a fear that left-wing political parties might gain ground using this system during the McCarthy era.184 More recently, PRCV was also used between 1975 and 2002 to elect New York City’s 32 Community School Boards, until those boards were eliminated as part of a reorganization to strengthen the Mayor’s powers.185
183 Jack Santucci, More Parties or No Parties (New York: Oxford University Press, 2022), 5.
How PRCV Works
In a PRCV election, voters are able to rank the candidates on their ballot in order of preference, just like in a single-seat RCV election. Ballots are counted in a series of rounds until enough candidates reach the vote threshold required for election, which is the total number of votes cast divided by one more than the number of seats to elect. So, in an election to fill two seats, a candidate would need more than 33% of the vote to be elected; for three seats, the threshold is 25%; for four seats, the threshold is 20%; and so on. If a candidate receives more first choice votes than the threshold, the candidate is elected, and any votes the candidate receives in excess of the vote threshold are transferred to other candidates according to each voter’s next indicated preference. After excess votes are transferred,
184 See Kathleen L. Barber, A Right to Representation: Proportional Election Systems for the Twenty-First Century (Columbus: The Ohio State University Press, 2000): 84. See also Douglas J. Amy, “The Forgotten History of the Single Transferable Vote in the United States.” Representation 34, no. 1 (1996): 13-20.
185 Catherine Gewertz, “N.Y.C. Mayor Gains Control Over Schools,” EdWeek, June 19, 2002, www.edweek.org/leadership/n-y-c-mayor-gains-control-overschools/2002/06
VI. OPTIONS FOR REFORM
Figure 4. PRCV Electoral Process
RCV
RANK THE CANDIDATES BY ORDER OF PREFERENCE: ANNA BEV CHRIS DIEGO
40% 25% 15% 20% ANNA BEV CHRIS DIEGO STEP 1: CANDIDATES OVER THRESHOLD WIN 33% 33% 27% 16% 24% ANNA BEV CHRIS DIEGO STEP 2: DISTRIBUTE SURPLUS 33% 33% 30% 0% 37% ANNA BEV CHRIS DIEGO STEP 3: ELIMINATE LOWEST VOTE-GETTERS 33% 48
Source: Nicolas Heidorn, California Municipal Democracy Index (Sacramento, CA: California Common Cause, 2016)
BALLOT
the candidate receiving the fewest votes is eliminated, with their votes transferring according to voters’ next preferences. This process repeats until all seats are filled.
For example, imagine a PRCV election with four candidates running for two council seats (See Figure 4). In a two-seat race, the vote threshold is 33.3% of the vote. Anna receives 40% of the first choice votes and is elected. Since she exceeded the vote threshold, the 6.7% of the vote she received over the threshold is transferred to the remaining candidates, based on who Anna’s voters ranked as their next preferred candidate. For example, if Bev was the second choice in 50% of Anna’s ballots, Bev would get 50% of Anna’s excess votes. Since no one reached the vote threshold from Anna’s surplus votes, the candidate with the fewest votes, Chris, is eliminated. His 16% of the vote transfers to his voters’ next choices: in this case, 13% of his votes transfer to Diego, who passes the vote threshold and is elected.
Policy Effects
PRCV is designed to maximize the effectiveness of a person’s vote, so that as many voters as possible contribute to electing a representative of their choice. As the name indicates, PRCV is sometimes described as a candidate-based proportional representation system, where a majority of the electorate will elect a majority of seats but a substantial minority of the electorate (i.e., greater than the vote threshold) will also win representation, in proportion to their share of the vote. This is in contrast to winner-take-all systems, like single member district or plurality at-large elections, where a substantial minority (or sometimes even a majority, if voting splitting occurs) may be represented by a candidate they voted against. For example, in a single-member district election a candidate might win with 51% of the vote, meaning just under half the electorate failed to elect a representative. By contrast, in a PRCV election with multiple seats, and where voters who supported losing candidates have their vote transfer to their next most preferred candidate, typically closer to 80% to 90% of voters will have their vote count toward a candidate ranked on their ballot. In Cambridge, for example, a FairVote report found that, over “the last 20 years, a median of 95% of Cambridge voters elect[ed] one of their top three choices to the city council.”186 Studies of early PRCV use in Cincinnati, Cleveland, and New York City council elections found that the percent of “effective votes,” meaning votes that succeeded in electing a candidate, jumped
by 20% to 30% on average after those cities switched from district to PRCV elections.187
PRCV generally does a much better job of representing the overall preferences of the electorate than the other election systems examined in this report. This is especially apparent in partisan contests, where district elections, due to vote splitting or gerrymandering, or plurality at-large elections, due to vote splitting or majority bloc voting, can produce more extreme results that significantly under- or over-represent either the political majority or minority. In PRCV at-large, there are no districts to gerrymander, and the lower vote threshold and the possibility of vote transfers due to ranked ballots are more likely to produce a proportional result. For example, when Scottish local elections were first conducted under PRCV in 2007, the political party over- and under-representation gap on local boards shrank considerably at the very first election.188 This also happened with the U.S. cities that used PRCV in the earlier half of the last century. For example, in the “election before the adoption of [PRCV] in Cincinnati, the Republicans won only 55% of the vote, but received 97% of the seats on the council. In the first [PRCV] election, the results were much more proportional, with the Republicans winning 33.3% of the seats based on 27.8% of the vote, and the rival Charter party winning 66.7% of the seats on 63.8% of the vote.”189
In the U.S. today, most local elections are nonpartisan, although many cities, like San Francisco, have well-defined political factions that high-information (but not low information) voters are aware of. If voters are primarily voting on the basis of faction, then PRCV would likely produce a Board that reflects the popular support of each faction. So, for example, a 3-seat at-large race under PRCV would likely produce a 2-1 split between two main voting factions, whereas in plurality at-large a 3-0 split might be more likely if the majority votes cohesively. However, if voters prioritize other candidate attributes above what political faction they are affiliated with, this spread may not occur.
Relatively little research has been done on the other policy effects of PRCV on local governments, since only a few U.S. municipalities use the system. PRCV council members are elected at large and so are likely to have a more citywide perspective than district council members; however, one tactic used by some candidate slates in PRCV elections is to assign each slate member a different area of the city to campaign in, which may lead that slate member, if elected, to adopt more
186 Deb Otis, Spotlight: Proportional RCV in Cambridge, Massachusetts. FairVote, October 5, 2022. fairvote.org/spotlight_cambridge/.
187 Amy, “The Forgotten History.”
188 Alistair Clark, “The Effects of Electoral Reform on Party Campaigns, Voters, and Party Systems at the Local Level: From Single Member Plurality to the Single Transferable Vote in Scotland.” Local Government Studies 47, no. 1 (2021): 79-99.
189 Amy, “The Forgotten History.”
VI. OPTIONS FOR REFORM
49
of a neighborhood focus than a candidate elected in a more traditional at-large election. One scholar of early U.S. municipal use of PRCV argued there was a “tension between citywide and neighborhood policy” in those cities as a result.190 Moreover, because the threshold for electing a councilmember under PRCV is much lower than in a district or plurality at-large election, e.g. 25% of the vote for a 3-seat contest, candidates are able to get elected by appealing to a narrower constituency that meets that threshold. This could include neighborhoods, ethnic groups, or communities that are not based on a place or demographic identity, like small business owners, renters, or bicyclists, which might also affect that candidate’s policy focus as an officeholder.
There is similarly little research in the modern American context as to how PRCV might affect local governing board dynamics. Some studies, discussed previously, suggest that traditional at-large elections may lessen conflict on city councils, likely because more members are elected by and accountable to the same electorate; however, because PRCV is designed to elect members from a broader and more representative set of constituencies, that diversity might be expected to produce
190 Santucci, More Parties or No Parties, 117.
more council conflict, possibly similar to the level of conflict seen in councils elected by district. There is no strong evidence to support this theory, however. One study of councilmember legislative roll call votes in Cambridge between 2013 and 2015 found “evidence of weak polarization in the City Council … as evidenced by the lack of tightly clustered [voting] factions” on different issues.191 However, the authors caution, “more research is needed to determine if multi-winner RCV has helped keep polarization low.”
Research into the early to mid-twentieth century use of PRCV in American cities, while dated, also provides mixed evidence as to the governing effects of this model. One study of the municipal use of PRCV in five Ohio cities in that era found “little evidence” to support “the fear that [PRCV] would cause fragmentation of council behavior; indeed, improved consensus building was observed and appears to be linked to the electoral system.”192 For example, the author observed that electoral pressure on PRCV candidates in Cincinnati “to appeal for second- and subsequent-choice votes from supporters of other candidates appeared to reduce tension on the council once the election was over.”193
191 Sarah John and Brandon Leinz, “Polarization and Multi-Winner Ranked Choice Voting in Cambridge, Massachusetts, City Council Elections,” FairVote, April 2016, https://fairvote.app.box.com/v/CambridgePolarization
192 Barber, Right to Representation, 116, 121-122.
193 Barber, Right to Representation, 106.
VI. OPTIONS FOR REFORM
50
However, another scholar, analyzing the voting record of PRCV councilmembers in Cincinnati, New York, and Worcester, found that PRCV tended to undermine party (or faction) discipline among elected council members and as a result made governing coalitions less stable.194 Under PRCV, a council member who received a significant number of second or third choices from voters of a different party or faction may feel the liberty or the need to vote differently from their co-partisans on the council on certain issues. In Cincinnati, for example, in some years the majority coalition was defeated on up to 15% of council votes due to co-partisan defections.195 The author argues that these early PRCV systems were short-lived because they undermined party cohesion: as “vote transfers cross the major-party divide … and legislators defy party leaders in government,” leaders from opposing coalitions began to push for repeal, ultimately successfully in most cases.196
Board Diversity
Racial and ethnic representation
PRCV may lead to better representation of communities of color in jurisdictions where there is racially polarized voting by lowering the vote threshold needed for election. This is especially true in jurisdictions where the minority community is either too dispersed or too small to reliably win representation under single member districts. For example, consider a city with a four-seat city council with a minority community that constitutes 20% of the overall electorate and at most 25% of a district. Under either plurality at-large or a by district system, the minority group would still be outvoted by a cohesively voting majority and win no representation. However, in a fourseat PRCV election, the vote threshold to win a seat is lowered to only 20%, so the group would be guaranteed one seat if its voters turn out and vote cohesively. For this reason, some civil rights scholars, notably the late Harvard Law Professor Lani Guinier, have advocated for wider use of alternative voting systems like PRCV.197
Because PRCV is not used extensively in the U.S. today, most of the available scholarship on the local effects of this voting system come from a few cities, modeling, or international
examples. Nonetheless, these sources mostly point in the same direction that, by lowering the threshold needed to elect a candidate, PRCV generally leads to improved minority representation over plurality at-large and single-member districts in racially integrated cities. In terms of the U.S. experience, municipal uses of PRCV in the early and mid-twentieth century increased representation of people of color in many cities, and in some cities led to the election of the city’s first Black councilmember.198 More recently, New York City used PRCV to elect its 32 Community School Boards from 1975 to 2002, when the boards were reorganized. One study comparing the diversity of the boards with the New York City Council found they were far more representative of the city’s residents:
“African Americans, Hispanics, and Asian Americans made up 37 percent to 46 percent of New York City’s population during the three decades in which it used preferential voting for its school board elections. The minority groups won 35 to 57 percent of these positions, compared to only 5 percent to 25 percent of seats on the city council, which were elected using single-member districts.”199
In Cambridge, which is the city with the longest history of PRCV use in the U.S., voters have consistently elected one or more Black representatives to its 9-member city council since the 1980s, either matching or exceeding the 10% of the population that is Black.200 More recently in California, where PRCV was used in Albany for the first time, an Asian candidate won a seat on the city council for just the second time in 25 years, despite Asians constituting almost a quarter of the city’s population. Albany transitioned to PRCV because the city’s prior at-large system had made it difficult for that community to elect a candidate of its choice.201
Modeling also suggests PRCV could be a beneficial voting rights remedy. In one study, researchers examined voting patterns in four diverse U.S. jurisdictions and predicted what the percentage representation for people of color on the local governing board would be under favorably drawn single-member districts versus PRCV. They found that PRCV tends “to elect candidates of choice for people of color (POC) in proportion to POC population” whereas under districts the range of representational outcomes was “highly sensitive to the size and residential
194 Santucci, More Parties or No Parties, 122-124, 168-169.
195 Santucci, More Parties or No Parties, 132.
196 Santucci, More Parties or No Parties, 168.
197 Amy, “The Forgotten History.”
198 Alex Ault, The Forgotten Results & Future Promise of Ranked Choice Voting in Ohio, FairVote, July 24, 2018. https://fairvote.org/report/the_forgotten_results_future_ promise_of_ranked_choice_voting_in_ohio_1/
199 Stephanopoulos, Nicholas O. “Our Electoral Exceptionalism.” University of Chicago Law Review 80, no. 2 (2013): 769.
200 Otis, Spotlight.
201 “Ranked-choice voting could racially diversify councils,” East Bay Times, September 2, 2020.
VI. OPTIONS FOR REFORM
51
distribution of the minority group,” sometimes resulting in significant under- or over-representation.202
However, PRCV may not be better for minority communities where there is a high enough degree of residential segregation that plurality/majority minority districts can be drawn. This is especially the case if the minority community’s turnout rate is far lower than other groups, because PRCV produces proportional results to the vote cast, not the underlying population. With majority-minority districts, minority community turnout will be less critical because higher-turnout communities are drawn in a different district.
Gender representation
PRCV might be expected to increase women’s representation on local boards; however, the evidence is modest in the U.S., and internationally the evidence is mixed at best. Election results in two U.S. cities suggest that PRCV does produce more gender parity. One study of Cambridge, Massachusetts, elections found that, since 1997, “women have typically made up between one-third and two-thirds of both the city council and school committee.”203 In eight of New York City’s Community School Board elections between 1975 and 1996, women won an average of 47% of available seats, and won a majority of all seats beginning in the 1990s.204
Internationally, there is also some evidence that PRCV modestly improves gender representation over single member districts in national parliaments, but far less than other
[RESEARCHERS FOUND THAT PRCV TENDS]
party-based proportional representation systems commonly used in other European countries.205 Two large-scale studies of local reform likewise found mixed or modest support. In Scotland, after PRCV was mandated for local elections in 2007, replacing plurality by district elections, there was no increase in the number of women in local office after the first election, and only a modest increase after the second election. However, the number of women candidates declined significantly after STV’s introduction, while the chance of winning for those remaining women candidates increased substantially.206 The author speculated that party leaders may have played a gatekeeping role and discouraged less viable women candidates from running after the adoption of PRCV. Another study from New Zealand examined nonpartisan elections in cities using either PRCV or a by district election system and found only a slight advantage for women under PRCV, mostly when there were a large number of seats under contention. The authors noted that women candidates had a higher win rate than men under PRCV, but that fewer women ran, which may have contributed to the discrepancy in representation.207
LGBTQ+ representation
PRCV may improve the chances of LGBTQ+ candidates in San Francisco where, outside a few neighborhoods, the LGBTQ+ community is relatively dispersed.208 This was the reason the Alice B. Toklas Lesbian & Gay Democratic Club gave for supporting Proposition H in 1996, which would have provided
202 Gerdus Benadè, Ruth Buck, Moon Duchin, Dara Gold, and Thomas Weighill, The Future is Proportional: Improving Minority Representation through New Electoral Systems, New America (2021), https://www.newamerica.org/political-reform/reports/the-future-is-proportional/
203 Otis, Spotlight
204 More Equitable Democracy, “NYC Community School Boards,” n.d., accessed May 2023, https://equitabledemocracy.org/nyc-school-boards/
205 Ian McAllister and Donley T. Studlar, “Electoral Systems and Women’s Representation: A Long-Term Perspective.” Representation 39, no. 1 (March 2002): 9.
206 Hugh Bochel and Catherine Bochel. “Women Candidates and Councillors in Scottish Local Government, 1974–2012.” Scottish Affairs 25, no. 2 (May 2016): 161-185.
207 Jack Vowles and Janine Hayward. “Ballot Structure, District Magnitude and Descriptive Representation: The Case of New Zealand Local Council Elections.” Australian Journal of Political Science 56, no. 3 (June 2021): 238-239.
208 Segura, “Institutions Matter,” 233.
VI. OPTIONS FOR REFORM
“
52
“TO ELECT CANDIDATES OF CHOICE FOR PEOPLE OF COLOR (POC) IN PROPORTION TO POC POPULATION.”
at-large PRCV in San Francisco.209 There are some prominent examples of this occurring, although there are no systematic studies examining how local electoral systems affect LGBTQ+ representation. In 1993, gay and lesbian organizations organized candidate slates to run in PRCV elections for New York City Community School Board in response to attacks by social conservatives on a proposed multicultural curriculum.210 Forty-three candidates endorsed by Empire State Pride, an LGBTQ+ advocacy organization, were elected under the Board’s PRCV system, including New York City’s first three openly gay school board members.211
Today, around 23% of San Franciscans identify as LGBTQ+, which, if that community voted cohesively, would about match or exceed the threshold for electing a candidate in a three or four seat PRCV election.
Neighborhood representation
As an at-large system, it would be possible under PRCV for most of the winning candidates to reside in the same geographic area of a city, as often occurs under plurality at-large elections. However, because the minimum vote threshold a candidate must win to guarantee their election is significantly less under PRCV than in plurality at-large elections, candidates whose support is primarily regional may be able to win election on that basis. FairVote examined the geographic dispersion of Cambridge councilmembers in 2017, and found that each resided in a different voting precinct and were spread out across the city.212 For strategic reasons, candidate slates under PRCV may recruit candidates from different areas of a jurisdiction and encourage those candidates to focus their campaigning there.213 In some U.S. cities that used PRCV in the early to mid-twentieth century, PRCV was sometimes described as providing “neighborhood representation” for this reason.214
Legal risk
PRCV elections are still at-large elections; thus, were San Francisco to adopt a PRCV election system, there would still
be a risk of the system being challenged and overturned under either the federal VRA or the state CVRA. However, because the election threshold is lowered in proportion to the number of seats to be elected, PRCV is far less likely to dilute the voting strength of communities of color in jurisdictions with racially-polarized voting than would be the case under plurality at-large elections. This is particularly true if the percent of the overall vote cast by members of the disenfranchised community is greater than the election threshold.
The CVRA expressly contemplates alternative remedies besides imposing district elections in appropriate cases.215 The law states that while “members of a protected class are not geographically compact or concentrated may not preclude a finding” that a violation of the CVRA has occurred, this fact “may be a factor in determining an appropriate remedy.”216
PRCV was recently adopted in the California cities of Albany and Palm Desert to address a CVRA claim.217 Eastpointe, Michigan, also adopted PRCV to settle a federal VRA claim brought by the Department of Justice.218 Civil rights organizations, including the ACLU and Asian Americans Advancing Justice, have also expressed general support for PRCV in some contexts, including where a minority community is too geographically dispersed for districts to provide an effective voting rights remedy. Those groups recently supported a bill in the California Legislature, vetoed by Governor Newsom, that would have allowed general law cities to use PRCV.219
Campaign Effects
PRCV also would likely change campaign dynamics significantly. In terms of spending, because PRCV at-large remains an atlarge election system, contests under this system would likely be more expensive than under a by district system. However, the election threshold would be much lower in a PRCV election than in a traditional at-large election; hypothetically, because candidates are able to win election by targeting a much smaller electorate, this might reduce the cost of campaigning. However,
209 San Francisco Department of Elections, San Francisco Voter Information Pamphlet, Consolidated Presidential General Election, November 5, 1996, “Paid Argument in Favor of Proposition H,” 170. https://webbie1.sfpl.org/multimedia/pdf/elections/November5_1996short.pdf
210 Darren Rosenblum, “Geographically Sexual?: Advancing Lesbian and Gay Interests Through Proportional Representation.” Harvard Civil Rights-Civil Liberties Law Review 31, no. 1 (Winter 1996): 119.
211 Sam Dillon, “Supporters of Gay Rights Win More School Races,” New York Times, May 18, 1993; Sam Dillon, “New York City’s 32 School Boards Get New Faces but Not New Views,” New York Times, May 22, 1993.
212 Deb Otis, Spotlight.
213 Santucci, More Parties or No Parties, 117-118; Baston, Campaigning.
214 Santucci, More Parties or No Parties, 117.
215 Cal. Elec. Code § 14029.
216 Cal. Elec. Code § 14028(c).
217 Sabrina Laverty, “Proportional RCV is Coming to Two More California Cities,” FairVote, July 19, 2022, https://fairvote.org/proportional-rcv-is-coming-to-two-morecalifornia-cities/
218 Department of Justice, “Justice Department Reaches Agreement with City of Eastpointe, Michigan, Under the Voting Rights Act” Press Release No. 19-623, June 5, 2019, https://www.justice.gov/opa/pr/justice-department-reaches-agreement-city-eastpointe-michigan-under-voting-rights-act
219 California Legislative Information, Bill Text, Senate Bill 212 (Allen) (2019). https://leginfo.legislature.ca.gov/faces/billTextClient.xhtml?bill_id=201920200SB212
VI. OPTIONS FOR REFORM
53
there is no strong evidence for this supposition. One report of Massachusetts city council campaigns over three election cycles found that, of the four cities in the state with a population between 100,000 and 200,000 residents, the average winning city council candidate in Cambridge spent significantly more than the average winning candidate in Worcester, Lowell, or Springfield. However, the authors attribute this disparity to the fact that “the average wealth per person in Cambridge is considerably higher” than in some of these other cities.220 As in other cities, winning candidates in Cambridge typically raised more money than challengers. However, the report highlights the example of one candidate, Leland Cheung, who was able to win in 2009 on the strength of grassroots campaigning despite raising far less money than the average elected member.
PRCV elections, similar to traditional at-large elections, would also likely modestly decrease incumbents’ re-election advantage. Rose Institute research of six elections in Cambridge, Massachusetts, from 2013 to 2021 found that incumbents won re-election 89% of the time.221 International studies also suggest that the re-election rate under PRCV is lower than in single-member district elections. For example, one study of Irish parliamentary elections, which are conducted using PRCV, found that “incumbency causes an eighteen percentage point increase in the probability that a candidate is successful in the next election,” compared with a much higher 40 and 30 percentage point increase for U.S. House incumbents and U.S. state legislative incumbents, respectively, which are elected by district.222
One possible reason that competitiveness increases under PRCV is that candidates seem to be more likely to campaign as part of slates, giving voters a clearer picture of the policy cleavages between candidates. Candidates may gain an advantage by campaigning as part of a team, or slate, and encouraging their supporters to rank all the members of the slate on their ballot, which through the redistribution of second and third choices as slate members exceed the election threshold or are eliminated may help other members of the slate win election. In the first PRCV election in Albany, California, the two winning candidates were part of a three-member slate, Albany Forward,
which had a joint candidate campaign account.223 Historically, slate-based campaigning has been very common in Cambridge as well. For almost six decades, from 1945 to 2003, the Cambridge Civic Association organized a competitive slate of candidates for City Council.224 However, in more recent decades, slates have ebbed and flowed in Cambridge elections. For example, a recent study of the city’s election found that there were no candidate slates between 2005 and 2011, but that slates re-emerged in 2013.225
Candidates who run as part of a slate in a PRCV election may adopt different campaign tactics than would a solo candidate or than would a slate member in a plurality at-large election to increase the likelihood of slate members being elected. For example, to minimize the risk that a slate member is eliminated early for having too few first choice votes, slate organizers may send mailers encouraging voters to support the slate but rotating which candidate is recommended as the first choice in different areas, to more evenly distribute first choice votes. For the same reason, slate members may focus their campaigning in different areas as well.226 Other strategic decisions include whether the slate should include as many candidates as their seats to be elected, or fewer. Because PRCV produces proportional results, if there are two modestly popular competing slates, it is unlikely that one slate could sweep the election; reducing the number of candidates may reduce the risk of first choice vote-splitting, strengthening the overall chances of slate members.227 Conversely, in Albany, the slate decided to run more candidates than there were available seats: while this meant one slate candidate would necessarily lose, slate organizers bet that running several popular candidates would draw in more overall support for the slate, which would then redistribute in a way that would help two of its candidates win.
Voter Understanding
One common concern with PRCV is that the process of ranking candidates, and the complicated method of translating votes into seats, may confuse voters, potentially resulting in an increase in ballot errors that may invalidate a person’s vote.
220 Robert Boatright, et al., Campaign Finance in the 2011 Worcester Elections (Worcester, MA: Clark University, April 30, 2012), https://wordpress.clarku.edu/rboatright/ files/2012/07/wcf-2011-final-paper.pdf
221 Based on election result data reported at: City of Cambridge (Massachusetts), “Official Election Results,” https://www.cambridgema.gov/Departments/ electioncommission/electionresults, n.d., accessed May 7, 2023.
222 Paul Redmond and John Regan. “Incumbency Advantage in a Proportional Electoral System: A Regression Discontinuity Analysis of Irish Elections.” European Journal of Political Economy 38 (June 2015): 244-245.
223 City of Albany (California), Public Portal for Campaign Finance Disclosure, (Albany Forward, Lopez, Miki, and Pilch for Council 2022, Form 460, filed January 31, 2023), https://public.netfile.com/pub2/?AID=ALB
224 Cambridge (Massachusetts) Civic Association, Cambridge Civic Journal. n.d., accessed May 8, 2023, www.rwinters.com/CCA/.
225 John and Leinz, “Polarization and Multi-Winner Ranked Choice Voting.” See also Santucci, More Parties or No Parties, 155.
226 David M. Farrell and Ian McAllister, “Through a Glass Darkly: Understanding the World of STV,” in Shaun Bowler and Bernard Grofman, eds. Elections in Australia, Ireland, and Malta under the Single Transferable Vote: Reflections on an Embedded Institution. (Ann Arbor: University of Michigan Press, 2000), 26-27.
227 Lewis Baston, Campaigning Under the Single Transferable Vote, Second Edition (London: Electoral Reform Society, 2006): 7, https://www.electoral-reform.org.uk/ wp-content/uploads/2017/06/Campaigning-under-the-single-transferable-vote.pdf. See also Santucci, More Parties or No Parties,154-155.
VI. OPTIONS FOR REFORM
54
If voter error is not equally distributed across demographic groups, it may also cause inequitable voting outcomes. San Francisco is likely better positioned than most jurisdictions to adopt PRCV, since a PRCV ballot is identical to a single-seat RCV ballot. However, because there will likely be a far greater number of candidates in an at-large PRCV contest than in a single-seat RCV district election, the likelihood of voter error may increase. The PRCV vote-counting methodology is more complicated than single-seat RCV, which may also cause voter confusion. While these are legitimate concerns, and indicate that a robust voter education campaign would need to be adopted prior to the adoption of PRCV, existing evidence does not suggest that PRCV will lead to significantly greater error rates than the existing RCV system.
Existing research on single-seat RCV suggests that most voters are able to cast a ranked ballot without difficulty, although there is conflicting evidence on how voter understanding may differ between demographic subgroups. Voter understanding of RCV can be measured in a number of ways, including voters’ self-reported understanding and ease of use, the voter ranking rate, and the ballot error rate. One report, which aggregated multiple studies on this topic, found that “[s]urvey data consistently show that voters are perfectly capable of ranking” and the “overwhelming majority of voters … say they understand how it works.”228 This is also true of studies that surveyed San Francisco voters. For example, exit polling after the first and second RCV elections in San Francisco found that
86-89% of voters in 2004 and 87% of voters in 2005 reported understanding RCV at least fairly well. In 2004, Black and Latino voters were more likely to report not understanding RCV; however, by 2005, there were no statistically significant differences in self-reported RCV understanding between racial groups.229 A later study, examining voter self-reported understanding of local election systems in Bay Area cities, found that voters reported similar levels of understanding RCV (87%), plurality elections (86%), and state top-two elections (89%) at least “somewhat well,” although more respondents reported understanding plurality elections “very well” or “extremely well” than RCV or top two systems.230 The study found “no differences in RCV cities in how whites, African Americans, and Latinx respondents reported understanding RCV;” Asians, however, were less likely to report understanding RCV, but also other election systems.
The rate at which ballots are invalidated due to voter error, also called the “overvote rate,” in single-seat RCV elections in San Francisco has generally been comparable to other systems. In an RCV election, an overvote occurs when a voter gives two candidates the same ranking (e.g. ranking two candidates as their first choice), whereas in elections involving non-ranked ballots, an overvote occurs when a voter votes for more candidates than there are seats to elect. A study by FairVote of San Francisco elections between 2010 and 2016 found that the overvote rate in supervisorial elections (an average of 0.61% of ballots cast) conducted using RCV was comparable to the overvote rate in Board of Education elections (0.63%) conducted using plurality at-large elections, but consistently lower than the rate for state elections (1.00%), which use a top two runoff.231 An academic study similarly found that the overvote rate in RCV and non-RCV races were comparable. That study also found that overvoting was more common in Black and Latino precincts under RCV, but that “similar discrepancies occur in non-[RCV] contests,” suggesting that RCV is in line with other election systems in this regard.232
It is possible that the voter error rate in a PRCV election will be higher than in a single-seat RCV election, especially since there will be more candidates in an average PRCV election than the average single-seat RCV election; some research specific to San Francisco elections suggests that the voter error rate in single-seat RCV contests increases as the number of candidates
228 Lee Drutman and Maresa Strano, What We Know About Ranked-Choice Voting, New America (November 10, 2021), www.newamerica.org/political-reform/reports/ what-we-know-about-ranked-choice-voting/
229 Francis Neely, Lisel Blash, and Corey Cook, An Assessment of Ranked-Choice Voting in the San Francisco 2004 Election (San Francisco: Public Research Institute at San Francisco State University, May 2005): 14; Francis Neely, Corey Cook, and Lisel Blash, An Assessment of Ranked-Choice Voting in the San Francisco 2005 Election (San Francisco: Public Research Institute at San Francisco State University, July 2006): 13.
230 Todd Donovan, Caroline Tolbert, and Kellen Gracey, “Self-reported Understanding of Ranked-Choice Voting,” Social Science Quarterly 100, no. 5 (2019): 1773.
231 Pedro Hernandez, Jennifer Pae, Madeline Brown, and Theodore Landsman, Voter Experience with Ranked Choice Voting in San Francisco: Voter Turnout and Use of Rankings, 2004-2016, FairVote (May 2018), https://fairvote.app.box.com/v/SanFranciscoReport
232 Francis Neely and Jason McDaniel, “Overvoting and the Equality of Voice under Instant-Runoff Voting in San Francisco,” California Journal of Politics and Policy 7, no. 4 (2015).
VI. OPTIONS FOR REFORM
“
55
“VOTERS ARE PERFECTLY CAPABLE OF RANKING... [AND THE] OVERWHELMING MAJORITY OF VOTERS … SAY THEY UNDERSTAND HOW IT WORKS”
increases, which would likely be the case in a PRCV election.233 However, the available data on modern PRCV elections also suggests that the voter error rate for these elections remains relatively low and comparable to other election systems.
FairVote, the nonprofit that advocates for RCV, maintains a database of election results for 37 PRCV elections used in six cities (Albany, CA; Arden, DE; Cambridge, MA; Eastpointe, MI; Henderson, NC; Minneapolis, MN) since 2001, which can be used to calculate the overvote rate in those cities.234 After removing eight elections with incomplete data, the data shows an average overvote rate of just under 1%, which is comparable to the overall overvote rate in non-PRCV elections.
We are not aware of any polling on voter self-reported understanding of just PRCV in the U.S. cities that use this system. Minneapolis, which uses both single-seat RCV and PRCV, comes the closest: a voter survey conducted after its 2017 elections found that 92% of voters reported that ranking preferences was “simple” and 66% supported future use of RCV in city elections compared with 16% who did not.235 Other data on the use of rankings in PRCV elections, suggest that voters understand how to use the system. The FairVote dataset shows that about 83% of voters in PRCV elections ranked two or more candidates.236 A separate study of PRCV elections just in Cambridge from 1997 to 2017 found that the median voter ranked five candidates.237
Internationally, Scotland, which has used PRCV in local elections since 2007, also reports relatively low levels of voter confusion with PRCV. In its first election after using PRCV in 2007, 1.85% of local government ballots were spoiled; however, this rate was lower than the spoilage rate for Scottish regional and parliamentary elections held in the same year, which were not conducted using PRCV. This rate was also lower than the spoilage rate in the prior 2003 local elections, conducted prior to the adoption of PRCV.238 The Scottish error rate seems to have held constant. In the most recent 2022 local elections, the overvote rate was again 1.85%. Moreover, in a poll of Scottish voters, 95% reported that their paper ballot was easy to fill out.239
Taken together, this evidence suggests that San Franciscans are likely to have no more difficulty voting using PRCV than single-seat RCV. Existing evidence of PRCV elections shows a similar voter error rate (around 1%) to other election systems. San Franciscans have an advantage in that voters have been voting using a ranked ballot for almost two decades; existing studies of voter understanding of single-seat RCV in San Francisco is generally high, which would likely translate over to PRCV. However, given the greater vote counting complexity of PRCV, there should be a significant investment in voter education prior to the adoption of any PRCV system.
Alternative Ways to Implement PRCV
PRCV could be used at the local level in at least three main options: at large, by multi-member district, or as part of a mixed election system. In at-large PRCV, candidates would run citywide. One way to conduct an at-large PRCV election is for all candidates to run at once, unstaggered in one election, which is how Cambridge, MA, conducts its elections. However, electing all 11 Supervisors at once would make the vote threshold very small — candidates would need just over 8% of the vote to be elected — and voters may have trouble ranking that many candidates. Advocates and academics generally recommend that somewhere between three to six candidates be elected at a time using PRCV, which provides reasonable proportionality of results while being less overwhelming for voters.240 A likelier alternative for San Francisco would be to hold staggered PRCV elections, with five candidates elected in one election cycle and six the next. This is the approach which was proposed to San Franciscans with Proposition H in 1996.
Another option would be to adopt a mixed RCV/PRCV system, where a certain number of seats (e.g. 6-8) are elected by district using single-member RCV, while the remainder (e.g. 3-5) are elected at large in one election using PRCV. Any of these options would change the number of districts in the City and would also require mid-cycle redistricting if implemented immediately. Alternatively, the size of the Board could be expanded to 15 members, keeping the current 11 by district
233 Francis Neely and Corey Cook. “Whose Votes Count? Undervotes, Overvotes, and Ranking in San Francisco’s Instant-Runoff Elections.” American Politics Research 36, no. 4 (July 2008): 530-554.
234 FairVote, “RCV Elections Database,” https://docs.google.com/spreadsheets/d/1lU6viuXfay323Gl6zkH5itwmrUIUo9rAzalK_ntu-ZY/edit#gid=1092371030, n.d., accessed May 8, 2023.
235 Minneapolis City Council Standing Committee on Elections & Rules, The 2017 Municipal Election: An Analysis & Recommendations, May 9, 2018, https://lim5. minneapolismn.gov/Download/RCA/4684/2017%20Municipal%20Election%20Report.pdf.
236 FairVote, “RCV Elections Database.”
237 Jack Santucci, “Factional Voting in Local Elections: The Case of Cambridge, MA,” Urban Affairs Forum February 7, 2019, archived at: https://web.archive.org/ web/20230201063158/https://www.urbanaffairsreview.com/2019/02/07/factional-voting-in-local-elections-the-case-of-cambridge-ma/
238 Lewis Baston, Local Authority Elections in Scotland (London: Electoral Reform Society, May 3, 2007): 14.
239 United Kingdom Electoral Commission, Report on the May 2022 Scottish Council Elections (London: Electoral Commission, Sepember 21, 2022), https://www. electoralcommission.org.uk/who-we-are-and-what-we-do/elections-and-referendums/past-elections-and-referendums/scotland-local-council-elections/report-may2022-scottish-council-elections
240 See, e.g., John M. Carey and Simon Hix, “The Electoral Sweet Spot: Low-Magnitude Proportional Electoral Systems.” American Journal of Political Science 55, no. 2 (April 2011): 395.
VI. OPTIONS FOR REFORM
56
seats and adding four at-large seats. This option would be the least politically disruptive of the status quo as current incumbents would be unaffected.
A final option would be to elect candidates from multi-member districts using PRCV. The 1995 Elections Task Force proposed electing the Board this way by dividing San Francisco into five districts with each district electing three members, in effect expanding the size of the Board to 15 members; this option was not pursued because expanding the size of the Board might be unpopular with voters. Portland, Oregon, will be using multi-member PRCV in 2024 to elect a 12-member city council in four, three-member districts. A downside to having an even-numbered city council is that it makes legislative tie votes possible; the Oregon charter resolves this by giving the Mayor the power to break tie votes (but not to veto legislation). Creating four or five multimember districts, if implemented prior to 2032, would also require mid-cycle redistricting.
Although research is limited on this point, somewhat different policy, campaign, and representational effects would likely be associated with each model:
• Staggered, at-large PRCV: Since there are no districts under this model, neighborhood representation would likely be the weakest, with a much higher risk that Supervisors are elected from just a few neighborhoods. At-large members would likely have a greater citywide perspective, but are also likely to be more closely aligned with issue-based or demographic constituencies. If slate candidates adopt a regional campaigning strategy, as occurs in Ireland, elected officials may have a closer focus on the region where they drew most of their support. Since more seats are elected at large, the election threshold would be the lowest. This would likely ensure strong demographic diversity – e.g., a six-seat election would have a 14% vote threshold, which is just above San Francisco’s Latino citizen voting age population (CVAP) of 12% – and would provide greater ideological or issue-based-constituency diversity. Greater ideological diversity may, however, lead to more factionalism on the Board, although one study did not find strong evidence of polarization in Cambridge, which elects all its members using at-large PRCV without staggering. While elections would be held citywide, with a low election threshold it is less clear how this would affect campaign costs. Since the number of votes needed to reach the vote threshold under at-large PRCV would still be higher than the number of votes needed to win a district election under the status quo, costs would likely be higher. Since districts are entirely eliminated, this option may be the most disruptive to the status quo.
• Mixed By District RCV and At-Large PRCV: This model would include a mix of neighborhood-oriented singlemember district Supervisors and citywide / demographic / issue-oriented at-large Supervisors. By reducing the number of districts, the number of voters per district would go up as well. District campaign costs would likely increase as a result, while at-large campaigns would likely be more expensive than the status quo as well. Latinos and Blacks may see their voting strength diminish in some districts as population is added, but may have even better prospects of winning at-large. For example, if there are four at-large seats, the vote threshold would be 20%, which is only 8% higher than Latino CVAP. In comparison, for a district the vote threshold is 50%, which is 24% higher than the current Latino CVAP in the City’s most Latino district. Since many incumbents would seek re-election in their enlarged district, this model would likely be the least disruptive of the status quo.
• Multimember PRCV: In this model, where 12 Supervisors might be elected from four districts, Supervisors would likely retain a neighborhood focus. However, districts would be twice as big and each have multiple members, so there may be more diverse views of what is in the best interest of a given district, which might decrease parochialism. The number of votes needed for election would still increase over purely by district elections, but by a smaller percentage than the other models. Since 2-3 existing districts would be merged to create the larger multimember districts, many incumbents would likely win re-election under this model.
Summary of PRCV Effects
PRCV council members elected at large are likely to have a citywide perspective; however, because of the lower election threshold, they may have a narrower focus than candidates elected under plurality at-large. PRCV elects candidates in proportion to their support, which should also lead to more proportional representation of any substantial constituency that voters prioritize, which may include political factions, but also other constituencies, including non-place based constituencies, for example renters. Other policy effects of PRCV at the local level are not as well studied.
The representational effects of PRCV have been more closely examined and modeled. In cities with racially polarized voting but where the minority community is geographically dispersed, PRCV may be the strongest option for providing diverse representation, and has been used as a voting rights remedy in several cities. There is some evidence that women and LBGTQ+ people, who are also geographically dispersed, may benefit
VI. OPTIONS FOR REFORM
57
most from this system. Finally, PRCV also may incentivize the creation of candidate slates, where the slate organizers would have an incentive to present an inclusive field. While PRCV is much more likely to result in proportional representation for communities of color than a plurality at-large system, it remains an at-large system, and thus is vulnerable to challenge under the CVRA.
The campaign finance effects of PRCV have also not been well studied. In theory, PRCV campaigns should be less expensive than traditional at-large races because the vote threshold to get elected is far less. However, the limited evidence from Cambridge suggests that these elections may be just as expensive as other local elections.
Summary of Options: Supervisor Elections
In this part of the report, we have analyzed a number of options for modifying the current by district system for electing members of San Francisco’s Board of Supervisors and have compared these alternatives with the current system. We have demonstrated that any choice (including maintaining the current election system) involves trade-offs. That said, after careful review, we believe that a mixed system for electing the Board of Supervisors that harmonizes local representation and citywide perspectives could serve San Francisco well and deserves serious consideration. Adding at-large seats would necessarily require deciding what voting formula should be used to fill those seats. The two systems examined in this report, plurality and PRCV, each have benefits, downsides, and unknowns to consider.
At-Large, By District, or Mixed
The natural tendency of by district election systems is to promote parochialism. District Supervisors are electorally incentivized to focus on the needs of their district, or the needs of the loudest voices within their district, which can sometimes conflict with the needs of the city as a whole. This conflict is especially pronounced as relates to necessary but locally unpopular land uses such as building multi-family housing or providing services to the unhoused, two areas where San Francisco needs to make significant and rapid progress. Adding an at-large element to San Francisco’s election system would likely make Supervisors more resistant to NIMBYism and may better align Supervisors’ incentives with the needs of a City in transition.
However, we do not recommend that the City revert to fully atlarge elections, whether elected using plurality voting or PRCV.
San Francisco’s long history of switching between at-large and by district election systems demonstrates that there is a strong desire in this City for neighborhood representation that is unlikely to fade. Districts also uniquely ensure that every area of the City has an advocate on the Board, which may also lead to a more geographically equitable distribution of resources as well as locally undesirable land uses.
Finally, while voting patterns in San Francisco do not suggest this would be the case here, plurality at-large election systems in general are at a greater risk of electing governing boards where racial minorities are under-represented. In California, at-large election systems are also uniquely vulnerable to being struck down under the California Voting Rights Act (CVRA).
Re-adopting purely at-large elections would also make San Francisco one of the very few and by far the largest big city to use this system. By contrast, many big cities have mixed systems –some members elected at large and some by district– which suggests that there is a more universal desire, once a city reaches a certain population size, for there to be some guarantee of neighborhood representation on the local governing board. While this system has been less studied, the available evidence is that mixed systems provide governing boards with a more balanced policy perspective that accounts for both neighborhood and citywide needs. Mixed systems are not immune from suit under the CVRA, but are likely to be less vulnerable than purely at-large systems.
Plurality At-Large or PRCV
If San Francisco adopted a mixed system but kept its Board size to 11 Supervisors, some district seats would be converted into at-large seats. In most cities with mixed systems, a majority of the city council is elected by district and the remainder is elected at large. For San Francisco, changing 3 to 5 district seats to at-large seats may be appropriate. The City would also need to decide on a manner of electing the at-large members. Two methods were considered in this report. The at-large members could be elected using plurality voting, which is the most common method for electing at-large members in U.S. municipal elections, or PRCV, which is the multi-seat version of the RCV system San Francisco uses today, but only used in nine cities in its at-large form. Both systems involve trade-offs and, as a less-used system in the U.S., the policy effects of PRCV are less well known.
Plurality voting is simple for the voter and tends to elect members with a citywide perspective, especially on land use matters; however, because a cohesively voting majority can elect every seat under this system, it carries a greater risk of under-representing political or racial minorities on the Board than PRCV. Using plurality at-large, including as part of a mixed
VI. OPTIONS FOR REFORM
58
system, would likely have a higher legal risk under the CVRA than PRCV.
Compared with plurality voting, PRCV is significantly more complicated; however, to the voter, a PRCV ballot would look identical to the single-seat RCV ballot that San Franciscans currently use, and would presumably continue to use as part of a mixed system to elect district Supervisors. PRCV’s chief benefit is that it produces representation in fairly close proportion to how the electorate is voting. As a result, this system is more likely to result in a demographically diverse Board than plurality voting, which also lessens this system’s legal risk. The legislative effects of PRCV are less well understood. Since PRCV is an at-large election system, PRCV Supervisors may be likely to have a more citywide perspective than district Supervisors. However, PRCV candidates that have the support of a significant-enough constituency, based on the number of seats up for election, can be elected, which may also lead PRCV officials to have a narrower focus in office than office holders elected by plurality voting.
Other Considerations
If San Francisco were to adopt a mixed system, the City would need to make other adjustments to its elections, namely concerning election timing and drawing the new district seats, to accommodate this change.

Election timing
San Francisco currently staggers its supervisorial elections so that six members are elected in presidential election years along with the Mayor and five members are elected in gubernatorial election years. If a mixed system is adopted, we recommend San Francisco consider changing the staggering of supervisorial elections so that at-large Supervisors are always elected in presidential elections with the Mayor (beginning in 2028) and district Supervisors are elected in gubernatorial elections (beginning in 2026). Electing at-large members one cycle and district members the next ensures that, at each election, every voter has an opportunity to elect a Supervisor. If district members are not staggered, for example, some voters would vote twice for Supervisor in one election cycle (for their at-large and district Supervisor) and then not at all the next cycle. This diminishes the ability of the electorate as a whole to hold the Board accountable every two years. Separating when at-large and district Supervisors are elected would also reduce voter confusion since voters would not have to contend with two different sets of voting rules for Supervisor on the same ballot. The likelihood of confusion, and potential ballot error, could be even greater if district members are elected using single-seat RCV but at-large members are elected using plurality voting, since the former uses a ranked ballot and the latter does not.
Timing at-large supervisor elections with the mayoral election may also have benefits. At-large Supervisors are likely to be stronger
A MIXED SYSTEM FOR ELECTING THE BOARD OF SUPERVISORS THAT HARMONIZES LOCAL REPRESENTATION AND CITYWIDE PERSPECTIVES COULD SERVE SAN FRANCISCO WELL AND DESERVES SERIOUS CONSIDERATION

VI. OPTIONS FOR REFORM
59
mayoral candidates than district Supervisors because they are likely to have a higher profile and more citywide policy focus. This timing better sets up termed-out at-large Supervisors to run for Mayor. Moreover, with this timing, mayoral candidates would likely run with an affiliated slate of at-large Supervisor candidates pledged to implementing their policy vision. Since voters are likely to support the slate that supports their preferred mayoral candidate, this timing change could encourage greater policy alignment between the Board and Mayor. Timing mayoral with district supervisorial elections is unlikely to produce the same level of alignment, since district campaigns are not conducted on a citywide basis and may focus on issues of local over citywide importance.
Redistricting Task Force
If San Francisco adopted a mixed system with a smaller number of Supervisors elected by districts, boundaries would need to be immediately adopted for these new districts. As discussed previously, under current law this responsibility would go to a Redistricting Task Force consisting of three mayoral appointees, three Board appointees, and three appointees by the Elections Commission. While the balancing of mayoral and Board appointees was designed to ensure the Task Force would act fairly and not prioritize one political faction over another, this appointment practice led to significant controversy this past cycle. The Task Force was accused of drawing districts to advance one political faction over another and Task Force members were accused of secretly taking direction from the elected officials who appointed them.
To promote public trust in the new districts that would need to be drawn, we recommend San Francisco consider changing the appointment method of Redistricting Task Force members so that no member is directly appointed by an elected official. California has pioneered the use of independent redistricting commissions at the state and local level and there are now well-developed models for how to structure such commissions to be politically independent.241 While, generally, there is a strong argument that city commissions that develop or implement executive branch policy should be mission-aligned with the Mayor, who is the City’s chief executive, the Redistricting Task Force has a specialized function relating to election administration, where political fairness is an overriding consideration. Reports have found that independent commissions, when politically insulated from a jurisdiction’s elected officials, have a stronger track record of producing more representative
241 Heidorn, California Local Redistricting Commissions, 1.
districts and not engaging in political gerrymandering than when incumbents draw their own lines.242 Moreover, current proposed legislation, pending before the California Legislature, may also prohibit the current method of appointing San Francisco’s Redistricting Task Force going forward.243
Mayor’s Powers
We now turn from our discussion of potential electoral reforms to options for governance reforms, starting with the Mayor’s powers.
As we have noted, San Francisco has chosen a “strong mayor” form of government rather than a council-manager system. Under a strong mayor system, the Mayor is the city’s chief executive officer. In 1996, the new Charter specifically vested in the Mayor greater institutional authority on the view that, as the City’s CEO and the official most directly responsible (and electorally accountable) for its governance, the Mayor needed sufficient powers and resources to govern. The 1996 Charter struck a careful balance between the powers of the Mayor and the Board of Supervisors. Since 1996, however, the City has adopted a series of Charter amendments that have systematically weakened the Mayor’s institutional authority. While we assume these limitations served legitimate ends when they were put in place, we conclude that, in aggregate, they now excessively constrain the Mayor’s ability to lead at a time when effective leadership from the City’s chief executive is clearly needed.
Accordingly, we recommend that the City reassess the limits the Charter places on the Mayor’s powers. We particularly emphasize the need to review current limitations on the Mayor’s ability to appoint and remove commissioners and department heads, as we discuss further in the following section on reforms to the commission system. In addition, we recommend considering repeal of current limitations set forth in Charter Art. III, § 3.100 (12) regarding the responsibilities and compensation of members of the Mayor’s staff. We recognize that any changes to the powers of the Mayor or the Mayor’s office in relation to the Board of Supervisors, the Chief Administrative Officer, the commissions, or other elements of city government require careful thought, but we conclude that the current limitations on the Mayor’s powers significantly impair the City’s ability to meet current challenges and should be given priority attention when considering reforms.
242 See, e.g., Raphael Sonenshein, When the People Draw the Lines: An Examination of the California Citizens Redistricting Commission (Sacramento, CA: League of Women Voters of California, 2012), https://cavotes.org/sites/default/files/jobs/RedistrictingCommission%20Report6122013.pdf; Heidorn, “The Promise of Fair Maps,” 4. 243 California Legislative Information, Bill Information, Assembly Bill 1248 (Bryan) (2023), https://leginfo.legislature.ca.gov/faces/billNavClient.xhtml?bill_ id=202320240AB1248
VI. OPTIONS FOR REFORM
60
Table 11. Number of Commissions, 10 Largest CA Cities and Other Comparable Cities
Sources: David Chiu, List of City Boards, Commissions, and Advisory Bodies Created by Charter, Ordinance, or Statute, City and County of San Francisco Office of the City Attorney, last updated October 24, 2022, https://www.sfcityattorney.org/good-government/list-of-commissions-boards/; city websites for all other cities.
Commission System
We recommend that San Francisco pursue a thorough review of its commission system, with consideration of reforms outlined below.
First, San Francisco should consider reducing the total number of commissions. Almost all the leaders we interviewed expressed the view that 130 commissions is too many and that the commission system should be reined in. A few went further and suggested that commissions should be eliminated entirely. This report does not advocate eliminating the commission system. Several leaders shared that commissions gather public input in a way that is important to San Francisco’s civic life. Without that avenue, the Board of Supervisors and city staff would need to assume a much larger role in engaging public input. The oversight and appellate role of certain commissions is also a necessary check on the actions of the executive departments. Finally, it may not be advisable to turn away 1,200+ engaged residents who currently fill commission seats. Instead, San Francisco should consider retaining the commission system but reducing their total number, in part by combining related commissions. For example, the City
has at least five commissions dealing with children.244 Although each has a distinct focus, it may be possible to consolidate their functions.
How many commissions should San Francisco have?
Some interviewees suggested 30-40, but it is not possible to determine the optimal number without an exhaustive review.
A commission reform committee could undertake the task of determining which boards and commissions are necessary, weighing the trade-off between less direct public involvement against some gain in efficiency. It is worth noting, however, that San Francisco has many more commissions than other large California cities. This difference is partly attributable to the fact that San Francisco is a combined city and county. Denver, another combined city and county, also lists 130. However, 44 of Denver’s 130 boards and commissions are business improvement districts or local maintenance districts, each with its own appointed board. Without those 44, Denver is left with 86 boards and commissions — far fewer than San Francisco’s 130.245
244 Children Youth and Their Families Oversight and Advisory Committee, Children and Families First Commission (also called First Five San Francisco), Our Children Our Families Council, Child Care Planning and Advisory Council, and Early Childhood Com munity Oversight and Advisory Committee. Chiu, List.
245 “Boards and Commissions,” City and County of Denver, n.d., accessed April 16, 2023, https://www.denvergov.org/Government/Agencies-Departments-Offices/ Agencies-Departments-Offices-Directory/Mayors-Office/About/Boards-and-Commissions
VI. OPTIONS FOR REFORM
CALIFORNIA CITIES NUMBER OF COMMISSIONS OTHER CITIES NUMBER OF COMMISSIONS SAN FRANCISCO 130 DENVER 130 LOS ANGELES 49 AUSTIN 93 SAN DIEGO 49 INDIANAPOLIS 83 SAN JOSÉ 39 NASHVILLE 80 OAKLAND 37 SEATTLE 76 FRESNO 36 JACKSONVILLE 66 SACRAMENTO 31 CHARLOTTE 35 LONG BEACH 30 FORT WORTH 31 ANAHEIM 16 COLUMBUS 24 BAKERSFIELD 15
61
Table 12. Number of Signatures Needed to Qualify Ballot Measures in San Francisco
Finally, the commission review process should consider eliminating the power of commissions to interpose themselves between the Mayor and department heads. In many cases, the Charter limits the Mayor’s power to appoint the heads of city departments by requiring the Mayor to choose from a list of three candidates submitted by the commission that oversees the department. The Mayor can suggest candidates to the commission, but the commission does not have to accept those suggestions. Similarly, in many cases commissions can limit the Mayor’s power to remove department heads. The Mayor may recommend that the commission remove the official, but the commission is not obligated to do so. The commission has a duty to act on the recommendation within 30 days, but has the power either to accept or reject the Mayor’s request.
In broad terms, the current operation of the Commission system has the effect of empowering commissions at the expense of the City’s elected executive. That arrangement should be thoroughly reviewed with an eye to reform.
Sources: San Francisco Department of Elections, Guide to Qualifying San Francisco Initiative Measures March 5, 2024, Presidential Primary Election (April 2023), https://sf.gov/sites/ default/files/2023-04/QualifyingInitiativeMeasuresGuide_ March52024.pdf; San Francisco Department of Elections, “Current Registration Counts,” updated May 10, 2023. https://www.sfelections.org/tools/election_data/
San Francisco should consider rationalizing the commission appointment process and strengthening the Mayor’s appointment power. Many of the leaders we interviewed endorsed this change. The current system is a tangle of appointment methods, and consideration should be given to vesting in the Mayor exclusive power to appoint and to remove commissioners for all policymaking boards and commissions, without requiring approval from the Board of Supervisors. Under the current system, even many appointments nominally made by the Mayor are de facto steered by the Board of Supervisors because the Mayor is forced to choose people who will be palatable to the Board. The Mayor needs to be able to rely on commissioners to implement the administration’s policies and to remove those who are unwilling to do so.
It should be noted, however, that some boards and commissions should be independent. Those that operate as quasi-judicial bodies, such as the Board of Appeals, should be staffed with commissioners with some degree of independence from the Mayor and the Board of Supervisors. These boards do not set policy, they interpret policy, so some independence from politics is important to promote public trust in the fairness of their holdings. Similarly, commissions with purely oversight functions such as the Ethics Commission should also be independent. Finally, some commissions with highly specialized purposes, such as the Redistricting Task Force, discussed above, may call for greater independence from the political process.
Ballot Measures
Finally, we turn to ballot measures. As discussed above, San Francisco has an extraordinarily active system of direct democracy, fueled by rules that allow both citizens and government officials easy access to the ballot. The system has the beneficial effect of allowing citizens to weigh in directly on a wide range of policy topics, but also raises concerns about excess, including overlong ballots and the growth of unamendable voter-approved mandates and prohibitions on city government.
We recommend the City consider ways to maintain the ballot measure system’s essential benefits while also limiting its excesses. More specifically, we suggest focusing on three areas: the signature thresholds for citizen-initiated non-charter amendments; the power of the Board of Supervisors and the Mayor to place measures on the ballot; and the power of the Board and Mayor to amend measures after they have been approved by voters.
Petition Signature Thresholds
We recommend San Francisco consider raising the signature threshold for non-charter ballot measures.
As noted in the previous section, state law governs San Francisco’s signature requirement for placing charter amendments on the ballot (10% of registered voters), which is lower than other charter cities (15% of registered voters). Presently, San Francisco’s 10% requirement translates to about 50,000 signatures for charter amendments. By contrast, San Francisco has set a very low bar for qualifying non-charter ballot initiatives (2% of registered voters), which, at present, translates to about 10,000 signatures. (See Table 12.)
VI. OPTIONS FOR REFORM
Second, San Francisco should consider rationalizing the Second,
SIGNATURE REQUIREMENTS SIGNATURES REGISTERED VOTERS (LAST UPDATED MAY 10, 2023) 502,122 10% REG VOTERS (CHARTER AMENDMENTS) 50,212 2% REG VOTERS (CURRENT REQUIREMENT, NON-CHARTER MEASURES) 10,042 5% REG VOTERS (POTENTIAL REQUIREMENT, NON-CHARTER MEASURES) 25,106
62
San Francisco could choose to align with most other jurisdictions in the state by raising the requirement for non-charter initiatives to 10% of registered voters. However, this approach would make San Francisco’s signature requirements the same for charter amendments and non-charter measures, which might induce proponents to craft ballot proposals as charter amendments rather than non-charter measures. This is especially likely if non-charter measures become more easily amendable than charter amendments (see below).
Accordingly, we recommend San Francisco consider raising the signature requirement for non-charter measures to 5% of registered voters, which currently would translate to about 25,000 signatures. This reform would bring San Francisco’s signature requirement into line with San José, which, among peer jurisdictions, currently has the second-lowest bar, and would keep San Francisco’s requirement below other peer jurisdictions. A 5% rule also would maintain a meaningful distinction between the signature requirements for charter amendments and non-charter measures.
Referrals by the Board and Mayor
Another problematic feature of the City’s ballot measure system is the ease with which the Board and the Mayor can place measures on the ballot. In our interviews, several leaders noted that the current rules allow factions within City Hall to use ballot measure process to pursue political conflict. This problem is accentuated because a minority of the Board of Supervisors (four of 11) can run to the ballot, or threaten to do so. The wide open access contributes to the problem of long, complex ballots and the cumulation of voter-approved measures that cannot be amended without returning to the ballot. The current rules also reduce incentives for bold action, as the Mayor or a Board majority must always weigh whether their action may prompt an opposing ballot measure from a Board minority.
We recommend San Francisco consider ways to stem the heavy flow of measures from City Hall to the ballot. A priority for consideration should be eliminating the power of a minority of Supervisors to place measures on the ballot by requiring majority Board approval for any referrals. Two other reforms warrant consideration: Giving the Mayor a veto over Board referrals (subject to Board override), and eliminating the Mayor’s unilateral power to put measures before voters. Any such limitations should be considered in relation to each other, to maintain a proper balance of power between the Mayor and the Board of Supervisors.
In combination, these proposals would require the Board of Supervisors and the Mayor to forge a broader internal consensus before placing ballot measures before voters. Of course, if representatives are unable to reach consensus, one or more of them could still use the petition process to put a proposal on the ballot.
Amendments to Voter-Approved Measures
Perhaps the most serious concern about San Francisco’s ballot measure system is that it produces, year after year, mandates and prohibitions on city government that can’t be altered without returning to the ballot for voter approval.
We recommend San Francisco consider allowing, with certain limitations, the Board to amend or repeal non-charter ballot measures after they have been approved by voters.
We note that prior reform efforts have sought, without success, to adopt a change of this type. In 2011, the Board of Supervisors placed on the ballot Proposition E, which would have allowed the Board and Mayor to amend or repeal non-charter ballot measures. The proposal applied only to those measures placed on the ballot by either the Board or the Mayor (called “legislative initiatives”), not citizen-initiated measures. The proposal would have qualified this power by prohibiting the Board of Supervisors and the Mayor from amending or repealing a voter-approved measure until three years after the measure’s effective date and by requiring a two-thirds vote of the Board to amend or repeal the measure until seven years after its effective date.246
Although Proposition E was supported by a majority of the Board of Supervisors and by government reform groups such as San Francisco Planning + Urban Research (SPUR), voters rejected Proposition E by a two-to-one margin, 67-33 percent.247 This outcome suggests that this type of reform (or other other reforms to the ballot measure system that are perceived as limiting citizen power), are difficult to achieve. Nevertheless, in light of its deepening governance challenges, we recommend the City consider revisiting this concept. More broadly, the evidence is clear that the current operation of San Francisco’s ballot measure system is contributing to the City’s governance crisis. Accordingly, the City should seriously consider a range of prudent reforms to the system, including the potential reforms set forth in this report. •
VI. OPTIONS FOR REFORM
246 San Francisco Department of Elections, Voter Information Pamphlet and Sample Ballot: November 8, 2011 Consolidated General Election, “Proposition E: Amending or Repealing Legislative Initiative Ordinances and Declarations of Policy,” 83-88, 173-174, https://webbie1.sfpl.org/multimedia/pdf/elections/november8_2011.pdf. 247 San Francisco Department of Elections, Results Summary: November 8, 2011 Consolidated Municipal
Election, https://www.sfelections.org/results/20111108/.
63
SUMMARY & CONCLUSIONS VII
• San Franciscans believe their government is failing to meet the current crisis
• The City’s current institutional design is partly to blame

• Structural reforms are not panaceas and any changes to an institutional design involve trade-offs
• That said, several changes to the design of San Francisco’s government could improve its ability to meet the challenges the City faces
This report begins and ends with the premise that San Francisco faces a crisis and needs its government to lead an effective response. To meet the challenges of the coming years, City Hall must function at a high level. Is it able to do so? Polls show a majority of San Franciscans are pessimistic, believing that the crisis is acute but the response is lacking. Is the design of city government contributing to the problem? This report suggests that it is. At a time when San Francisco needs a citywide perspective and strong leadership, its structures don’t adequately serve those ends.
When the City’s current Charter was adopted almost three decades ago, it marked an improvement over the oft-amended Charter of 1932 in that it shifted power from unelected officials and commissions to the electorally accountable Mayor and Board of Supervisors. Over time, however, a series of charter amendments have upset the balance the 1996 Charter struck between the Mayor, Board of Supervisors, city staff, and commissions by “methodically chip[ping] away” at the Mayor’s
powers. As a consequence, the one elected official who has both a citywide constituency and the institutional responsibility to manage the City’s government has been weakened just when effective leadership from that office is most needed.
At the same time, the transition in 2000 to district-based supervisorial elections, while satisfying voters’ desire for local representation, has further fragmented city government as Supervisors are now incentivized to focus more on the interests of their districts than on the long-term, collective interests of the City as a whole.
Two other features of San Francisco government—the commission system and the ballot measure process—provide opportunities for the public to participate in the policy process, but they have become so large and cumbersome that they complicate and often paralyze action by city government.
In combination, these factors make it difficult for City Hall to solve San Francisco’s most pressing issues.
64
This report concludes that San Francisco should consider the following reforms:
Election system
Consider alternatives to the existing by district system for supervisor elections. The current by district system prioritizes neighborhood representation, but limits the Board of Supervisors’ citywide perspective. Specifically, consider systems that combine district and at-large elements to better balance both values. A “mixed” or “hybrid” system could serve San Francisco’s interest in harmonizing neighborhood representation and a greater focus on the needs of the City as a whole. Two voting formula options for the at-large seats in a mixed system are explored in this report: a plurality at-large system or PRCV system. There is significant evidence that adopting plurality at-large voting would incentivize a more citywide policy approach, which might, for example, prioritize building more housing. However, this system may result in the election of Supervisors who are less demographically and politically representative of the City’s electorate. This system is also at a higher risk of being invalidated under the CVRA.
The report recommends San Francisco consider an alternative approach to electing at-large seats called Proportional Ranked Choice Voting (PRCV). San Francisco was the first major city to use RCV in modern times and could be among the first to use PRCV. PRCV is likely to elect a more representative body and carries a much lower legal risk, but the policy incentives under this system, and whether or how these incentives differ from traditional at-large elections, has not been well studied.
Mayor’s powers
Consider reforms to enhance the Mayor’s capacity to govern. The 1996 Charter strengthened the Mayor’s office, but subsequent changes to the Charter have eroded that authority. Reforms that could strengthen the office include increasing the Mayor’s power to appoint and remove commissioners and department heads and expanding the Mayor’s ability to hire top-flight staff.
Commission system
Consider a system-wide evaluation of the City’s commission system. Individual commissions provide value to the City government, but their number has expanded greatly, and collectively they now impede efficient public administration. The commission review process should consider reducing the total number of commissions; combining commissions with overlapping jurisdictions; standardizing, where possible, rules for selection and removal of commissioners; and rebalancing the power of the Mayor and Board to appoint and remove commissioners.
Ballot measures
Consider reforms to the City’s ballot measure process. Direct democracy is an essential feature of San Francisco government, but the City’s permissive rules for ballot access produce overlong ballots and unamendable prohibitions and mandates. Consider modifying the system by raising the signature threshold for citizen-initiated non-charter measures; eliminating the power of a minority of Supervisors to place measures on the ballot; eliminating the Mayor’s power to place measures on the ballot; giving the Mayor the power to veto Board-proposed ballot measures; and granting the Board and Mayor carefully limited power to amend ballot measures after they have been approved by voters.
Would these reforms make a difference?
Although no institutional reform, by itself, can solve all of San Francisco’s problems, we conclude that carefully crafted reforms along the lines described in this report could strengthen the City’s ability to meet its current crisis and future challenges. •
65
REFERENCES
Abott, Carolyn, and Asya Magazinnik. “At-Large Elections and Minority Representation in Local Government.” American Journal of Political Science 64, no. 3 (July 2020): 717-733.
Adams, Brian E. Campaign Finance in Local Elections: Buying the Grassroots. Boulder, CO: FirstForumPress, 2010.
Adams, Brian E. “Financing Local Elections: The Impact of Institutions on Electoral Outcomes and Democratic Representation.” PS: Political Science & Politics 44, no. 1 (January 2011): 111-112.
Adams, Brian E. “Campaigning in Lilliput: Money’s Influence in Small and Mid-Sized City Elections.” California Journal of Politics and Policy 10, no. 2 (2018): 1-17.
Amy, Douglas J. “The Forgotten History of the Single Transferable Vote in the United States.” Representation 34, no. 1 (1996): 13-20.
Amy, Douglas J. Behind the Ballot Box: A Citizen’s Guide to Voting Systems. Westport, CT: Praeger, 2000.
Anzia, Sarah, and Rachel Bernhard. “Gender Stereotyping and the Electoral Success of Women Candidates: New Evidence from Local Elections in the United States.” British Journal of Political Science 52, no. 4 (2022): 1544-1563.
Arroyo, Noah. 2022. “How fed up are San Franciscans with the city’s problems?” San Francisco Chronicle, September 13, 2022. https://www.sfchronicle. com/bayarea/article/sfnext-poll-sentiment-17435794.php
Ashe v. Zemansky, 192 Cal. 83 (1923).
Ault, Alex. The Forgotten Results & Future Promise of Ranked Choice Voting in Ohio FairVote, July 24, 2018. https://fairvote.org/report/ the_forgotten_results_future_promise_of_ranked_choice_voting_in_ohio_1/
Bajko, Matthew S. “Political Notebook: Sacramento could see its first outcouncilman.” Bay Area Reporter, November 30, 2011, https://www.ebar.com/ story.php?242073
Baldassare, Mark. Reforming California’s Initiative Process (San Francisco: Public Policy Institute of California: October 2013), https://www.ppic.org/ wp-content/uploads/content/pubs/atissue/AI_1013MBAI.pdf
Baldassare, Mark, Dean Bonner, Rachel Lawler, and Deja Thomas. PPIC Statewide Survey: Californians and Their Government. San Francisco: Public Policy Institute of California, February 1, 2023. https://www.ppic.org/publication/ ppic-statewide-survey-californians-and-their-government-february-2023/
Barber, Kathleen L. A Right to Representation: Proportional Election Systems for the Twenty-First Century. Columbus: The Ohio State University Press, 2000.
Barrero, Jose Maria, Nicolas Bloom, and Steven J. Davis. “Why Working from Home Will Stick,” NBER Working Paper No. 28731, April 2021. https:// www.nber.org/papers/w28731
Baston, Lewis. Campaigning Under the Single Transferable Vote, 2nd ed. London: Electoral Reform Society, 2006. https://www.electoral-reform.org.uk/ wp-content/uploads/2017/06/Campaigning-under-the-single-transferable-vote.pdf
Baston, Lewis. Local Authority Elections in Scotland. London: Electoral Reform Society, 2007. https://www.electoral-reform.org.uk/wp-content/ uploads/2017/06/2007-Scottish-local-elections.pdf.
Benadè, Gerdus, Ruth Buck, Moon Duchin, Dara Gold, and Thomas Weighill. The Future is Proportional: Improving Minority Representation through New Electoral Systems. New America, March 1, 2021. https://www.newamerica.org/political-reform/reports/the-future-is-proportional/
Berry, Barbara L., and Thomas R. Dye. “The Discriminatory Effects of At-Large Elections.” Florida State University Law Review 7, no. 1 (Winter 1979): 85-122.
“Boards and Commissions” (City of Denver). n.d. City of Denver, accessed April 16, 2023. https://www.denvergov.org/Government/ Agencies-Departments-Offices/Agencies-Departments-Offices-Directory/Mayors-Office/About/Boards-and-Commissions
Boatright, Robert, et al. Campaign Finance in the 2011 Worcester Elections. Worcester, MA: Clark University, April 30, 2012. https://wordpress.clarku. edu/rboatright/files/2012/07/wcf-2011-final-paper.pdf
Bochel, Hugh, and Catherine Bochel. “Women Candidates and Councilors in Scottish Local Government, 1974–2012.” Scottish Affairs 25, no. 2 (May 2016): 161-185.
Bowler, Shaun, and Todd Donovan. The Limits of Electoral Reform. New York: Oxford University Press, 2013.
Boylan, Richard. “The Impact of Government Structure on Local Public Expenditures.” Public Choice 136, no. 3 (September 2008): 457-473.
Breed, London N. Proposed Budget: Fiscal Years 2021-2022 and 2022-2023 (San Francisco: Mayor’s Office of Public Policy and Finance, July 2020). https://sfmayor.org/sites/default/files/FY22%20and%20FY23%20Budget%20Book%20Final%20for%20Web.pdf
66
Brousseau, Fred. Memorandum to Supervisor Connie Chan Regarding Options for Addressing Economic and Tax Revenue Trends in Downtown San Francisco, (San Francisco: Board of Supervisors Budget and Legislative Analyst, February 24, 2023): 1-49. https://sfbos.org/sites/default/files/BLA. DowntownSF.Economy%20Tax.022423.pdf
California Cannabis Coalition v. City of Upland, 3 Cal.5th 924 (2017).
“California Elections Data Archive.” California State University, Sacramento, Institute for Social Research. Accessed April 9, 2023. https://csu-csus.esploro. exlibrisgroup.com/esploro/outputs/dataset/California-Elections-Data-Archive-CEDA/99257830890201671?institution=01CALS_USL
California Legislative Information. Bill Text, Senate Bill 212 (Allen) (2019). https://leginfo.legislature.ca.gov/faces/billTextClient. xhtml?bill_id=201920200SB212
California Legislative Information. Bill Information, Assembly Bill 1248 (Bryan) (2023). https://leginfo.legislature.ca.gov/faces/billNavClient. xhtml?bill_id=202320240AB1248
Cambridge (Massachusetts) Civic Association. Cambridge Civic Journal n.d., accessed May 8, 2023. www.rwinters.com/CCA/
Carey, John M., and Simon Hix. “The Electoral Sweet Spot: Low-Magnitude Proportional Electoral Systems.” American Journal of Political Science 55, no. 2 (April 2011): 383-397.
“Charter Reform.” SPUR Newsletter. (October 1995).
Chappell, Jim. “Directing the Resurgence of SPUR & Urban Planning in San Francisco.” Interviews conducted by Shanna Farrell and Todd Holmes, Oral History Center, The Bancroft Library. (Berkeley: The Regents of the University of California, 2017): 71-75.
Chapple, Karen, Michael Leong, Daniel Huang, Hannah Moore, Laura Schmahmann, and Joy Wang. Research Brief: The Death of Downtown?: Pandemic Recovery Trajectories across 62 North American Cities. UC Berkeley: Institute of Governmental Studies. (June 2022). https://escholarship.org/ uc/item/9sj175mr
Chiu, David. List of City Boards, Commissions, and Advisory Bodies Created by Charter, Ordinance, or Statute. (San Francisco: Office of the City Attorney, October 24, 2022.)
https://www.sfcityattorney.org/good-government/list-of-commissions-boards/
Charter of the City and County of San Francisco, amended as of November 2022. https://codelibrary.amlegal.com/codes/san_francisco/latest/ sf_charter/0-0-0-52610
City and County of San Francisco v. All Persons Interested in the Matter of Proposition C, 51 Cal.App.5th 703 (2020).
City of Albany (California). Public Portal for Campaign Finance Disclosure, (Albany Forward, Lopez, Miki, and Pilch for Council 2022, Form 460, filed January 31, 2023). https://public.netfile.com/pub2/?AID=ALB
City of Cambridge (Massachusetts). Official Election Results. n.d., accessed May 7, 2023. https://www.cambridgema.gov/Departments/ electioncommission/electionresults,
City of Santa Clarita (California). “District Elections.” n.d., accessed March 31, 2023. https://www.santa-clarita.com/city-hall/district-elections
Clark, Alistair. “The Effects of Electoral Reform on Party Campaigns, Voters and Party Systems at the Local Level: From Single Member Plurality to the Single Transferable Vote in Scotland.” Local Government Studies 47, no. 1 (2021): 79-99.
Clingermayer, James. “Electoral Representation, Zoning Politics, and the Exclusion of Group Homes.” Political Research Quarterly 47, no. 4 (December 1994): 969-984.
Clingermore, James, and Richard Feiock. Institutional Constraints and Policy Choice: An Exploration of Local Governance. Albany: State University of New York Press, 2001.
Collingwood, Loren, and Sean Long. “Can States Promote Minority Representation? Assessing the Effects of the California Voting Rights Act.” Urban Affairs Review 57, no. 3 (May 2021): 731-762.
Crowder-Meyer, Melody, Shana Kushner Gadarian, and Jessica Trounstine. “Electoral Institutions, Gender Stereotypes, and Women’s Local Representation.” Politics, Groups, and Identities 3, no. 2 (April 2015): 318-334.
Crowfoot, Wade. “District Elections in San Francisco.” Urbanist, SPUR, February 1, 2000. https://www.spur.org/publications/ urbanist-article/2000-02-01/district-elections-san-francisco
Davidson, Chandler, and Bernard Grofman. “The Effect of Municipal Election Structure on Black Representation in Eight Southern States.” In Quiet Revolution in the South: The Impact of the Voting Rights Act, 1965-1990, edited by Chandler Davidson and Bernard Grofman. Princeton, NJ: Princeton University Press, 1994.
Department of Justice, “Justice Department Reaches Agreement with City of Eastpointe, Michigan, Under the Voting Rights Act” Press Release No. 19-623, June 5, 2019, https://www.justice.gov/opa/pr justice-department-reaches-agreement-city-eastpointe-michigan-under-voting-rights-act
DeLeon, Richard E. Left Coast City: Progressive Politics in San Francisco, 1975-1991. Lawrence: University Press of Kansas, 1992.
67
DeLeon, Richard E., Steven Hill, and Lisel Blash. “The Campaign for Proposition H and Preference Voting in San Francisco, 1996.” Representation 35, no. 4 (1998): 265-274.
Delventhal, Burk E., and Paul Zarefsky. Mayoral Appointments to and Seats on Boards, Commissions, and Other Bodies; and Related Matters. San Francisco: Office of the City Attorney, July 11, 2018. https://www.sfcityattorney.org/wp-content/uploads/2018/07/Mayoral-AppoinmentsMemo-2018.pdf
Detwiler, Peter. “Creatures of Statute... Children of Trade: The Legal Origins of California Cities,” in California Constitution Revision Commission: History and Perspective. Sacramento: California Constitution Revision Commission, 1996, 97-104. https://digitalcommons.law.ggu.edu/cgi/ viewcontent.cgi?article=1290&context=caldocs_agencies
Dillon, Sam. “New York City’s 32 School Boards Get New Faces but Not New Views.” New York Times, May 22, 1993. https://www.nytimes. com/1993/05/22/nyregion/new-york-city-s-32-school-boards-get-new-faces-but-not-new-views.html
Dillon, Sam. “Supporters of Gay Rights Win More School Races.” New York Times, May 18, 1993. https://www.nytimes.com/1993/05/18/nyregion/ supporters-of-gay-rights-win-more-school-races.html
Dineen, J. K. “S.F. housing production slows to a crawl as state goals loom.” San Francisco Chronicle, April 3, 2023. https://www.sfchronicle.com/ bayarea/article/san-francisco-housing-production-slows-crawl-17875749.php
Donovan, Todd, Caroline Tolbert, and Kellen Gracey. “Self-reported Understanding of Ranked-Choice Voting,” Social Science Quarterly 100, no. 5 (2019): 1768-1776.
Drutman, Lee, and Maresa Strano. “What We Know About Ranked-Choice Voting.” New America, November 10, 2021. www.newamerica.org/ political-reform/reports/what-we-know-about-ranked-choice-voting/ East Bay Times. “Ranked-choice voting could racially diversify councils.” September 2, 2020.
Edelman, Paul H. “Making Votes Count in Local Elections: A Mathematical Appraisal of At-Large Representation.” Election Law Journal 4, no. 4 (December 2005): 258-278.
Ege, Mike. “Explainer: San Francisco Has 100 Boards and Commissions. Why?” San Francisco Standard, March 31, 2022. https://sfstandard.com/ politics/city-hall/explanier-san-francisco-boards-and-commissions/
Ege, Mike. “Frustrated San Francisco Voters Poised to Flip the Script This Election.” San Francisco Standard, October 31, 2022. https://sfstandard.com/ politics/frustrated-san-francisco-voters-poised-to-flip-the-script-this-election/
Ethington, Philip J. The Public City: The Political Construction of Urban Life in San Francisco, 1850-1900. New York: Cambridge University Press, 1994.
FairVote. “RCV Elections Database.” n.d., accessed May 8, 2023. https://docs.google.com/ spreadsheets/d/1lU6viuXfay323Gl6zkH5itwmrUIUo9rAzalK_ntu-ZY/edit#gid=1092371030,
FairVote. “Where is Proportional RCV Used?” n.d., accessed April 28, 2023. https://fairvote.org/our-reforms/ proportional-ranked-choice-voting-information/#where-is-proportional-rcv-used
Farrell, David M., and Ian McAllister. “Through a Glass Darkly: Understanding the World of STV.” In Shaun Bowler and Bernard Grofman, eds. Elections in Australia, Ireland, and Malta under the Single Transferable Vote: Reflections on an Embedded Institution. Ann Arbor: University of Michigan Press, 2000.
Farzan, Yursa, and Hanna Kang. “How might district-based elections change voting in Irvine?” Orange County Register, February 7, 2023. https://www. ocregister.com/2023/02/07/how-might-district-based-elections-change-voting-in-irvine/
Feiock, Richard, Antonio F. Tavares, and Mark Lubell. “Policy Instrument Choices for Growth Management and Land Use Regulation.” Policy Studies Journal 36, no. 3 (July 2008): 461-480.
Flores, Ana, Gus Guibert, and Andrew Shen. Memorandum to the Redistricting Task Force re Voting Rights Act Section 2 Analysis. San Francisco: Office of the San Francisco City Attorney, March 14, 2022, Attachment B. https://www.sfcityattorney.org/wp-content/uploads/2022/03/2022-0314-Memo-re-Voting-Rights-Act-Section-2-Analysis-rev.2_.pdf
Fracassa, Dominic. “SF examines impacts of its many budget set-asides.” SFGate, September 28, 2017. https://www.sfgate.com/bayarea/article/SFexamines-impacts-of-its-many-budget-set-asides-12239112.php
Frey, William H. “New census data shows a huge spike in movement out of big metro areas during the pandemic.” The Avenue, The Brookings Institution Metropolitan Policy Program, April 14, 2022. https://www.brookings.edu/blog/the-avenue/2022/04/14/ new-census-data-shows-a-huge-spike-in-movement-out-of-big-metro-areas-during-the-pandemic/ Gewertz, Catherine. “N.Y.C. Mayor Gains Control Over Schools,” EdWeek, June 19, 2002. www.edweek.org/ leadership/n-y-c-mayor-gains-control-over-schools/2002/06
Gordon, Tracy M. The Local Initiative in California. San Francisco: Public Policy Institute of California, 2004. Haas, Jim. “A Rudderless Ship: The History of San Francisco’s Constitution,” SPUR Newsletter, November 1995.
68
Haas, Jim. “Evaluating the New City Charter: A three-year report card.” The Urbanist, SPUR, October 1, 1999. https://www.spur.org/publications/ urbanist-article/1999-10-01/evaluating-new-city-charter
Haider-Markel, Donald. Out and Running: Gay and Lesbian Candidates, Elections, and Policy Representation. Washington, D.C.: Georgetown Press, 2010.
Hankinson, Michael, and Asya Magazinnik. “The Supply-Equity Trade-off: The Effect of Spatial Representation on the Local Housing Supply.” Journal of Politics, forthcoming. https://www.mhankinson.com/documents/supply_equity_working.pdf
Heidorn, Nicolas. California Municipal Democracy Index. Sacramento, CA: California Common Cause, 2016. https://www.commoncause.org/california/ resource/california-municipal-democracy-index/
Heidorn, Nicolas. California Local Redistricting Commissions: Landscape, Considerations, and Best Practices. Sacramento, CA: California Local Redistricting Project (2017 Updated), https://sf.gov/sites/default/files/2023-03/CA_Local_Redistricting_Commissions_-_Aug_2017.pdf
Heidorn, Nicolas. The Promise of Fair Maps: California’s 2020 Local Redistricting Cycle: Lessons Learned and Future Reforms, ACLU of Northern California et al. (January 2023), https://www.aclunc.org/sites/default/files/ThePromiseofFairMapsreport.pdf
Heilig, Peggy, and Robert J. Mundt. Your Voice at City Hall: The Politics, Procedures, and Policies of District Representation. Albany: State University of New York Press, 1984.
Hernandez, Pedro, Jennifer Pae, Madeline Brown, and Theodore Landsman. Voter Experience with Ranked Choice Voting in San Francisco: Voter Turnout and Use of Rankings, 2004-2016. FairVote, May 2018. https://fairvote.app.box.com/v/SanFranciscoReport
Herrera, Dennis J. List of City Boards, Commissions, and Advisory Bodies Created by Charter, Ordinance, or Statute. San Francisco: Office of the City Attorney, City and County of San Francisco, August 25, 2017.
“Housing Burden: San Francisco County, CA vs. California.” Bay Area Equity Atlas. n.d., accessed April 12, 2023. https://bayareaequityatlas.org/ indicators/housing-burden#/?geo=04000000000006075&houseburd01=2
International City/County Management Association. 2018 Municipal Form of Government Survey: Summary of Results, Washington, DC: ICMA, July 2019. https://icma.org/sites/default/files/2018%20Municipal%20Form%20of%20Government%20Survey%20Report.pdf
Issel, William and Robert W. Cherny, San Francisco 1865-1932: Politics, Power, and Urban Development. Berkeley: University of California Press, 1986. Issel, Willam and Robert W. Cherny, “San Francisco City Charters, 1916-1932,” FoundSF. n.d., accessed April 12, 2023. https://www.foundsf.org/index. php?title=San_Francisco_City_Charters_1916-1932
John, Sarah, and Brandon Leinz. Polarization and Multi-Winner Ranked Choice Voting in Cambridge, Massachusetts, City Council Elections. FairVote, April 2016. https://fairvote.app.box.com/v/CambridgePolarization
Johnson v. Bradley, 4 Cal.4th 389, 398 (1992).
Jung, Yoohyun, and Mallory Moench. “How many people are homeless in San Francisco? Here’s what the data shows.” San Francisco Chronicle, May 16, 2022. https://www.sfchronicle.com/sf/article/How-many-people-are-homeless-in-San-Francisco-17155544.php
Knight, Heather. “‘It’s insane’: Only-in-S.F tactic.” San Francisco Chronicle, February 23, 2023. https://www.sfchronicle.com/sf/bayarea/heatherknight/ article/matt-haney-housing-appeals-17799039.php
Koop, Royce, and John Kraemer. 2016. “Wards, At-Large Systems and the Focus of Representation in Canadian Cities.” Canadian Journal of Political Science 49, no. 3 (September 2016): 433-448.
Laverty, Sabrina. “Proportional RCV is Coming to Two More California Cities,” FairVote, July 19, 2022, https://fairvote.org/ proportional-rcv-is-coming-to-two-more-california-cities/
Lazarus, Jim. “A Comparison of Critical Provisions: Charter Reform: Proposition E,” SPUR Newsletter, November 1995: 2.
Lee, Eugene C., and Jonathan Rothman. “San Francisco’s District System Alters Electoral Politics,” National Civic Review 67, no. 4 (April 1978): 173-78.
Levinson, Jessica A., and Robert M. Stern. “Ballot Box Budgeting in California: The Bane of the Golden State or an Overstated Problem?” Hastings Constitutional Law Quarterly 37, no. 4 (Summer 2010): 689-744.
Li, Roland. “Downtown S.F. still has North America’s weakest pandemic recovery.” San Francisco Chronicle, January 20, 2023. https://www.sfchronicle. com/sf/article/downtown-s-f-still-has-north-america-s-weakest-17726176.php
Lindgren, Eric A. “Comparing San Francisco’s At-Large and District Supervisor Elections’ Average Spending and Participation Rates.” California Politics & Policy 11 (June 2007).
Lindqwister, Liz. “Beyond the Rainbow: A Closer Look at San Francisco’s LGBTQ+ Voters.” San Francisco Standard, October 27, 2022. https://sfstandard.com/research-data/san-francisco-LGBTQ+-queer-gay-transgender-lesbian-voter-profile/
Lindsey, Robert. “Buildings Curbed by San Francisco,” New York Times, July 3, 1985, https://www.nytimes.com/1985/07/03/us/buildings-curbed-bysan-francisco.html
69
Long, Percy V. “Consolidated City and County Government of San Francisco,” American Political Science Review 6, no. 1 Supplement: Proceedings of the American Political Science Association at Its Eighth Annual Meeting (February 1912): 109-121.
Lubell, Mark, Richard C. Feiock, and Edgar E. Ramírez De La Cruz, “Local Institutions and the Politics of Urban Growth.” American Journal of Political Science 53, no. 3 (July 2009): 649–665.
MacDonald, Lynn. “The Impact of Government Structure on Local Public Expenditures.” Public Choice 136, no. 3/4 (September 2008): 457-73.
MacManus, Susan A. “Mixed Election Systems: The Newest Reform Structure,” in Local Government Election Practices: A Handbook for Public Officials and Citizens, edited by Roger L. Kemp. Jefferson, NC: McFarland, 1999.
Malinowski, Jason. “Campaign Spending in City Council Elections: A Comparison of At-Large and District Contests.” University of Washington Bothell Master of Arts capstone project, 2013.
Marschall, Melissa, and Anna Mikulska. The Process of Minority Incorporation in Local Politics and Government. Rice University Kinder Institute for Urban Research, 2013. https://doi.org/10.25611/ugtk-ocic
Mast, Evan. “Warding Off Development: Local Control, Housing Supply, and NIMBYs.” Review of Economics and Statistics (May 2022): 1-29. https://doi. org/10.1162/rest_a_01192
McAllister, Ian, and Donley T. Studlar. “Electoral Systems and Women’s Representation: A Long‐Term Perspective.” Representation 39, no. 1 (March 2002): 3-14.
McDaniel, Jason. “Does More Choice Lead to Reduced Racially Polarized Voting? Assessing the Impact of Ranked-Choice Voting in Mayoral Elections.” California Journal of Politics and Policy 10, no. 2 (2018): 1-24.
Minneapolis City Council Standing Committee on Elections & Rules, The 2017 Municipal Election: An Analysis & Recommendations, May 9, 2018, https:// lim5.minneapolismn.gov/Download/RCA/4684/2017%20Municipal%20Election%20Report.pdf.
Morris, J. D. “Here’s how bad the job performance rating is for S.F. Supervisors.” San Francisco Chronicle, September 13, 2022. https://www.sfchronicle. com/sf/article/sfnext-poll-sf-supervisors-17430978.php
Moench, Mallory. “These people have the power to fix S.F.’s biggest problems. Here is what’s holding them back.” San Francisco Chronicle, March 26, 2023, updated March 31, 2023. https://www.sfchronicle.com/sf/article/mayor-breed-crime-housing-homelessness-17852811.php
Moses, Bernard. The Establishment of Municipal Government in San Francisco. Baltimore: John Hopkins University Press, 1889. https://archive.org/ details/establishmentofm00moserich/mode/2up
Mutnick, Ally. “LGBTQ+ advocates target a new way to grow political power: Redistricting.” Politico, August 11, 2021. https://www.politico.com/ news/2021/08/11/LGBTQ+-grow-political-power-redistricting-503549
Nanry, William H. “San Francisco Adopts a New Charter.” National Municipal Review 20, no. 5 (May 1931): 259-263.
Neely, Francis, Lisel Blash, and Corey Cook. An Assessment of Ranked-Choice Voting in the San Francisco 2004 Election. San Francisco: Public Research Institute at San Francisco State University, May 2005.
Neely, Francis, Corey Cook, and Lisel Blash. An Assessment of Ranked-Choice Voting in the San Francisco 2005 Election. San Francisco: Public Research Institute at San Francisco State University, July 2006.
Neely, Francis, and Corey Cook. “Whose Votes Count? Undervotes, Overvotes, and Ranking in San Francisco’s Instant-Runoff Elections.” American Politics Research 36, no. 4 (July 2008): 530-554.
Neely, Francis, and Jason McDaniel. “Overvoting and the Equality of Voice under Instant-Runoff Voting in San Francisco.” California Journal of Politics and Policy 7, no. 4 (2015).
Oliver, Eric, Shang E. Ha and Zachary Callen. Local Elections and the Politics of Small-Scale Democracy. Princeton, NJ: Princeton University Press, 2012.
Otis, Deb. Spotlight: Proportional RCV in Cambridge, Massachusetts. FairVote, October 5, 2022. fairvote.org/spotlight_cambridge/.
Parvini, Sarah, and Eliis Simani. “Are Arabs and Iranians white? Census says yes, but many disagree.” Los Angeles Times, March 28, 2019. https://www. latimes.com/projects/la-me-census-middle-east-north-africa-race/ Pico Neighborhood Association v. Santa Monica, 51 Cal.App.5th 1002 (2020).
Polinard, J. L., Robert D. Wrinkle, Tomas Longoria, and Norman E. Binder, Electoral Structure and Urban Policy: The Impact on Mexican American Communities. Armonk, N.Y.: M.E. Sharpe, 1994.
Ramírez de la Cruz, Edgar E. “Local Political Institutions and Smart Growth: An Empirical Study of the Politics of Compact Development.” Urban Affairs Review 45, no. 2 (2009): 218-246.
Redmond, Paul, and John Regan. “Incumbency Advantage in a Proportional Electoral System: A Regression Discontinuity Analysis of Irish Elections.” European Journal of Political Economy 38 (June 2015): 244-256.
70
Renner, Tari. “Election Processes and Minority Representation,” in Local Government Election Practices: A Handbook for Public Officials and Citizens, edited by Roger L. Kemp. Jefferson, NC: McFarland, 1999: 139-62.
Rezal, Adriana, and Erin Caughey. “SFNext Index: Key facts about housing in San Francisco.” San Francisco Chronicle, June 29, 2022. https://www. sfchronicle.com/bayarea/article/san-francisco-housing-production-slows-crawl-17875749.php
Rezal, Adriana, and Erin Caughey. “SFNext Index: Key facts about crime in San Francisco.” San Francisco Chronicle, November 5, 2022. https://www. sfchronicle.com/projects/2022/fixing-san-francisco-problems/crime
Rodriguez, Joe Fitzgerald. “For the First Time in 2 Decades, This Majority-Asian SF District Will Not Have an Asian Supervisor.” KQED, November 19, 2022. https://www.kqed.org/news/11932780/for-the-first-time-in-2-decades-this-majority-asian-sf-district-will-not-have-an-asiansupervisor
Rosenblum, Darren. “Geographically Sexual?: Advancing Lesbian and Gay Interests Through Proportional Representation.” Harvard Civil Rights-Civil Liberties Law Review 31, no. 1 (Winter 1996): 119-154.
San Francisco Chamber of Commerce. 2022 Dignity Health CityBeat Poll Results. San Francisco: San Francisco Chamber of Commerce, 2022. https:// sfchamber.com/2022-dignity-health-citybeat-poll-results/
San Francisco Department of Elections. “Past Election Results.” n.d., accessed May 8, 2023, https://sfelections.sfgov.org/past-election-results
San Francisco Department of Elections. “Current Registration Counts.” last updated May 10, 2023, https://www.sfelections.org/tools/election_data/
San Francisco Department of Homelessness and Supportive Housing. San Francisco Homeless Count and Survey: 2022 Comprehensive Report, updated August 19, 2022. https://hsh.sfgov.org/wp-content/uploads/2022/08/2022-PIT-Count-Report-San-Francisco-Updated-8.19.22.pdf.
San Francisco Elections Task Force. “A Report of the Elections Task Force to the Board of Supervisors.” City and County of San Francisco, May 1, 1995. https://archive.org/details/reportofelection1199sanf/mode/2up
San Francisco Examiner “Feared Too Much Reform.” March 26, 1898, 5.
“San Francisco Voter Information Pamphlets and Ballots.” (Materials from 1907-2022). San Francisco Public Library. https://sfpl.org/locations/ main-library/government-information-center/san-francisco-government/san-francisco-1/san
Santucci, Jack. “Factional Voting in Local Elections: The Case of Cambridge, MA.” Urban Affairs Forum February 7, 2019, archived at: https://web.archive.org/web/20230201063158/https://www.urbanaffairsreview.com/2019/02/07/ factional-voting-in-local-elections-the-case-of-cambridge-ma/
Santucci, Jack. More Parties or No Parties. New York: Oxford University Press, 2022.
Segura, Gary. “Institutions Matter: Local Electoral Laws, Gay and Lesbian Representation, and Coalition Building Across Minority Communities,” in Gays and Lesbians in the Democratic Process: Public Policy, Public Opinion, and Political Representation, edited by Ellen D. B. Riggle and Barry L. Tadlock. New York: Columbia University Press, 1999, 220-241.
Smith, Adrienne, R., Beth Reingold, and Michael Leo Owens. “The Political Determinants of Women’s Descriptive Representation in Cities.” Political Research Quarterly 65, no. 2 (June 2012): 315-329.
Smith, Jim. “Woodland’s district elections are helping minorities.” Daily Democrat (Woodland, CA), November 2, 2020. https://www.dailydemocrat. com/2020/11/02/district-elections-are-helping-minorities/
Sonenshein, Raphael. When the People Draw the Lines: An Examination of the California Citizens Redistricting Commission. Sacramento, CA: League of Women Voters of California, 2012. https://cavotes.org/sites/default/files/jobs/RedistrictingCommission%20Report6122013.pdf
Stephanopoulos, Nicholas O. 2013. “Our Electoral Exceptionalism.” University of Chicago Law Review 80, no. 2 (2013): 769-858.
Stucky, Thomas. D. “Local Politics and Violent Crime in U.S. Cities.” Criminology 41, no. 4 (November 2003): 1101-1136.
Stucky, Thomas D. “Local Politics and Police Strength.” Justice Quarterly 22, no. 2 (June 2005): 139-169.
Suzuki, Tami J. “Finding Aid to the San Francisco Citizens Charter Revision Committee Records 1889-1973 (bulk 1968-1971), SFH 33.” San Francisco History Center, San Francisco Public Library, https://oac.cdlib.org/findaid/ark:/13030/c81n836b/entire_text/
Suzuki, Tami J. “Finding Aid to the San Francisco Select Committee on Charter Reform Records, 1978-1996 (bulk 1994-1995).” San Francisco History Center, San Francisco Public Library. http://pdf.oac.cdlib.org/pdf/csf/sfpl/selectcommittee.pdf
Tausanovitch, Chris, and Christopher Warshaw. “Representation in Municipal Government.” American Political Science Review 108, no. 3 (August 2014): 605-641.
Thadani, Trisha. “S.F. could kill plan for tiny homes for homeless due to ‘overwhelming’ backlash, ‘absurd’ costs.” San Francisco Chronicle February 15, 2023. https://www.sfchronicle.com/sf/article/homeless-sf-tiny-cabins-mission-district-costs-17775286.php
Thornburg v. Gingles, 478 U.S. 30 (1986).
71
Trounstine, Jessica. “Turnout and Incumbency in Local Elections.” Urban Affairs Review 49, no. 2 (2013): 167-189.
Trounstine, Jessica, and Melody Valdini. “The Context Matters: The Effects of Single-Member versus At-Large Districts on City Council Diversity.” American Journal of Political Science 52, no. 3 (July 2008): 554-569.
Truong, Kevin. “Downtown San Francisco Vacancies Hit Record High as City Nears Breaking Point.” San Francisco Standard, April 5, 2023. https://sfstandard.com/business/downtown-san-francisco-vacancies-hit-record-high-as-city-nears-breaking-point/?utm_source=email_sitebutton United Kingdom Electoral Commission. Report on the May 2022 Scottish Council Elections. London: Electoral Commission, Sepember 21, 2022. https://www.electoralcommission.org.uk/who-we-are-and-what-we-do/elections-and-referendums/past-elections-and-referendums/ scotland-local-council-elections/report-may-2022-scottish-council-elections
U.S. Census Bureau, “Census Quickfacts: San Francisco County, California; New York city, New York; Boston city, Massachusetts; San José city, California; Los Angeles city, California.” Accessed April 12, 2023. https://www.census.gov/quickfacts/.
U.S. Census Bureau. “American Community Survey Population Estimate San Francisco, CA.” Accessed April 16, 2023. https://data.census.gov/ table?q=san+francisco+population&tid=ACSDP1Y2021.DP05
Vankin, Jonathan. “District vs. At-Large Races: The Final Frontier of Voting Rights.” California Local, June 7, 2021. https://californialocal.com/localnews/ statewide/ca/article/show/396-district-vs-at-large-elections-explained/ van Windergen, Pieter. “The Transformation of California’s City Council Election Systems.” Claremont, CA: Rose Institute of State and Local Government, forthcoming. https://roseinstitute.org/.
Vowles, Jack, and Janine Hayward. “Ballot Structure, District Magnitude, and Descriptive Representation: The Case of New Zealand Local Council Elections.” Australian Journal of Political Science 56, no. 1 (June 2021): 1-20.
Walawender, Richard A. “At-Large Elections and Vote Dilution: An Empirical Study.” Michigan Journal of Law Reform 19, no. 4 (Summer 1986): 1221-1242.
Welch, Susan. “The Impact of At-Large Elections on the Representation of Blacks and Hispanics.” Journal of Politics 52, no. 4 (November 1990): 1050-1076.
Welch, Susan, and Timothy Bledsoe. Urban Reform and its Consequences. Chicago: University of Chicago Press, 1988.
Wirt, Frederick. Power in the City. Berkeley: University of California Press, 1974.
Wisconsin Legislature v. Wisconsin Elections Commission, 142 S. Ct. 1245 (2022).
Yumori-Kaku v. City of Santa Clara, 59 Cal. App. 5th 385 (2020).
Zhao, Jihong, Ling Ren, and Nicholas Lovrich. “Local Political Structures and Violent Crime in U.S. Cities: Patterns of Association in Longitudinal Panel Study.” Criminal Justice Policy Review 22, no. 4 (2011): 448-470.
Zhao, Jihong, Ling Ren, and Nicholas Lovrich. “Political Culture versus Socioeconomic Approaches to Predicting Police Strength in U.S. Police Agencies: Results of a Longitudinal Study, 1993-2003.” Crime & Delinquency 58, no. 2 (2012): 167-195.
Zillow Home Values Index. “San Francisco Home Values.” n.d., accessed April 16, 2023. https://www.zillow.com/home-values/20330/san-francisco-ca/
72

73
ABOUT THE AUTHORS

Nicolas Heidorn was, at the time of the drafting of this report, a research affiliate of the Rose Institute of State and Local Government and the owner Heidorn Consulting, a public policy consulting firm specializing in elections and governance policy, with a focus on municipal government. He previously served as the Staff Director and Chief Consultant of the California State Senate Elections and Constitutional Amendments C ommittee and, before that, as the Policy and Legal Director of California Common Cause. Heidorn is also a former Adjunct Law Professor at McGeorge School of Law, where he founded and directed the California Local Redistricting Project to research and promote local redistricting best practices. Among other publications, Heidorn is the author of the “California Municipal Democracy Index 2016,” an exhaustive study of the democratic practices of California’s 482 cities, published by California Common Cause. Heidorn received a B.A. in government and literature from Claremont McKenna College and a J.D. from Harvard Law School.
Kenneth P. Miller is the Don H. and Edessa Rose Professor of State and Local Government at Claremont McKenna College, where he serves as Director of the Rose Institute of State and Local Government. Miller’s scholarship focuses on state and local politics, constitutional law, and political polarization. His publications include Texas vs. California: A History of Their Struggle for the Future of America (Oxford 2020), Direct Democracy and the Courts (Cambridge 2009), as well as numerous articles and book chapters on topics including the initiative process, political geography, state constitutionalism, state supreme courts, and voting rights. Miller received a B.A. in government from Pomona College, a J.D. from Harvard Law School, and a Ph.D. in political science from the University of California at Berkeley. Prior to pursuing a career in academia, he worked as an attorney with Morrison & Foerster in Los Angeles and Sacramento, specializing in litigation, administrative law, and political law.
Bipasa Nadon has been the Assistant Director for Research and Publications at the Rose Institute of State and Local Government since 2011. She directs a number of student research projects, with a special focus on California’s Inland Empire, and oversees much of the institute’s consulting work. In her previous life, Nadon practiced corporate law at Hale and Dorr, LLP in Boston, specializing in technology licensing. Prior to that, she was an assistant to Mayor Richard M. Daley in Chicago, where she developed policy in the areas of housing, aviation planning, personnel, and legislative affairs. Nadon also has international experience. She was the director of local government programs for the National Democratic Institute for International Affairs in Ukraine and served as an international observer for Ukraine’s first parliamentary elections. Early in her career, Nadon was an assistant survey director at the National Opinion Research Center at the University of Chicago. Nadon received a B.A. in mathematics and a J.D. from the University of Chicago.
74
ABOUT TOGETHERSF
TogetherSF is a 501c3 nonprofit organization with a mission to increase civic engagement and education in San Francisco. TogetherSF is the largest, most diverse and most engaged network of residents in the history of San Francisco. It is dedicated to making San Francisco into a city that works for everyone—a city of action and compassion that addresses its citizens’ most urgent needs and invests in our collective future.
ABOUT THE ROSE INSTITUTE
The Rose Institute of State and Local Government is a leading source of objective, non-partisan information on California state and local governments. Founded at Claremont McKenna College in 1973, the Institute’s mission is to enhance the education of students at CMC, produce high quality research, and promote public understanding on issues of state and local government, politics, and policy, with an emphasis on California.

ACKNOWLEDGEMENTS
The authors thank Marionette Moore, Sarah Simionas, Anna Dondul Yuthok Short, Grace Hong, Cameron Stevens, Tara Mehra, and Jessica Jin for their contributions to this report.

75
