


In this issue of the Inland Empire Outlook, we survey three key components of the Inland Empire’s logistics industry: ports, airports, and warehouses. We begin with an examination of the Port of Los Angeles and the Port of Long Beach as key components of the logistics sector in Southern California. The two are situated next to one another in San Pedro Bay and are a hub for trade between the United States and the rest of the world.
Next, we look at Ontario International Airport as an important conduit for freight in and out of the region. Ontario is the ninth leading cargo airport in the United States and third in the West, trailing only Anchorage and Los Angeles International. Cargo volume soared in 2020, driven by changes in consumer patterns during the pandemic, but has now returned to pre-pandemic levels.
Continuing on the topic of the logistics industry in the Inland Empire, our third article examines the growth of warehousing and growing opposition to its continued expansion. Roughly 40% of the nation’s goods traveled
through the Inland Empire at some point during their journey from manufacture (domestic or foreign) to their final destination. The boom in warehouses over the past decade has caught the attention of various environmental and labor advocacy groups, but it remains to be seen if they will be able to slow warehouse growth.
California’s primary election is on Tuesday, March 5, 2024. Our fourth article outlines the Inland Empire races for California Assembly, the California Senate, and Congress. Finally, we provide an overview Proposition 1, the only statewide measure on the March ballot. Prop 1 would authorize a $6.4 billion bond to build housing and treatment centers for people with mental health and substance abuse problems and would also require counties to change the way they spend existing mental health funds.
We hope you find this edition of Inland Empire Outlook a useful guide. Please visit our website, www.RoseInstitute. org, for information on more Rose Institute research.
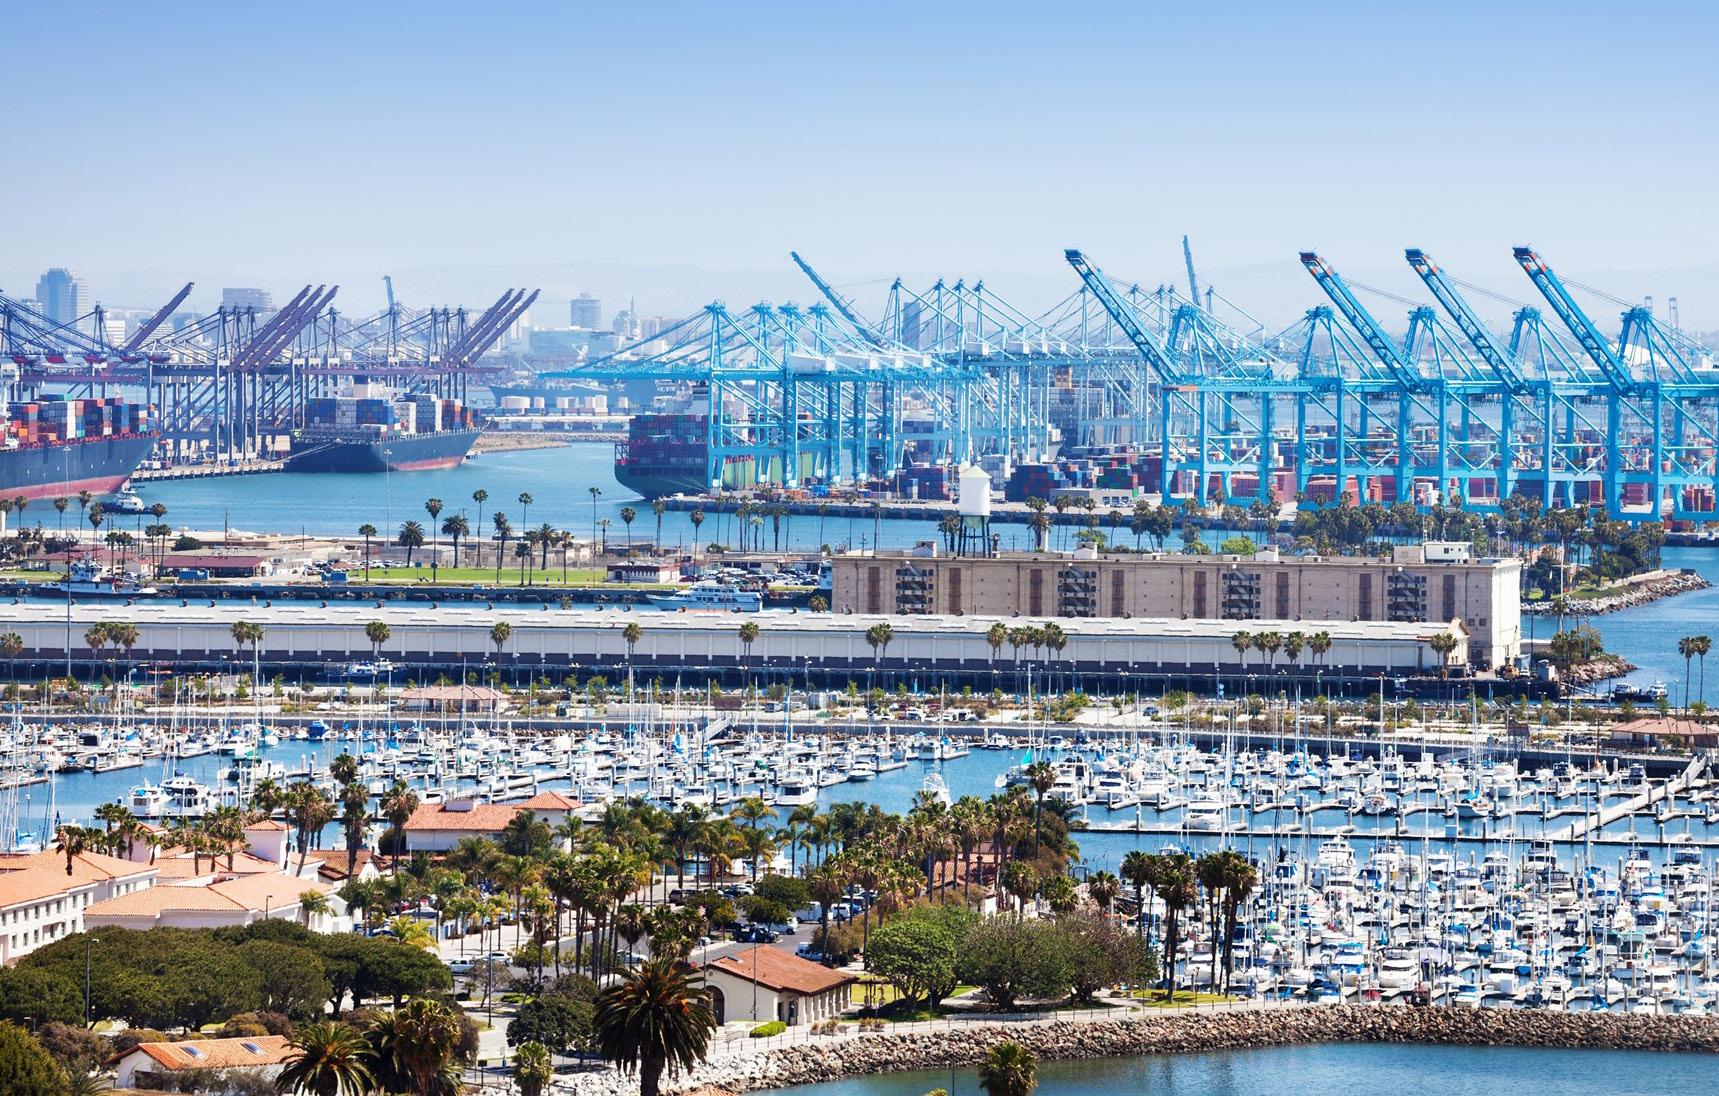
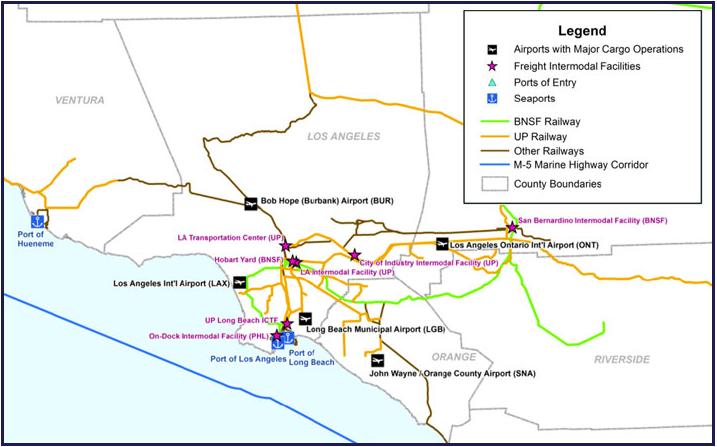
The Los Angeles region is a central hub for trade between the United States and the rest of the world, with goods, both imports and exports, flowing through Southern California airports and ports. According to the Federal Aviation Administration, Los Angeles International Airport (LAX) was the fourth busiest in the nation for freight volume in 2021, handling a tonnage of 14.8 million pounds. Ontario International Airport is also among the top ten cargo airports in the country, handling 5.3 million pounds of freight in 2021.
The Port of Los Angeles and the Port of Long Beach are the other major facilities for the flow of freight in the region. The two ports are next-door neighbors and together comprise the San Pedro Bay port complex. It handles more containers per ship call than any other port complex in the world and ranks number nine for overall freight volume. The Port of Los Angeles itself ranks number 17 and is the busiest seaport in the Western Hemisphere. Its top trading partner is China/Hong Kong with $134 billion in trade for
2022. Japan is a distant second with $38 billion. The Port of Long Beach is the 21st busiest container cargo port in the world. Trade with East Asia accounts for more than 90% of the shipments through the Port of Long Beach. Its top trading partners are China, Vietnam, Thailand, South Korea, and Taiwan.
The Inland Empire is the heart of the logistics industry in Southern California. On arrival at one of the region’s seaports or airports, goods are transported to the thousands of warehouses in the Inland Empire, where they are stored and sent off to the rest of the United States. This article examines the ports as key components of the logistics sector in Southern California.
The Port of Los Angeles and the greater San Pedro Bay area were first officially documented in 1542 by Portuguese explorer Juan Rodriguez Cabrillo. Commercial ventures only began much later in the 1800s. The bay was used by Spanish missionaries to trade with and receive goods from
Spain. Over time, international trade grew and thrived. Congress declared San Pedro Bay “the official port for Los Angeles” in 1897. The Board of Harbor Commissioners was formed in 1907, marking the official founding of the Port of Los Angeles.
As the Port of Los Angeles expanded, it benefited immensely from its location. When the Panama Canal opened in 1914, the Port of Los Angeles had an advantage over other West Coast ports as it was the furthest south. (The Port of San Diego was not established until 1962.) The Port continues to be an important connection for trade with Asia. The Los Angeles Times reports that the Los Angeles and Long Beach ports “combine to handle nearly 40% of U.S. imports from Asia.”
The Port of Los Angeles reports that it has been the busiest container port in the Western Hemisphere since 2000. In 2021, following the pandemic, an all-time high of 10.7 million TEUs (twenty-foot equivalent unit containers) were processed, partially fueled by the explosion of demand for goods from the pandemic. The Port of Los Angeles estimates that the economic activity it generates affects one in nine jobs in Southern California (in Los Angeles, Orange, Riverside, San Bernardino and Ventura counties).
The Port of Long Beach is the other part of the San Pedro Bay port complex. It has been open since 1911 and is managed by the City of Long Beach Harbor Department. It is the top export seaport in the United States. The Port
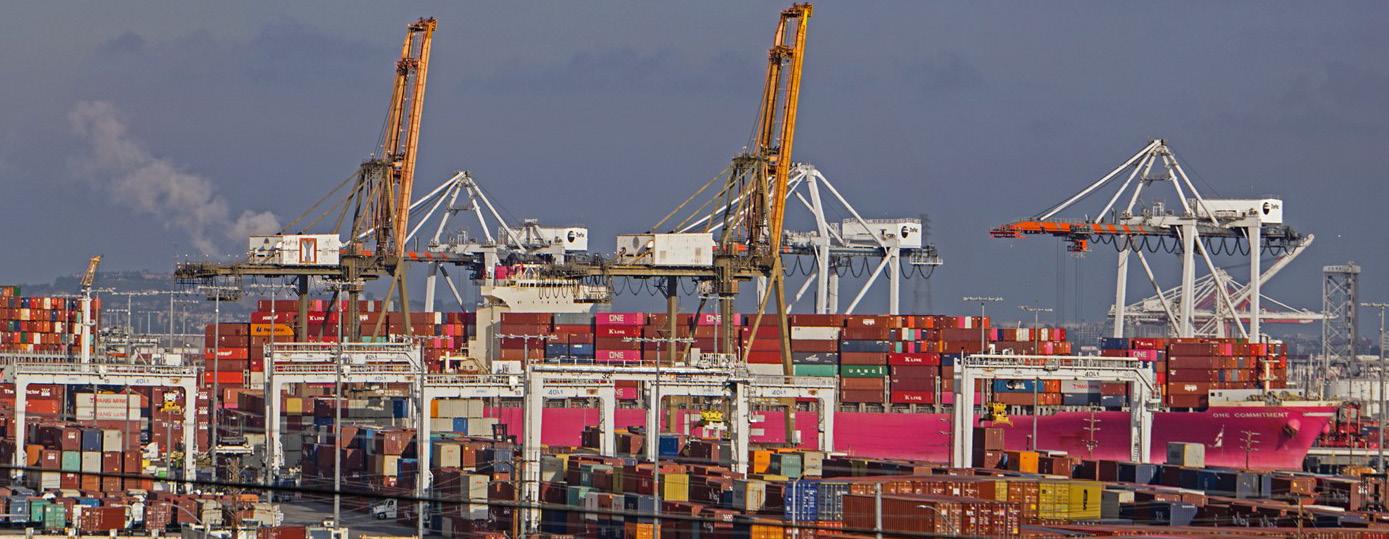
of Long Beach and Port of Los Angeles compete with one another for business but also work together to coordinate things like security.
The Port of Long Beach handled 8 million TEUs of cargo in 2023, down 12% from 9.1 million TEUs in 2022. The Port of Long Beach estimates that port-related business supports one in 20 jobs in Southern California. Top imports include crude oil, electronics, plastics, furniture, and clothing. Top exports include petroleum coke, petroleum bulk, chemicals, waste paper, and foods.
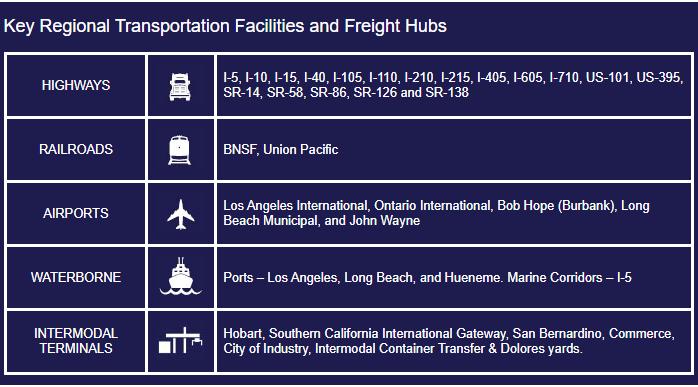
Once goods are received, whether through the ports or airports, they must embark on the second leg of their journey. Land transportation, primarily by truck and rail, moves containers and other packages to nearby warehouses and distribution centers.
The Port of Los Angeles reports that, on any given day, the majority of containers have been at the port for 0-4 days. In mid-February 2024, 83% of containers had a “dwell time” of 0-4 days, 11.3% of 5-8 days, and 5.7% of 9+ days. These numbers vary from day to day.
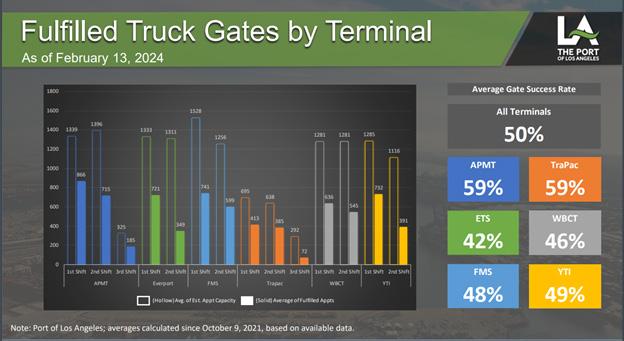
Marine Terminal Operators (MTOs) are businesses that contract with ocean carriers to process containers when they arrive at the port. Once the MTOs are finished, drayage companies– truckers that specialize in shortdistance moves of full sea containers to intermediary warehouses– then move goods off-port. The Port of Los Angeles reports that they fulfill on average 7,349 truck
Top 5 Imports (in TEUs)
Furniture - 684,000
Source: Port of Los Angeles, https://www.portoflosangeles.org/business/ statistics/container-statistics, Port of Long Beach, https://polb.com/business/portstatistics/#yearly-teus
Top 5 Exports (in TEUs)
Pet/Animal Feed - 181,000
Auto Parts - 360,000 Paper/Waste Paper - 147,000
Apparel - 269,000 Soybeans - 104,000
Plastics - 268,000 Fabrics/Raw Cotton - 83,000
Footwear - 263,000 Recycled Metal - 62,000
Source: America’s Port, The Nation’s #1 Container Port and the Global Model for Security, Sustainability, and Social Responsibility, https://kentico.portoflosangeles.org/ getmedia/16a9576f-7966-44f0-82c3-a5ebfaa8a7a4/port-101-digital-brochure
Source:
appointments per day. These appointments allow trucks to come in at staggered, predetermined times, improving the flow of traffic. However, appointments are not always fully booked. Presently, the Port of Los Angeles generally fills only 50% of truck appointments per day across all terminals. The chart below shows a breakdown of available truck appointments versus fulfillments across six terminals and across different shift times on February 13, 2024. On average, these appointment slots were half filled, with the busiest time being the first shift of the day. The Southern California Association of Governments projects that total truck miles traveled in the region will grow by over 80% by 2035, increasing from 6.8% of all vehicle miles traveled in 2008 to 10% by 2035.
Although it might seem cheaper to locate warehouse facilities close to the ports to reduce transportation costs, many businesses choose to locate their warehouses in the Inland Empire, some 60 miles inland, to benefit from cheaper real estat e and labor costs.
Rail is another option. Some shipping lines have on-port rail access, making it convenient and economical. Rail is considered the cheapest mode of transportation per pound. About 35% of intermodal containers are transported away from the port by rail, using more than 65 miles of on-dock track. The Port of Los Angeles estimates that the average train eliminates approximately 400 truck trips. The nearby Intermodal Transfer Container Facility, as well as the UP East Los Angeles Yard and the BNSF Hobart/Commerce Yard, handle the further processing of intermodal cargo, particularly cross-country rail shipments.
Similarly, when goods arrive at the Ontario International Airport, sorting, staging, and support facilities on the airfield help improve the efficiency of distribution to warehouses in the Inland Empire and beyond. Trucks are the primary method of transportation from the airport and to those warehouses. Local packages are separated for delivery, while remaining cargo is containerized for shipment to warehouses and intermodal facilities. Intermodal facilities are distribution centers that process cargo at an intermediate stage for transportation toward a final destination via truck or rail.
The Inland Empire is home to an estimated 4,000 warehouses. Many of these were built to meet the demands of e-commerce. Although the spike in online shopping during the pandemic accelerated plans for more warehousing, many local communities have pushed back.
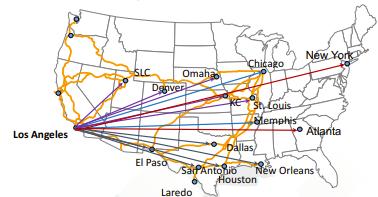
As described above, when cargo arrives in the ports or airports, logistics managers decide where to move the shipments for further processing and distribution. Because the Inland Empire provides these services at lower cost than the closer-in Los Angeles and Orange counties, warehouses in the Inland Empire are often used for shipments to other areas of the U.S. or for goods that will be stored longer-term.
The top five cities with the most land dedicated to warehouses in Southern California are Ontario, Fontana, Los Angeles, Industry, and Rialto. Indeed, eight of the top ten cities are in the Inland Empire. Notably, the largest Amazon warehouse in the world is currently under construction in Ontario, where it will span 4.1 million square feet. The number of warehouses in the Inland Empire region increased from 234 in 1980 to more than 4,000 today. CalMatters reports that roughly 1 billion square feet of the Inland Empire is devoted to warehouses.
For some packages, an Inland Empire warehouse is the final destination before delivery to the customer. For example, Amazon’s fulfillment centers store, sort, and route goods via couriers to local destinations. Other goods, whose final destination is elsewhere in California or the United States, go first to intermodal facilities, where they are sorted and reloaded onto trucks or rail for another leg of their journey.
As the volume of goods rose from e-commerce and demand for medical supplies during the pandemic, the supply chain and logistics network were pushed to their limits. Physical infrastructure at the ports limits how many ships can dock and unload. Before the pandemic, ships could arrive and offload goods with no additional wait times. In October 2021, CBS News reported there were 62 container ships anchored in San Pedro Bay, 37 waiting to unload at the Port of LA and 25 destined for Long Beach. In addition to the container ships there were barges, tankers, and car carriers also waiting, bringing the total number of ships anchored in the San Pedro Bay to 100. The average wait time for those ships was ten days.
The congestion was resolved by 2022, partially due to the workarounds that retailers and manufacturers developed to reduce the traffic through Southern California. Some shippers also began to switch to other ports due to fears over union negotiations between the West Coast seaports and their employees. As pandemic restrictions were lifted and consumer purchasing reverted to pre-pandemic patterns, there was a decline in the overall volume of freight and operations at the ports returned to normal. Yet, this episode was a warning sign of how stretched the logistical physical infrastructure is in Southern California.♦
“2023 Port of Los Angeles Tonnage Statistics | Tonnage Statistics | Port of Los Angeles.” Accessed February 21, 2024. https://www.portoflosangeles.org/business/statistics/tonnage-statistics/historical-tonnage-statistics-2023
“America’s Port.” The Port of Los Angeles, n.d. https://kentico.portoflosangeles.org/getmedia/16a9576f-7966-44f0-82c3a5ebfaa8a7a4/port-101-digital-brochure
“Container Statistics | Port of Los Angeles.” Accessed February 21, 2024. https://www.portoflosangeles.org/business/ statistics/container-statistics
“Employment by Industry Data.” Accessed February 21, 2024. https://labormarketinfo.edd.ca.gov/data/employment-byindustry.html
“Facts and Figures | Statistics | Port of Los Angeles.” Accessed February 21, 2024. https://www.portoflosangeles.org/ business/statistics/facts-and-figures
“Fulfilled Truck Gates by Terminal.” The Port of Los Angeles, February 21, 2024. https://kentico.portoflosangeles.org/ getmedia/e7e35d31-c560-49fe-be52-f335412879e8/appointment-report
Harris, Charlie. “Amazon in the Inland Empire.” Inland Empire Outlook, April 3, 2018. https://www.roseinstitute.org/wpcontent/uploads/2018/04/Spring2018_Amazon-in-the-IE.pdf
“History | About | Port of Los Angeles.” Accessed February 21, 2024. https://www.portoflosangeles.org/about/history
“History | Port of San Diego.” Accessed February 21, 2024. https://www.portofsandiego.org/about-port-san-diego/history
“Import Containers by Dwell Time.” Port of Los Angeles, February 21, 2024. https://kentico.portoflosangeles.org/ getmedia/6187bcbe-b2ce-41bb-a28e-f5d99372f49e/import-container-dwell-report
“Inland Empire Outlook, Economic and Political Analysis.” Inland Empire Outlook, 2010. https://s10294.pcdn.co/wp-content/ uploads/2015/02/Issue-1-Vol-1_Winter-2009.pdf
Keil, Manfred, Robert Kleinhenz, and Rena O’Sullivan. “Logistics Industry’s Fortunes Busting after Booming in the Inland Empire.” San Bernardino Sun (blog), August 31, 2023. https://www.sbsun.com/2023/08/31/logistics-industrysfortunes-busting-after-booming-in-the-inland-empire/
“Logistics Flies High.” Inland Empire Outlook, 2016. https://roseinstitute.org/inland-empire-outlook-logistics-flies-high/
Logistics Primer for Importers to Southern California Seaports. Weber Logistics Insights, n.d.
“Los Angeles Freight Economy Roundtable | Federal Highway Administration.” Accessed February 21, 2024. https://www. fhwa.dot.gov/freighteconomy/losangeles.cfm
Los Angeles Times. “Southern California Ports Are Losing to East Coast Rivals, Threatening L.A.-Area Jobs,” December 16, 2022. https://www.latimes.com/business/story/2022-12-16/southern-california-ports-vital-jobs-and-economy-fighteast-coast-rivals.
Newton, Jim. “Opponents of Inland Empire Warehouse Boom See Glimmer of Hope in Recent Rejections.” CalMatters, September 21, 2023, sec. Commentary. http://calmatters.org/commentary/2023/09/inland-empire-warehouse-boomrejections/
“On the Move.” Southern California Association of Governments, February 21, 2024. https://scag.ca.gov/sites/main/files/fileattachments/on_the_move2016.pdf#:~:text=Containers%20enter%20Southern%20California%20primarily,%2C%20 warehouses%2C%20and%20distribution%20centers
Patel, Nandeeni. “IE Job Market Snapshot.” Inland Empire Outlook, 2018. https://s10294.pcdn.co/wp-content/ uploads/2018/10/IEO_2018-Fall_Job-Market-Snapshot.pdf
“Port of Long Beach FAQs,” n.d. https://polb.com/port-info/port-facts-faqs/#port-info-faqs
“Rail | Supply Chain | Port of Los Angeles.” Accessed February 21, 2024. https://www.portoflosangeles.org/business/supplychain/rail.
Singh, Maanvi, and Aliya Uteuova. “Revealed: How Warehouses Took over Southern California ‘like a Slow Death.’” The Guardian, December 29, 2022, sec. US news. https://www.theguardian.com/us-news/2022/dec/29/e-commercewarehouses-amazon-ups-fedex-california-pollution
“TEUS ARCHIVE: 1969 TO PRESENT BY YEAR.” CSV, February 21, 2024. Port of Long Beach. https://polb.com/business/ port-statistics/#yearly-teus.
“United Project Objectives.” UPS Ontario, n.d. https://www.ontarioca.gov/sites/default/files/Ontario-Files/Planning/Maps/ united_project_objectives.pdf
“US Continues To Wait For Items Waiting To Be Offloaded At Ports Of LA Or Long Beach - CBS Sacramento,” October 23, 2021. https://www.cbsnews.com/sacramento/news/us-long-beach-items-shipping/.

Cargo volume has played an important role in Ontario International Airport’s (ONT) success over the past decade. According to the Federal Aviation Administration (FAA), in 2021 Ontario was the ninth leading cargo airport in the United States, and third in the West, trailing only Anchorage and LAX.
The large amount of cargo passing through the airport is driven by the Inland Empire’s robust logistics industry. The region’s proximity to the Ports of Los Angeles and Long Beach and to large population centers, as well as its supply of relatively inexpensive real estate for distribution and fulfillment centers, make it a natural logistics hub. And the airport’s location close to the intersection of Interstate 10, which connects Los Angeles to Phoenix and Interstate 15, which connects San Diego to Las Vegas, make it an integral part of that industry.
Logistics has become the largest economic engine in the Inland Empire, employing an outsized number of local residents. For example, Amazon, which operates massive fulfilment centers in the area and runs many cargo flights per day through the airport, is the region’s largest private employer.
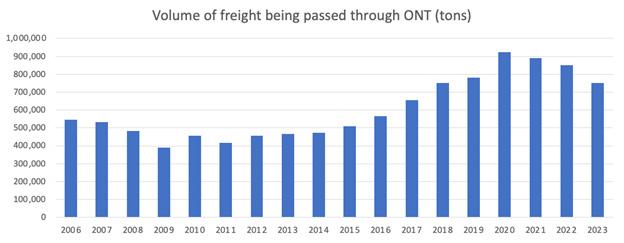
Analysts have noted, however, that across the nation the logistics industry has not continued to expand at the rate it did during COVID and the initial post-COVID phases. Writing in the San Bernardino Sun, Manfred Keil, Robert Kleinhenz, and Rena O’Sullivan note that the number of workers in the Inland Empire logistics sector stood at 265,000 as of July 2023, down 20,000 from its peak in December 2022. This drop is clearly visible at Ontario Airport, where cargo shipments declined 17% in 2023 from the year before. Between 2007 and 2015, the volume of freight at Ontario had grown slowly, hovering around half a million tons each year, before increasing a whopping 81% between 2015 and 2020, when the volume of freight passing through the airport peaked at 924,160 tons.
Ontario lost 55% of its passenger volume in 2020, dropping from 5.5 million passengers in 2019 to 2.5 million in 2020. Freight volume, in contrast, rose from 781,993 tons in 2019 to 924,160 tons in 2020. It could be argued that as passenger volume fell precipitously during the COVID-19 pandemic, the surge in freight saved the airport. Steve Lambert, a spokesman for the airport, noted that Ontario had earned a reputation as one of the nation’s stronger aircargo centers and had the infrastructure required to handle the increase in cargo volumes during the pandemic period.

Note: Includes cargo operations dedicated to the exclusive transportation of cargo, does not include aircraft carrying passengers that may also be carrying cargo. Cargo landed weight includes aircraft weight.
But as consumers have returned to in-person commerce and shifted some of their spending from buying goods back to consuming services, the volume of freight has declined year-on-year since 2020. The airport recorded 752,199 tons in 2023, comparable to 2018-19 levels.
Ontario Airport’s prowess and significance as a cargo hub is made clear by a comparison with John Wayne Airport (SNA), an Orange County airport in Santa Ana. While John
Wayne records higher passenger volume year-on-year, the amount of air cargo it handles is dwarfed in comparison to Ontario Airport. Whereas Ontario came close to cracking one million tons of cargo during its peak in 2020, John Wayne Airport in the last 10 years has failed to record more than 20,000 tons in any year. Since 2014, SNA has displayed remarkable consistency, passing between 17,000 and 20,000 tons of cargo each year.
Source: Passenger and Freight Statistics, https://www.flyontario.com/air-service/statistics
Bob Hope Airport, also known as Hollywood Burbank Airport (BUR), a third regional airport in Southern California, is more similar to Ontario Airport in passenger volume, yet it too handles freight at far lower volumes than ONT. Burbank consistently recorded between 53,00056,000 tons of cargo from 2014 to 2021, but that number dropped by 10,000 in 2022, and a further 7,000 in 2023.
Not only does Ontario handle vastly more freight volume than the two other regional airports, its growth in freight between 2014 and 2020 was 95%, compared to just 6% at John Wayne and 1% at Burbank. Since 2020, freight volume at Ontario has dropped 19%, compared to declines of 3% at John Wayne and 34% at Burbank. By 2023,
Ontario Airport was carrying more than 42 times as much freight as John Wayne Airport, and 20 times as much as Burbank Airport.
As consumer habits shift back toward in-person goods and services, and multinational corporations scale back investment in expansion and warehousing plans in response to lower demand and, possibly, heightened environmental concerns, will the period of growth for freight at Ontario Airport come to an end? Has it already?
Perhaps the biggest threat to growth in the region’s logistics sector is the rising local opposition to new warehouse construction. In recent years, three Inland Empire cities have blocked warehouse projects. In October 2022, Beaumont rejected a proposal for a warehouse complex of some 2.5 million square feet. Last year Moreno Valley rejected a proposed 1.3 million square feet warehouse complex and Fontana turned down a proposal for three warehouses covering more than 500,000 square feet.
Some environmental activists and other critics of the logistics industry see a turning of the tide. But given the importance of the logistics sector to the Inland Empire economy, it remains to be seen whether Beaumont, Moreno Valley, and Fontana are harbingers of the future -- or outliers. ♦
A version of this article was published by the Southern California News Group.
Sources: https://www.hollywoodburbankairport.com/about-us/ airport-statistics/ https://www.flyontario.com/ air-service/statistics https://www.ocair.com/about/news-info/statistics/
“Air Passenger Traffic.” Air Passenger Traffic at Los Angeles International Airport, Hollywood Burbank Airport and Long Beach Airport, California. Accessed October 17, 2023. https://www.laalmanac.com/ transport/tr57.php
“Airport Statistics.” Hollywood Burbank Airport, October 3, 2023. https://www.hollywoodburbankairport.com/about-us/ airport-statistics/.
Finn, Tyler. “Inland Empire Outlook: Logistics Flies High.” Inland Empire Outlook, Spring 2016. https://roseinstitute.org/ inland-empire-outlook-logistics-flies-high/
Federal Aviation Administration. “Leading U.S. cargo airports in 2021, based on tonnage (in million pounds).” Chart. August 31, 2022. Statista. Accessed February 22, 2024. https://www.statista.com/statistics/524737/us-cargo-airports-bylanded-weight/
Keil, Manfred, Robert Kleinhelz, and Rena O’Sullivan. “Logistics Industry’s Fortunes Busting after Booming in the Inland Empire.” San Bernardino Sun, August 31, 2023. https://www.sbsun.com/2023/08/31/logistics-industrys-fortunesbusting-after-booming-in-the-inland-empire/
“Passenger and Freight Statistics.” Ontario International Airport, Accessed October 13, 2023. https://www.flyontario.com/ air-service/statistics
“Statistics.” John Wayne Airport, Orange County. Accessed October 17, 2023. https://www.ocair.com/about/news-info/ statistics/
“Top 25 Airports by Landed Weight of All-Cargo Operations.” Bureau of Transportation Statistics, US Department of Transportation. Accessed February 19, 2024. https://www.bts.dot.gov/browse-statistical-products-and-data/freightfacts-and-figures/top-25-airports-landed-weight-all
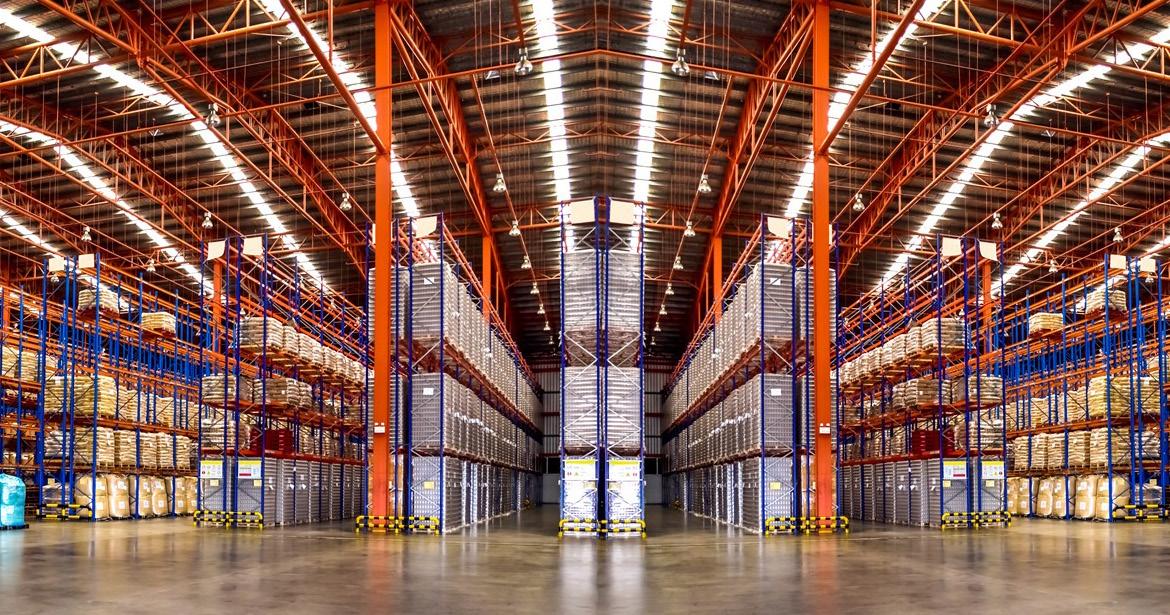
Over the past few decades, warehouses have taken over the Inland Empire landscape. The popularization of online shopping in the 1990s, coupled with the more recent spike in demand for home-delivered goods during the Covid-19 pandemic, have led to a massive surge in commercial warehouse construction in the region. The Los Angeles Times reports that roughly 40% of the nation’s goods in 2022 traveled through the Inland Empire at some point during transit from domestic manufacture or foreign import through final destination.
A few key factors help to explain why many companies such as Amazon, the Inland Empire’s largest private employer according to the Los Angeles Times, have selected the region as a place to set up shop. From a geographical perspective, the Inland Empire is home to a vast amount of open, flat land that has been considered “dirt cheap” for decades. Additionally, the region’s proximity to both Los Angeles and Long Beach, home to two of the nation’s largest ports, makes it an ideal choice for large-scale warehouse placement. The Port of Los Angeles accounted for 14% of the market share of U.S. trade in 2023, making it the most valuable seaport in the United States. The Port of Long Beach accounted for roughly 5% of the market share in 2023, putting it in sixth place on the national ranking.
Top 10 Seaports in the U.S. by Value (2023)
Sources: Port of Los Angeles, https://ustradenumbers.com/port/port-of-los-angeles/
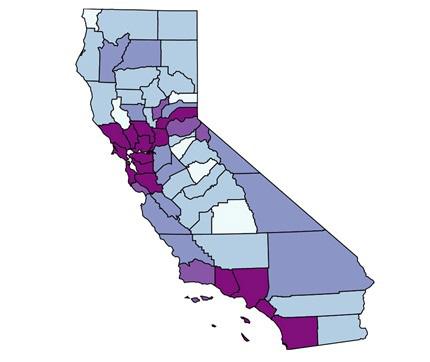
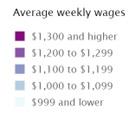
Susan Phillips, director of Pitzer College’s Robert Redford Conservancy, argues that the relatively low educational attainment of Inland Empire residents also makes the region an attractive place for employers looking to minimize labor costs. According to the Bureau of Labor Statistics, the Inland Empire’s average hourly pay of $27.99 is roughly $10 below the California average of $37.44. The map below displays the variance in average weekly wages by county in California in the fourth quarter of 2022. The statewide average was $1,679 and the national average was $1,385. Both Inland Empire counties had average wages significantly lower than the California and national figures. The Riverside County average was $1,098 and San Bernadino County was $1,149.
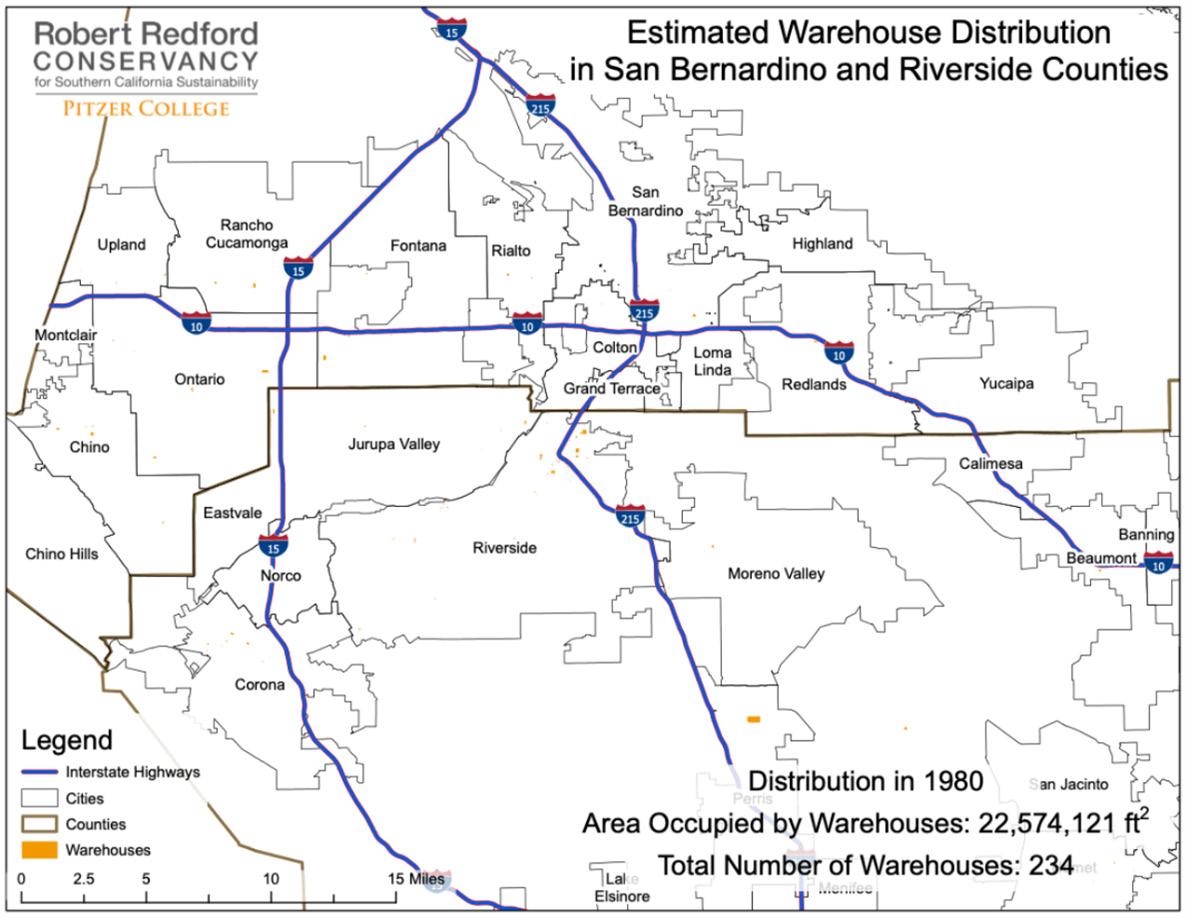
The Robert Redford Conservancy, in collaboration with Radical Research, LLC, has created a comprehensive database tracking the growth of warehouses in the Inland Empire since the mid-1970s. They produced maps to display the estimated warehouse distribution in both San Bernardino and Riverside Counties in 1980, 2000, and 2021. In 1980, San Bernardino and Riverside Counties together had approximately 230 warehouses, spanning 22,574,121 square feet. By 2000, this number had increased to roughly 970 warehouses spanning over 168,559,472 square feet. Their most recent update in 2021 shows the number of warehouses skyrocketing to over 4,000, with a combined square footage of over 1 million square feet.
Average
Average weekly wages
$1,300 and higher
$1,200 to $1,299
$1,100 to $1,199
$1,000 to $1,099
$999 and lower
Source: United States Department of Labor Statistics, https://www.bls.gov/regions/ west/news-release/countyemploymentandwages_california.htm#table2
Source: Warehouse and Air Quality Mapping, Robert Redford Conservancy for Southern California Sustainability, https://www.pitzer.edu/redfordconservancy/mapping-data-visualization/
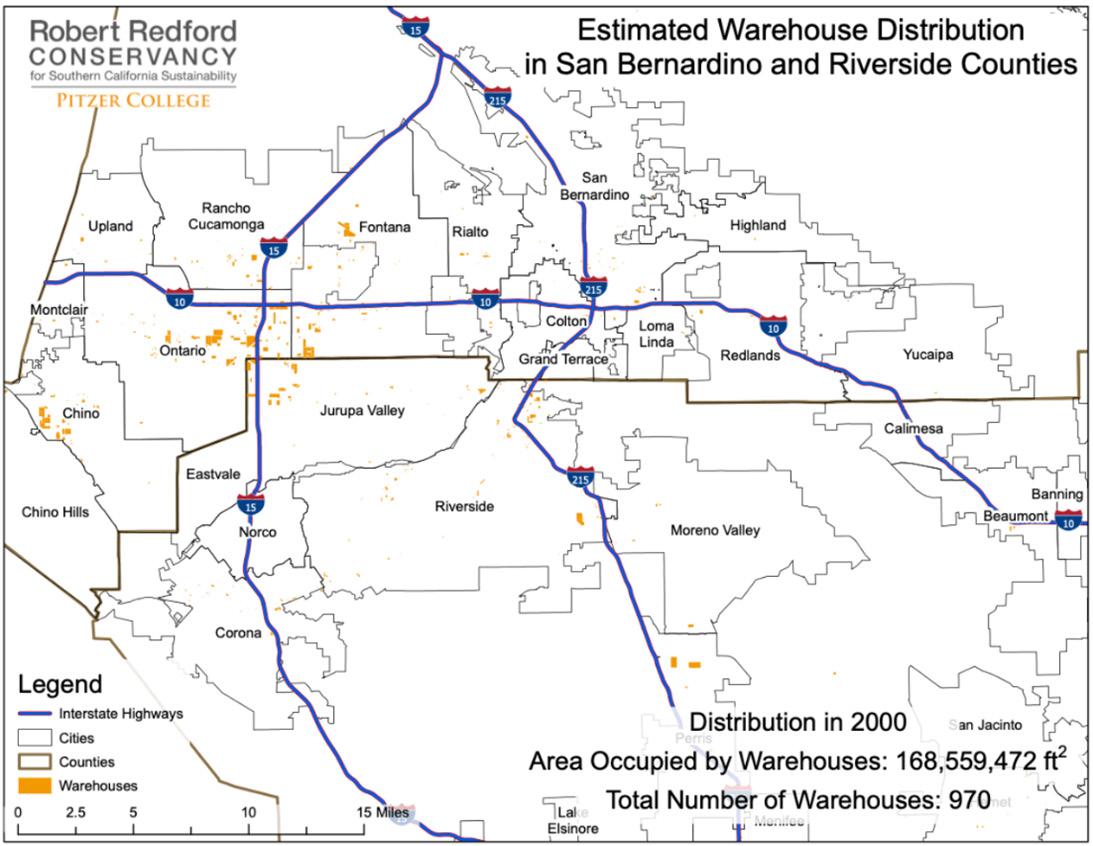
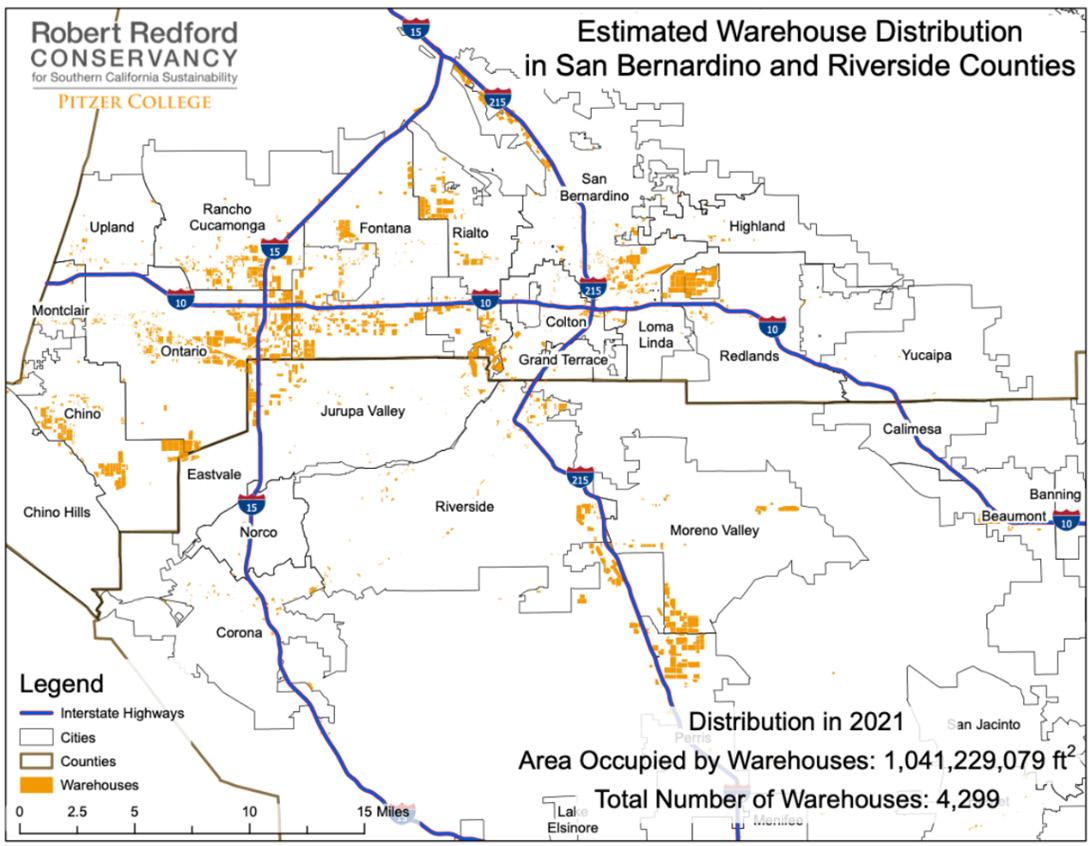
Source: Warehouse and Air Quality Mapping, Robert Redford Conservancy for Southern California Sustainability, https://www.pitzer.edu/redfordconservancy/mapping-data-visualization/
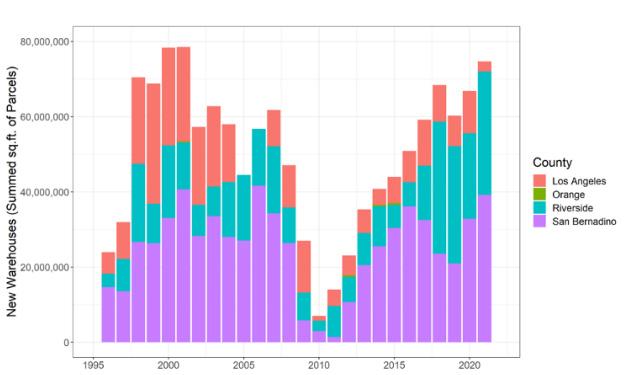
The warehouse boom has been an economic engine for the Inland Empire. Johannes Moenius, a professor of economics at the University of Redlands, wrote in the San Bernardino Sun last year that “as warehouses grew in size, disproportionately more workers worked in the industry – from 1990 to 2020, worker growth in the industry was almost double as fast as the increase in warehouses, and even size adjusted there are now almost twice as many workers in each comparable warehouse space than 30 years ago.” As a result of this vast employment opportunity, “both Riverside and San Bernardino counties returned earlier than California and the nation to pre-pandemic employment levels and labor force levels.” Some experts, however, are concerned that automation poses an imminent threat to this expanding labor market. One study conducted by the University of Redlands’ Institute of Spatial Economic Analysis indicated that as many as 63% of jobs in the Riverside-San Bernardino-Ontario area were at risk of automation by the year 2035.
The massive uptick in warehouses has caught the attention of various local environmental and labor advocacy groups who are concerned about its potential negative impacts on human health. Phillips of the Robert Redford Conservancy is one prominent opponent of continued warehouse expansion in the region. Along with sixty advocacy groups, Phillips wrote an open letter in January of 2023 addressed to Governor Gavin Newsom, which included a detailed report, urging Newsom to pass a moratorium on commercial warehousing in the Inland Empire. One of the many issues raised in the report is a concern for the increasing amount of air pollution produced by the warehouse growth. According to the American Lung Association, as of 2023, the two counties that make up the Inland Empire had the highest concentration of ozone pollution in the United States, and they ranked
seventh and eighth in year-round particular pollution. Phillips and her colleagues contend that this is a direct result of warehouse expansion. They say this explains why “cancer risk is in the 95th percentile near the Ontario warehouse gigacluster.” The close proximity of many of these warehouses to residential neighborhoods and schools is also highlighted in the report. At the time it was written, more than 300 warehouses were within 1,000 feet of 139 schools. Furthermore, the authors of the report argue that the current warehouse growth is an instance of environmental injustice. Since warehouses are being built in places where land is plentiful and relatively cheap, it is less well-off communities that both benefit and suffer from the consequences. According to the Los Angeles Times, a spokesperson for Governor Newsom did not comment on whether or not he would support a regional moratorium, “but pointed to Newsom’s order that heavy-duty truck manufacturers transition to zero-emission vehicles by 2045.” In addition to calling for a moratorium, many environmental advocacy groups argue that warehouse infrastructure should make better use of solar and electric power, both within the warehouses themselves as well as in the vehicles used to transport goods.
Besides the corporations that use and operate warehouses, other proponents of warehouse expansion include local elected officials and economists who argue that the development provides essential economic growth and employment opportunities. In a San Bernardino Sun article published last year, Fernando Lozano, a professor of economics at Pomona College, notes that “the broad industry category ‘Transportation and Warehousing’ has generated 1 of every 4 new jobs in the Inland Empire.” According to Lozano, “altogether this sector accounts for almost $1 billion a month of total wages paid, equivalent to 15% of all wages in the region.”
Looking towards the future, there is some debate about whether or not the warehousing industry in the Inland Empire will continue to expand and to provide increasing employment opportunities. Economists such as Professor Moenius argue that automation will radically transform the warehousing industry and sizably reduce the number of available jobs. According to an article recently published in the Los Angeles Times, in the past year, “Warehousing and storage jobs in the Inland Empire shrank for the first time in more than two decades.” However, optimism remains among some industry leaders as to the future of the industry. In the article, Hamid Moghadam, chief executive of Prologis, a logistics real estate company prominent in the Inland Empire, says, “The logistics business in Southern California is getting back on its feet after the pandemic.” The article states that Moghadam and other developers are “bullish on the future.” Also featured in the article, Iddo Benzeevi, another real estate developer involved in a logistics center project in the Inland Empire, says, “key drivers of growth remain intact – e-commerce, global trade, demand for larger, more efficient distribution centers.” Despite this difference of opinion, the experts generally agree that the warehousing industry needs to continue to implement environmentally friendly, innovative technologies as they become available.♦

Source: Wall Street Journal, https://www.wsj.com/articles/logistics-hiring-surge-incalifornias-inland-empire-cant-satisfy-demand-11640205600.

American Lung Association. “Most Polluted Places to Live | State of the Air.” Accessed February 17, 2024. https://www.lung. org/research/sota/key-findings/most-polluted-places
Berger, Paul. “Logistics Hiring Surge in California’s Inland Empire Can’t Satisfy Demand.” Wall Street Journal, December 22, 2021, sec. C Suite. https://www.wsj.com/articles/logistics-hiring-surge-in-californias-inland-empire-cant-satisfydemand-11640205600
“County Employment and Wages in California — Fourth Quarter 2022: Western Information Office: U.S. Bureau of Labor Statistics.” Accessed February 18, 2024. https://www.bls.gov/regions/west/news-release/ countyemploymentandwages_california.htm
Downey, David. “What Is the Future of Warehouses in the Inland Empire?” Redlands Daily Facts, October 20, 2021. https:// www.pe.com/2021/10/20/what-is-the-future-of-warehouses-in-the-inland-empire/
Fonseca, Ryan. “Inland Empire Residents Are Fighting Warehouse Sprawl.” Los Angeles Times, February 7, 2023. https://www. latimes.com/california/newsletter/2023-02-07/essential-california-warehouses-inland-empire-essential-california Lee, Don, and Samantha Masunaga. “The Inland Empire’s Once-Unstoppable Warehousing Industry Falls into a Slump.” Los Angeles Times, February 21, 2024. https://www.latimes.com/business/story/2024-02-21/inland-empires-logisticswarehouse-trucking-economy-layoff-downturn
“Local Area Unemployment Statistics.” United States Department of Labor: U.S. Bureau of Labor Statistics, n.d. https://www. bls.gov/lau/home.htm
Lozano, Fernando. “Inland Empire Warehousing: A Regional Perspective on a Local Problem.” San Bernardino Sun, March 31, 2023. https://www.sbsun.com/2023/03/31/inland-empire-warehousing-a-regional-perspective-on-a-local-problem/
Mason, Melanie. “Millions of Californians’ Jobs Could Be Affected by Automation — a Scenario the next Governor Has to Address.” Los Angeles Times, October 14, 2018. https://www.latimes.com/projects/la-pol-ca-next-california-work/
Moenius, Johannes. “Warehouses Pose a Dilemma for the Inland Empire.” San Bernardino Sun, October 13, 2022. https:// www.sbsun.com/2022/10/13/warehouses-pose-a-dilemma-for-the-inland-empire/
“Occupational Employment and Wages in Riverside-San Bernadino-Ontario — May 2022.” United States Department of Labor: U.S. Bureau of Labor Statistics, June 8, 2023. https://www.bls.gov/regions/west/news-release/ occupationalemploymentandwages_riverside.htm.
Phillips, Susan A. “Op-Ed: We Mapped the Warehouse Takeover of the Inland Empire. The Results Are Overwhelming.” Los Angeles Times, May 1, 2022. https://www.latimes.com/opinion/story/2022-05-01/inland-empire-warehouse-growthmap-environment
Phillips, Susan A. et al. to Governor Gavin Newsom, January 24, 2023. https://calmatters.org/wp-content/uploads/2022/06/ State-of-Emergency-Public-Health-Request.pdf
Robert Redford Conservancy. “Warehouse CITY.” https://radicalresearch.shinyapps.io/WarehouseCITY/
“State and Metro Area Employment, Hours, & Earnings.” United States Department of Labor: U.S. Bureau of Labor Statistics, n.d. https://www.bls.gov/sae/tables/annual-average/table-4-average-hours-and-earnings-of-all-employees-on-privatenonfarm-payrolls-by-state.htm
The Economist. “Is the Warehouse Business Recession-Proof?” September 22, 2022, sec. Business. https://www.economist. com/business/2022/09/22/is-the-warehouse-business-recession-proof
Uranga, Rachel. “Warehouse Boom Transformed Inland Empire. Are Jobs Worth the Environmental Degradation?” Los Angeles Times, February 5, 2023. https://www.latimes.com/california/story/2023-02-05/warehouses-big-rigs-fillinland-empire-streets
USTradeNumbers. “Port of Los Angeles.” Accessed February 18, 2024. https://ustradenumbers.com/port/port-of-losangeles/

Inthis Inland Empire Outlook Election Forecast, we analyze Inland Empire legislative races in the 2024 election cycle. Our ratings format is inspired by Nate Silver’s 538 final 2022 elections forecast. A Toss-up rating indicates that neither party is currently favored to win. A Lean rating means that one party is narrowly favored. A Likely rating suggests one party will win under a large majority of circumstances. A Safe rating denotes that one party will win
the seat regardless of the broader electoral environment. These ratings take into account demographics, incumbency, past election results/trends, and candidate fundraising. Additionally, these ratings are not a definitive prediction of final outcomes in these races, but instead are a snapshot of the current political environment on the eve of the March Primary, which in some cases will change before the November General Election.
James
Open
Open
Corey
The Inland Empire features competitive assembly races in Districts 36 and 47. In District 36, incumbent Eduardo Garcia (D) opted not to run, leaving this Biden +14.8 district open. This heavily-Hispanic district anchored around Coachella and the Colorado River farming communities has begun moving right in recent years, though it’s not expected
to change hands in 2024. In District 47, incumbent Greg Wallis (R) faces a tough re-election bid after winning by 0.1% in 2022. This Palm Springs-based district raced leftward during the Trump presidency, and President Biden is very likely to carry this district in 2024, complicating things for Mr. Wallis.
34 San Bernardino, Kern, Los Angeles Lancaster, Barstow *Tom Lackey (R)
Ricardo Ortega (D)
36 San Bernardino, Riverside, Imperial Indio, Blythe, El Centro, Needles
Joey Acuña Jr. (D)
Waymond Fermon (D)
Jeff Gonzalez (R)
Kalin Morse (R)
39 San Bernardino, Los Angeles Lancaster, Palmdale, Victorville *Juan Carrillo Ventura (D)
Paul Andre Marsh (R)
41 Los Angeles, San Bernardino Pasadena, Claremont, San Dimas John Harabedian (D)
Jed Leano (D)
Phlunte’ Riddle (D)
Michelle Del Rosario Martinez (R)
45 San Bernardino San Bernadino, Rialto James Ramos (D)
47 San Bernardino, Riverside Palm Springs, Palm Desert, Calimesa
Christy Holstege (D)
Jamie Swain (D)
*Greg Wallis (R)
50 San Bernardino Rancho Cucamonga, Redlands, Fontana Robert Garcia (D)
53 San Bernardino, Los Angeles Pomona, Ontario, Upland
58 San Bernardino, Riverside Riverside, Corona
59
63
Adam Perez (D)
DeJonaé Shaw (D)
Javier Hernandez (D)
Michelle Rodriguez (D)
Robert Torres (D)
Nick Wilson (R)
Carlos Goytia (D)
Clarissa Cervantes (D)
Ronaldo Fierro (D)
Leticia Castillo (R)
Dave Obrand (D)
*Phillip Chen (R)
(D)
Hector Diaz-Nava (R)
Ron Edwards (R)
(D)
*Bilal Essayli (R)
Orlando Munguia (NPP)
Kephart (D)
Kate Sanchez (R)
Babar Khan (NPP)
Similar to the situation with assembly districts, the Inland Empire features only two competitive state senate elections this fall, Districts 19 and 21. One unique feature of these two races is that the incumbents, Monique Limón (D), the incumbent of District 19, and Rosilicie Ochoa Bogh (R), the incumbent of District 21, are both jumping ship to run in each other’s more politically favorable district. This unusual occurrence happened due to the 2021 redistricting cycle, where both senators found themselves in districts that would have voted for the opposite party if they had existed in the 2020 elections. Starting with District 19, this Trump
+0.3% seat, based around the outer suburbs and rural areas of San Bernardino and Riverside Counties, has swung rapidly to the left in the Trump area. Ms. Bogh looks to be facing a tough re-election battle as she’s facing unfortunate trends in a district likely to be decided by a few hundred or thousand votes. In District 21, Ms. Limón faces slightly more favorable odds in this suburban district anchored around the cities of Santa Clarita and Hesperia. This district has moved moderately towards the Democratic party since 2016, helping her chances, though the final margin will likely be close.
James “DJ” Hamburger (R)
Suzette Martinez Valladares (R)
Ollie M. McCaulley (D)
Kipp Mueller (D)
Blanca Azucena Gomez (D)
Elizabeth Wong
Sandra Armenta (D)
Sasha Renée Pérez (D)
(R)
Yvonne Yiu (D)
Teddy Choi (D)
Carlos
Eloise
Jason O’Brien (D)
Kathleen
Angelo Farooq (D)
(D)
(D)
Cynthia Navarro (R)

On the congressional level, in 2024 the Inland Empire will host two competitive elections for the House of Representatives in Districts 40 and 41. Both seats are currently held by Republicans. In theory, Rep. Young Kim faces an uphill battle for re-election in District 40, a mostly eastern Orange County district that narrowly extends into Chino Hills. The district swung dramatically toward Democrats in the Trump era, with Mr. Biden taking it by 1.9% in 2020. However, Rep. Kim, overperformed expectations in 2022, winning by 13.7%, making this year’s race a tossup. Similarly, Rep. Ken Calvert faces another
hotly contested election in the Riverside-based district anchored around the cities of Corona and Palm Desert. This district has become increasingly competitive as the Coachella Valley has marched leftward as it attracts wealthier residents. Mr. Calvert won the district by 4.7% in 2022 in a year that was supposed to favor Republicans, illustrating the district’s narrow Republican lean.
*All percentages and margins of victory discussed in this piece use two-party vote share. ♦
Raul Ruiz (CD-25)
Judy Chu (CD-28)
Pete Aguilar (CD-33)
Norma Torres (CD-35)
Mark Tano (CD-39)
23 San Bernardino, Los Angeles, Kern Redlands, Victorville, Fort Irwin
25 Imperial, Riverside, San Bernardino El Centro, Indio, Hemet, Needles
28 Los Angeles, San Bernardino Pasadena, Arcadia, La Canada-Flintridge, Claremont
33 San Bernardino San Bernardino, Rancho Cucamonga
35 San Bernardino, Los Angeles, Riverside Pomona, Ontario, Chino, Fontana
39 Riverside Riverside, Moreno Valley
*Jay Obernolte (R)
Derek Marshall (D)
*Raul Ruiz (D)
Miguel Chapa (R)
Oscar Ortiz (D)
Ceci Truman (R)
Ian M. Weeks (R)
Ryan Dean Burkett (NPP)
*Judy Chu (D)
April Verlato (R)
Jose Castaneda (L)
William Patterson (PF)
*Pete Aguilar (D)
Tom Herman (R)
*Norma Torres (D)
Mike Cargile (R)
Melissa May (D)
Vijal Suthar (R)
*Mark Takano (D)
David Serpa (R)
40 San Bernardino, Riverside, Orange Chino Hills, Yorba Linda, Mission Viejo, Tustin *Young Kim (R)
Allyson Damikolas (D)
Joe Kerr (D)
41 Riverside Corona, Lake Elsinore, Menifee, Palm Desert *Ken Calvert (R)
Anna Nevenic (D)
Will Rollins (D)
48 San Diego, Riverside Temecula, Murrieta, Poway, Santee, Campo
*Darrell Issa (R)
Stephen Houlahan (D)
Matthew Rascon (D)
Whitney Shanahan (D)
Mike Simon (D)
Lucinda KWH Jahn (NPP)


Proposition 1 is a two-part initiative that seeks to amend California’s Mental Health Services Act (MHSA) to increase the allocation of funds for the state through a $6.4 billion general obligation bond. Two-thirds of the money would pay for more treatment centers for substance abuse treatment and the remainder would fund housing for individuals with mental health or substance abuse problems.
Proposition 1 would alter the California MHSA by changing how counties fund services while instituting a general obligation bond to build housing facilities for substance abuse and mental health treatment. Prop 1 would rename California’s MHSA to the Behavioral Health Services Act (BHSA) and expand its scope to substance abuse disorders in general. It would shift California’s existing funding allocation for county mental health programming by decreasing the percentage of MHSA taxes counties receive by 5% while doubling the state government’s share of MHSA money. The state would be required to spend a dedicated portion of these funds on programs to decrease the pervasiveness of drug addiction and mental illness and augment the number of mental healthcare workers. Proposition 1 would also alter the MHSA by changing how counties could still provide mental health and substance use services. Under Prop 1, counties could still provide mental health services such as treatment, outreach, and crisis response but would have less MHSA money available
to fund such programs. Instead, counties would be required to spend at least 30% of their funding on housing and to focus money on support services for people with mental illness or substance abuse problems.
Prop 1 also authorizes a bond that would fund two forms of construction: treatment centers and housing projects. It would allow the state to sell $6.4 billion in bonds, the primary method through which California borrows money. Up to $4.4 billion of the bond would go to state programs that construct buildings for substance use or mental health treatment, and at least $1.5 billion would be designated to tribes and municipalities. Proposition 1 would designate the funds to state programs that repurpose existing buildings or construct new buildings to house people who are at risk of or experiencing homelessness and those experiencing mental health or substance abuse issues. Notably, Prop 1 would set aside half of the housing bond funding for veterans.
Supporters of Proposition 1 include Governor Gavin Newsom, Los Angeles Mayor Karen Bass, the California Hospital Association, Kaiser Permanente, and the Federated Indians of Graton Rancheria.
Opponents of Proposition 1 include Cal Voices, League of Women Voters of California, Disability Rights California, and Mental Health America in California.
A YES vote on Proposition 1 would make counties change some of their mental health and substance use treatment services to shift focus onto housing and support services. It would expand how much funding the state receives from the MHSA and stipulate how counties can spend their MHSA money. Also, the state could borrow $6.4 billion to build housing and treatment centers for people with mental health and substance use challenges.
A NO vote on Proposition 1 means that counties would not change their current treatment services and the state could not borrow $6.4 billion to build treatment and housing facilities. ♦
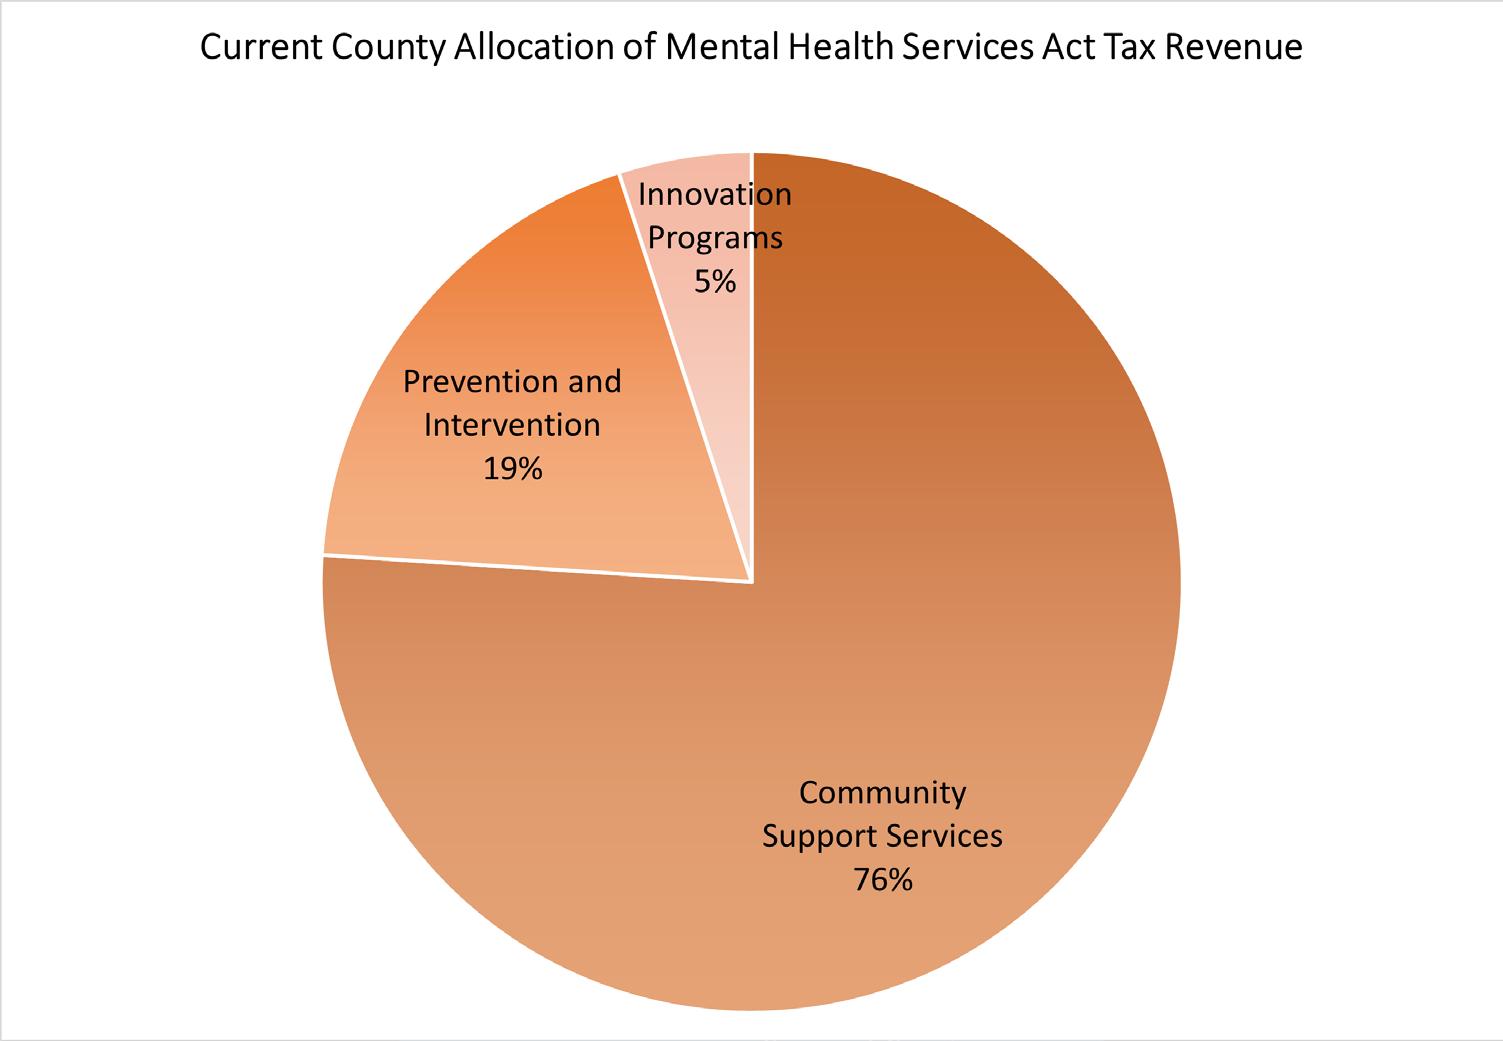
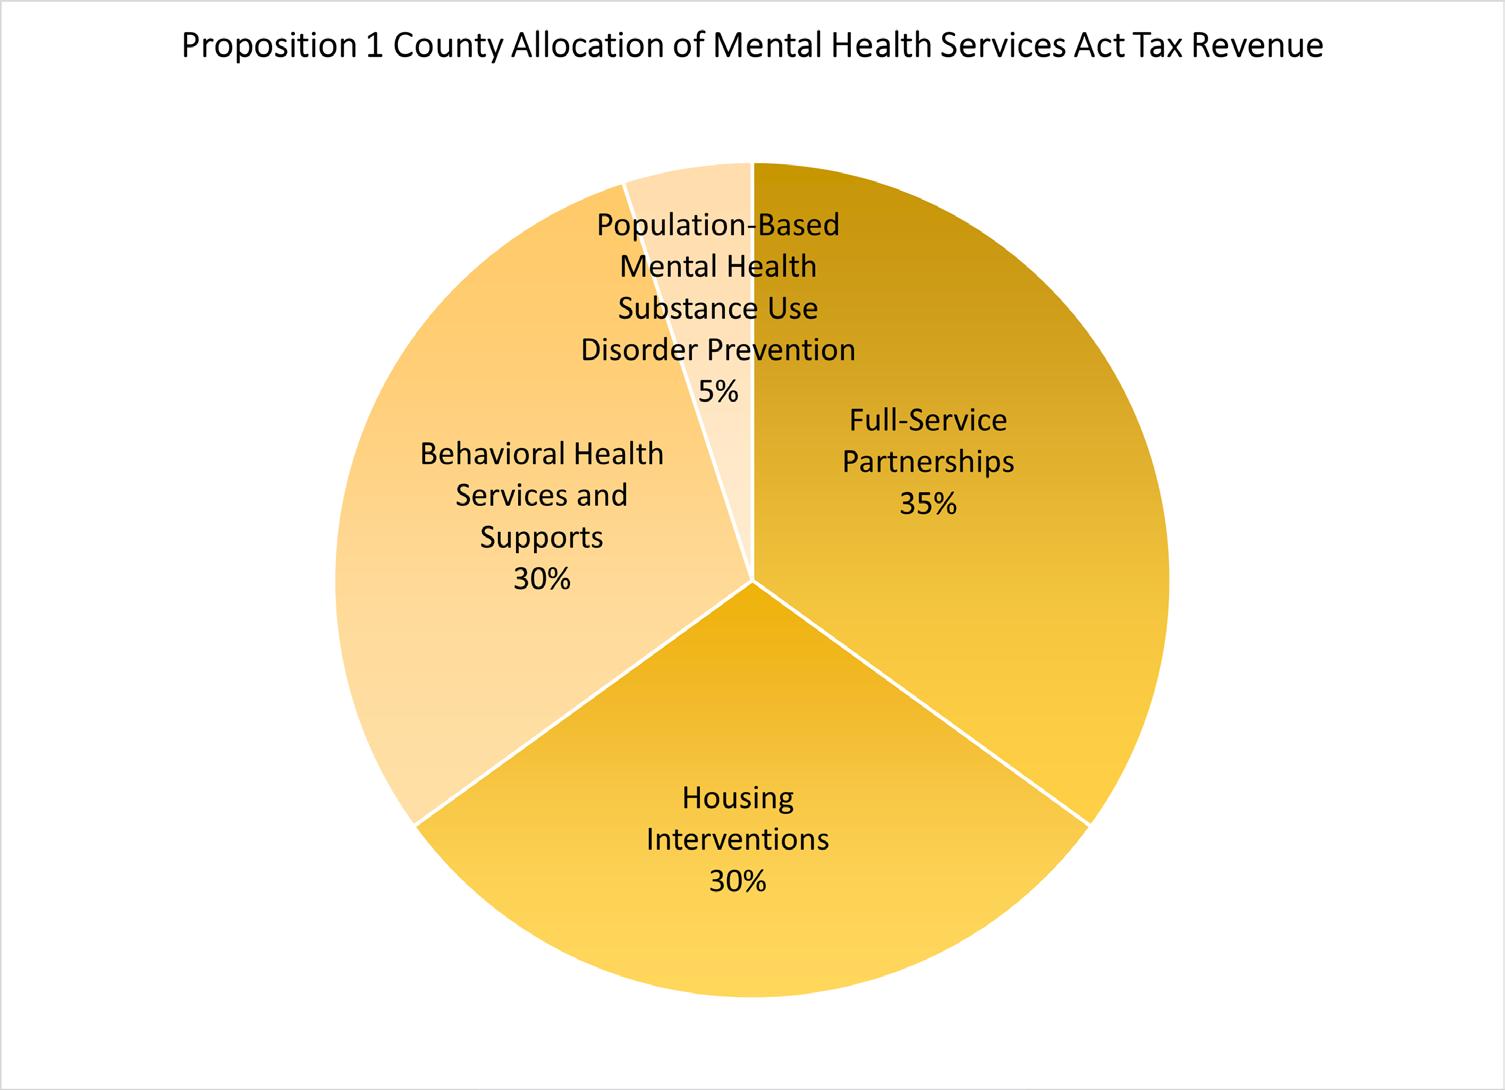
Source: “Proposed Restructuring of the MHSA Funding Categories and Impacts on County Spending.” Legislative Analyst’s Office. https://lao.ca.gov/Publications/Report/4782.
"Borrow $6.4 billion, change mental health law." Cal Matters. Accessed February 23, 2024. https://calmatters.org/californiavoter-guide-2024/prop-1-mental-health/
“California’s most vulnerable need treatment, not tents.” Treatment not Tents. https://treatmentnottents. com/?gad_source=1&gclid=Cj0KCQiAz8GuBhCxARIsAOpzk8z-Bfwm8KgoIEnnMNDsH-7dg4y5MXcCOXe_ FKO6FcGXrcf02qbEu10aAtEeEALw_wcB.
"Facts." Californians Against Prop 1. Accessed February 18, 2024. https://www.prop1no.com/ Official Voter Information Guide for Primary Election, March 5, 2024. Accessed February 23, 2024. https://vig.cdn.sos. ca.gov/2024/primary/pdf/topl.pdf.
“Proposed Restructuring of the MHSA Funding Categories and Impacts on County Spending.” Legislative Analyst’s Office. Accessed February 26, 2024. https://lao.ca.gov/Publications/Report/4782
“Proposition 1: Analysis of Measure.” Legislative Analyst’s Office. Accessed February 18, 2024. https://lao.ca.gov/ BallotAnalysis/Proposition?number=1&year=2024

EDITORIAL STAFF
Kenneth P. Miller, JD, PhD Director
Bipasa Nadon, JD Assistant Director
Marionette Moore Administrative Coordinator
Joseph M. Bessette, PhD Faculty Affiliate
STUDENT AUTHORS
Nikhil Agarwal ’24
Liann Bielicki ’24
Quinten Carney ’26
Joan Hanson SC’26
Katherine Lanzalotto ’25
The Rose Institute of State and Local Government was founded at Claremont McKenna College in 1973. Its mission is to enhance the education of students at CMC, to produce high quality research, and to promote public understanding of issues of state and local government, politics, and policy, with an emphasis on California. The Institute collects demographic, economic, and political and public opinion data and produces objective, non-partisan analyses that inform policymaking throughout the state. It also provides a civil forum for leaders across the political spectrum to discuss and debate public policy issues. The Institute is led by expert faculty and staff who collaborate with a team of approximately 30 students from the Claremont Colleges on all aspects of its research program.
To receive issues of this publication electronically and news from the Rose Institute, please e-mail us at roseinstitute@cmc.edu
Learn more about us at www.RoseInstitute.org.