
Contemporary Business Mathematics
Canadian 11th Edition by Hummelbrunner
Halliday Hassanlou Coombs ISBN
0134141083
9780134141084
Download solution manual at:
https://testbankpack.com/p/solution-manual-for-contemporarybusiness-mathematics-canadian-11th-edition-by-hummelbrunnerhalliday-hassanlou-coombs-isbn-0134141083-9780134141084/
Download full test bank at :
https://testbankpack.com/p/test-bank-for-contemporary-businessmathematics-canadian-11th-edition-by-hummelbrunner-hallidayhassanlou-coombs-isbn-0134141083-9780134141084/
Contemporary Business Math w/ Canadian Apps., 11e (Hummelbrunner/Coombs) Chapter 5 Cost-Volume-Profit Analysis and Break-Even
1) A manufacturer plans to introduce a new type of shirt based on the following information. The selling price is $57.00; variable cost per unit is $18.00; fixed costs are $7800.00; and capacity per period is 500 units.
a) Calculate the break-even point
(i) in units
(ii) in dollars
(iii) as a percent of capacity
b) Draw a detailed break-even chart.
c) Calculate the break-even point (in units) if fixed costs are reduced to $7020.00

d) Calculate the break-even point (in dollars) if the selling price is increased to $78.00
Answer: a) i) Let the volume be x units. Then equating the revenue function TR and the cost function TC we obtain:
57x = 7800 + 18x
57x - 18x = 7800
39x = 7800
x = 200 units
ii) 200($57) = $11 400.00
iii) (100) = 40%
c) Since new FC = $7020, then 57x = 7020 + 18x 39x = 7020 x = 180 units


d) 78x = 7800 + 18x 60x = 7800 x = 130 units
Break-Even Sales = 130($78) = $10 140.00
Diff: 2 Type: SA Page Ref: 189-202
Topic: 5.1 Cost-Volume-Profit Analysis and Break-Even Charts
Objective: 5-1 and 5-2: Construct and interpret cost-volume-profit charts; Compute break-even values using cost-volume-profit relationships.
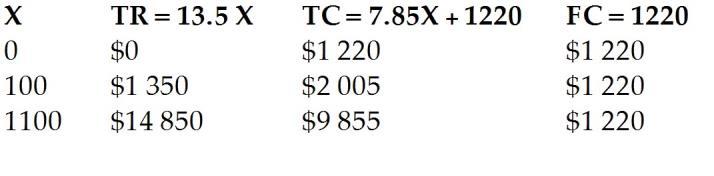
2) Priest and Sons, a local manufacturer of a product that sells for $13.50 per unit. Variable cost per unit is $7.85 and fixed cost per period is $1 220. Capacity per period is 1100 units.
Perform a break-even analysis showing

a) an algebraic statement of
(i) the revenue function;
(ii) the cost function;
(iii) calculate the break-even point in units.
b) a detailed break-even chart.
Answer:
a) Let the volume be x units
i) Revenue: TR = 13.5x
ii) Total cost: TC = 1220 + 7.85x
iii) TR = TC
13.5x = 7.85x + 1220
5.65x = 1220
x = 215.9 units = 216 units (rounded up)
b) Break-even chart
Diff: 2 Type: SA Page Ref: 189-202
Topic: 5.1 Cost-Volume-Profit Analysis and Break-Even Charts
Objective: 5-1 and 5-2: Construct and interpret cost-volume-profit charts; Compute break-even values using cost-volume-profit relationships.
3) Last year a printing company had total sales of $37 500. The total of its variable costs was $ 15 000, and fixed costs

Capacity is at sales maximum of $50 000.
a) Calculate the break-even point in
(i) dollars of sales
(ii) as a percent of capacity
b) Draw a detailed break-even chart
Answer:
a) i) Let x represent the sales volume in dollars.
Total Revenue: TR = x = = 0.40 = 40%


Total Cost: TC = 0.40x + 18 000
For Break-even point: TR = TC
x = 0.4x + 18 000
0.6x = 18 000

x = $30 000
ii) Break-even point as a percent of sales capacity is (100%) = 60% b)

Diff: 2 Type: SA Page Ref: 189-202
Topic: 5.1 Cost-Volume-Profit Analysis and Break-Even Charts
Objective: 5-1 and 5-2: Construct and interpret cost-volume-profit charts; Compute break-even values using cost-volume-profit relationships.
4) Olfert Greenhouses has compiled the following estimates for operations.
Perform a break-even analysis showing
a) an algebraic statement of
(i) the revenue function;
(ii) the cost function;


b) a detailed break-even chart.

Answer:
a) Let x represent the sales volume in dollars.
i) Revenue: TR = x
ii) = = 0.45
Total cost: TC = 45200 + 0.45x
b)
Diff: 2 Type: SA Page Ref: 189-202
Topic: 5.1 Cost-Volume-Profit Analysis and Break-Even Charts
Objective: 5-1 and 5-2: Construct and interpret cost-volume-profit charts; Compute break-even values using cost-volume-profit relationships.
5) The gas division of Power-U-Up plans to introduce a new gas delivery system based on the following accounting information.
Fixed costs per period are $4 236; variable cost per unit is $168; selling price per unit is $211; and capacity per period is 450 units.
a) Draw a detailed break-even chart

b) Compute the break-even point
(i) in units;
(ii) as a percent of capacity;
(iii) in dollars.
c) Determine the break-even point as a percent of capacity
(i) if fixed costs are reduced to $3 788;
(ii) if fixed costs are increases to $5 577 and variable costs are reduced to 75% of the selling price;
(iii) if the selling price is reduced to $191.
Answer:
a) Let the number of units be x. Then,
Total revenue: TR = 211x
Total cost: TC = 4236 + 168x

b) i) To break even, TR = TC
211x = 168 x + 4236
211x - 168x = 4236
43x = 4236
x = 98.51 units = 99 units (rounded up)

ii) Break-even volume as a percent of capacity
= = .22 = 22%
iii) Break-even volume in dollars = 99($211) = $20 889.
c) i) If fixed costs are $3 788, then
211x = 168x + 3788
211x - 168x = 3788
x = = 88.09
x = 89 units
Output level = = 19.78%
ii) If fixed costs are $5 577 and VC is 75% of P, then
VC = 0.75($211) = $158.25 and
211x = 158.25x + 5577


211x - 158.25x = 5577
52.75x = 5577
x = 105.725 = 106 units
The break-even point as a percent of capacity = = 23.56%
iii) If P is $191, then
191x = 168x + 4236
x = = 184.17
x = 185 units
The break-even point as a percent of capacity = = 41.11%
Diff: 2 Type: SA Page Ref: 189-202
Topic: 5.1 Cost-Volume-Profit Analysis and Break-Even Charts
Objective: 5-1 and 5-2: Construct and interpret cost-volume-profit charts; Compute break-even values using cost-volume-profit relationships.
6) The Excellent DVD Company sells DVDs for $62 each. Manufacturing cost is $22.70 per DVD; marketing costs are $7.75 per DVD; and royalty payments are 15% of the selling price. The fixed cost of preparing the DVDs is $227 300. Capacity is 20 000 DVDs.
a) Draw a detailed break-even chart.

b) Compute the break-even point
(i) in units;
(ii) in dollars;
(iii) as a percent of capacity.
c) Determine the break-even point in units if fixed costs are increased by $3300 while manufacturing cost is reduced $1.65 per DVD.
d) Determine the break-even point in units if the selling price is increased by 10% while fixed costs are increased by $2900.
Answer:
a) Let the number of DVDs be x
Total Revenue: TR = 62x
VC = 22.70 + 7.75 + 0.15(62) = $39.75
Total cost: TC = 227 300 + 39.75x

b) VC = $39.75
i) TR = TC
62x = 39.75x + 227 300
x = = 10215.73 = 10216 units (rounded up)


ii) BE point in sales dollars $62(10216) = $633 392.
iii) BE point as a % of capacity = 51.08%
c) FC = 227 300 + 3 300 = $230 600, VC = (22.70 - 1.65) + 7.75 + 0.15(62) = $38.10
62x = 38.10x + 230 600
x = = 9 648.53 = 9 649 units.
d) VC = 22.70 + 7.75 + .15(62 ∗ 1.1) = $40.68
P = 1.1($62) = $68.20
68.20x = 40.68x + 230200
x = = 8 259.4 = 8 365 units
Diff: 2 Type: SA Page Ref: 189-202
Topic: 5.1 Cost-Volume-Profit Analysis and Break-Even Charts
Objective: 5-1 and 5-2: Construct and interpret cost-volume-profit charts; Compute break-even values using cost-volume-profit relationships.
7) The operating budget of the Omega Twelve Company contains the following information. Sales
a) Draw a detailed break-even chart.
b) Compute the break-even point as a percent of capacity.

c) Determine the break-even point in dollars if fixed costs are reduced by $11 200 while variable costs are changed to 62% of sales.
Answer:
a) Let x represent the sales volume in dollars.
Total revenue: TR = x = = 58% of revenue = 0.58
Total cost: TC = 215 000 + 0.58x
b) Using the contribution margin approach and assuming that P = $1.00, we obtain:

CM = P-VC = 1-0.58 = 0.42

BE volume (in units) = = = 511904.76 = 511905 units

Capacity = = 700 000
BE volume as a percent of capacity = = 73.13%
c) FC = $203 800 and VC = 0.62, then CM = 1-0.62 = 0.38


CR = = = 0.38
BE in sales dollars = = = $536 315.79
Diff: 2 Type: SA Page Ref: 204-206
Topic: 5.2 Contribution Margin and Contribution Rate
Objective: 5-3: Compute break-even values using contribution margin and contribution rate.
8) Trevor, the new owner of the vehicle accessory shop is considering buying sets of winter tires for $299 per set and selling them at $520 each. Fixed costs related to this operation amount to $3 250 per month. It is expected that 18 sets per month could be sold. How much profit will Trevor make each month?
Answer: VC = 299, P = 520, FC = 3 250, then

CM = P-VC = 520-299 = 221
If Volume per month is 18 units, then
PFT = CM(X) - FC = 221(18) - 3250 = $728
Diff: 1 Type: SA Page Ref: 204-206
Topic: 5.2 Contribution Margin and Contribution Rate
Objective: 5-3: Compute break-even values using contribution margin and contribution rate.
9) Victor plans to set up an online business selling software applications that he develops and supports. He believes that a price of $130 for his product including the technical support would be competitive. His monthly fixed expenses amount to $850. Victor would hire some college students to provide the technical support of the application paying them for 3 hours at $15 per hour for each client.
a) How many clients does Victor need to acquire to break even?
b) If he wants to achieve a target profit of $500 monthly, how many clients does he need?
Answer: P = $130, FC = $850, VC = 3($15) = $45. Then,
CM = P-VC = 130 - 45 = $85
a) BE Volume (in units) = = = 10 units.
b) PFT = CM(X) - FC, where X is the volume in units, then 500 = 85X - 850


1350 = 85X x = 15.88 = 16 units monthly.
Diff: 2 Type: SA Page Ref: 204-206
Topic: 5.2 Contribution Margin and Contribution Rate
Objective: 5-3: Compute break-even values using contribution margin and contribution rate.
10) Elaine's business budget included sales of $350 000 and fixed costs of $52 600. If the total contribution margin for the business was $125 000, what are the sales needed to break even?
Answer: FC = $52 600, Total CM = $125 000


CR = = = 0.357143
Break-even Sales (in $) = = = $147 280
Diff: 1 Type: SA Page Ref: 208-210
Topic: 5.3 Effects of Changes to Cost-Volume-Profit
Objective: 5-4: Compute the effects of changes to cost, volume, and profit.
11) A company that makes cell phones has the following cost structure. The have fixed costs of $145 000 per period and manufacturing costs of $15.16 per cell phone. Advertising is expected to be $25 000 per period and a special promotional contest will involve providing a free case for a cost of $5.30 per cell phone. Each cell phone sells for $49.95. What is the break-even point in the number of phones?
A) 4886
B) 4917
C) 4168
D) 5765
E) 4240
Answer: D
Diff: 2 Type: MC Page Ref: 189-202
Topic: 5.1 Cost-Volume-Profit Analysis and Break-Even Charts
Objective: 5-1 and 5-2: Construct and interpret cost-volume-profit charts; Compute break-even values using cost-volume-profit relationships.
12) A pen manufacturer makes luxury pens. The pen case costs $7.26 each, the ink holder costs $1.26 each, the spring costs $.07 each and the velvet pen case costs $0.91 each. The plant has general and administrative costs of $55 000 and fixed selling expenses of $37 500. The pens sell of $39.95 each. Plant capacity is 4 000 pens per period. At what percentage of capacity is the break-even point?
A) 75.95%
B) 73.74%
C) 75.77%
D) 61.32%
E) 30.79%
Answer: A
Diff: 2 Type: MC Page Ref: 189-202
Topic: 5.1 Cost-Volume-Profit Analysis and Break-Even Charts
Objective: 5-1 and 5-2: Construct and interpret cost-volume-profit charts; Compute break-even values using cost-volume-profit relationships.
13) A local health care facility has fixed costs per month of $187 400. They also have patient costs of $4.15 per day per patient for linen and cleaning, medication costs are $23.32 per patient per day and lab tests cost $75.61 per patient per day. The government is considering allowing the health care facility to charge each patient and amount to recover his or her costs and to make a "profit" of $15 000 per month. The health care facility averages 690 patients per month. The VPFinance for the facility wants you to calculate the daily rate charge per patient. Your answer is:
A) $462.92
B) $396.41
C) $345.73
D) $284.51
E) $455.21
Answer: B
Diff: 2 Type: MC Page Ref: 189-202
Topic: 5.1 Cost-Volume-Profit Analysis and Break-Even Charts
Objective: 5-1 and 5-2: Construct and interpret cost-volume-profit charts; Compute break-even values using cost-volume-profit relationships.
14) A company that makes optical computer input devices has calculated their revenue and costs as follows for the most recent fiscal period:
What is the break-even point in sales dollars?
A) $362 500.00
B) $589 666.67
C) $241 666.67
D) $870 000.00
E) $280 333.33
Answer: C
Diff: 2 Type: MC Page Ref: 189-202
Topic: 5.1 Cost-Volume-Profit Analysis and Break-Even Charts
Objective: 5-1 and 5-2: Construct and interpret cost-volume-profit charts; Compute break-even values using cost-volume-profit relationships.
15) A company that makes environmental measuring devices has calculated their revenue and costs as follows for the most recent fiscal period:
What is the break-even point in sales dollars?
A) $100 000
B) $200 000
C) $300 000
D) $250 000
E) $450 000
Answer: C
Diff: 2 Type: MC Page Ref: 189-202
Topic: 5.1 Cost-Volume-Profit Analysis and Break-Even Charts
Objective: 5-1 and 5-2: Construct and interpret cost-volume-profit charts; Compute break-even values using cost-volume-profit relationships.
16) A company that makes audio computer input devices has calculated their revenue and costs as follows for the most recent fiscal period:
$723 000
$345 000
404 880
749 880
$(26 880)
The company has a target level of profitability of $35,000 per fiscal period. What sales dollar volume do they have to achieve in order to achieve their goal?
A) $840 909.09
B) $616 071.43
C) $784 090.91
D) $863 636.36
E) $678 571.43
Answer: D
Diff: 2 Type: MC Page Ref: 189-202
Topic: 5.1 Cost-Volume-Profit Analysis and Break-Even Charts
Objective: 5-1 and 5-2: Construct and interpret cost-volume-profit charts; Compute break-even values using cost-volume-profit relationships.
17) A company that makes basketballs has calculated their revenue and costs as follows for the most recent fiscal period:
Sales $623 000
Costs: Fixed Costs $???????
Variable Costs 404 880
Total Costs ???????
Net Income (Loss) $(26 880)
What are the company's fixed costs per fiscal period?
A) $245 000
B) $2 18120
C) $191 240
D) $1 054 760
E) $1 001000
Answer: A
Diff: 2 Type: MC Page Ref: 189-202
Topic: 5.1 Cost-Volume-Profit Analysis and Break-Even Charts
Objective: 5-1 and 5-2: Construct and interpret cost-volume-profit charts; Compute break-even values using cost-volume-profit relationships.
18) A company that makes customized pens has calculated their revenue and costs as follows for the most recent fiscal period:
Sales $100 000
Costs: Fixed Costs $???????
Variable Costs 15 000
Total Costs ???????
Net Income (Loss) $(20 000)
What are the company's fixed costs per fiscal period?
A) $105 000
B) $115 000
C) $80 000
D) $85 000
E) $120 000
Answer: A
Diff: 2 Type: MC Page Ref: 189-202
Topic: 5.1 Cost-Volume-Profit Analysis and Break-Even Charts
Objective: 5-1 and 5-2: Construct and interpret cost-volume-profit charts; Compute break-even values using cost-volume-profit relationships.
19) A local toolmaker makes the best hammers on the market. The head of the hammer costs $12.11 and the handle costs $4.37. It takes 1.4 minutes to assemble the hammer and the hourly cost is $90.00 for assembly time. The company has fixed operating costs of $22 310 per month. They sell the hammers for three times their total variable cost. The company wants to make a monthly profit of $5000. How many hammers must they sell?
A) 796
B) 735
C) 776
D) 766
E) 768
Answer: B
Diff: 2 Type: MC Page Ref: 189-202
Topic: 5.1 Cost-Volume-Profit Analysis and Break-Even Charts
Objective: 5-1 and 5-2: Construct and interpret cost-volume-profit charts; Compute break-even values using cost-volume-profit relationships.
20) A local restaurant has the best meals in town. The average variable cost per meal is $22.74 and the desserts are $5.24. Only half of the patrons order desserts. The restaurant has fixed operating costs of $112 714 per month. They sell the meals and desserts for four times their average variable cost per meal. They company wants to make a monthly profit of $75 000. How many meals must they sell?
A) 2 045
B) 2 236
C) 2 008
D) 2 803
E) 2 468
Answer: E
Diff: 2 Type: MC Page Ref: 189-202
Topic: 5.1 Cost-Volume-Profit Analysis and Break-Even Charts
Objective: 5-1 and 5-2: Construct and interpret cost-volume-profit charts; Compute break-even values using cost-volume-profit relationships.
21) A local college hospitality restaurant has the best meals in town. The average variable cost per meal is $10.25 and the desserts are $1.25. The restaurant has fixed operating costs of $110 500 per month. They sell the meals and desserts for three times their average variable cost per meal. The college wants to make a monthly profit of $50 000. How many meals must they sell (Round up to nearest whole meal)?
A) 4805
B) 6979
C) 6500
D) 8405
E) 9769
Answer: B
Diff: 2 Type: MC Page Ref: 189-202
Topic: 5.1 Cost-Volume-Profit Analysis and Break-Even Charts
Objective: 5-1 and 5-2: Construct and interpret cost-volume-profit charts; Compute break-even values using cost-volume-profit relationships.
22) A company has variable costs that are 3/8 the value of their sales revenues. Total net income for the most recent period was a profit of $123 400 and sales were $400 000. The company has started a new marketing campaign that they hope will increase sales, but it will require additional advertising of $11 200. How many sales dollars does the company have to generate in order to remain at the same level of profitability as before the new ad campaign?
A) $358 933.33
B) $215 360.00
C) $400 000.00
D) $417 920.00
E) $696 533.33
Answer: D
Diff: 3 Type: MC Page Ref: 208-210
Topic: 5.3 Effects of Changes to Cost-Volume-Profit
Objective: 5-4: Compute the effects of changes to cost, volume, and profit.
23) A company has variable costs that are 1/8 the value of their sales revenues. Total net income for the most recent period was a profit of $50 400 and sales were $500 000. The company has started a new marketing campaign that they hope will increase sales, but it will require additional advertising of $15 000. How many sales dollars does the company have to generate in order to remain at the same level of profitability as before the new ad campaign?
A) $517 142.86
B) $387 100.00
C) 392 100.00
D) $387 100.86
E) 392 100.86
Answer: A
Diff: 3 Type: MC Page Ref: 208-210
Topic: 5.3 Effects of Changes to Cost-Volume-Profit
Objective: 5-4: Compute the effects of changes to cost, volume, and profit.
24) A company has variable costs that are 4/7 the value of their sales revenues. Total net income for the most recent period was a profit of $53 770 and sales were $420 000. The company has started a new marketing campaign that they hope will increase sales, but it will require additional advertising of $6400. How many sales dollars does the company have to generate in order to remain at the same level of profitability as before the new ad campaign?
A) $434 933.33
B) $326 357.50
C) $420 210.00
D) $140 396.67
E) $105 297.50
Answer: A
Diff: 3 Type: MC Page Ref: 208-210
Topic: 5.3 Effects of Changes to Cost-Volume-Profit
Objective: 5-4: Compute the effects of changes to cost, volume, and profit.
25) Given the following chart, calculate the cost function. Interpret the function to calculate variable costs and fixed costs:
Answer: y-intercept = 840

Slope of the line = = 4

∴ Line is presented by the following relationship:
y = 4x + 840
In terms of cost this line is written as:
TC = VC + FC
∴ FC = $840 and VC = $4 per attendant
Diff: 2 Type: SA Page Ref: 189-202
Topic: 5.1 Cost-Volume-Profit Analysis and Break-Even Charts
Objective: 5-1 and 5-2: Construct and interpret cost-volume-profit charts; Compute break-even values using cost-volume-profit relationships.
26) An electrician charges a flat fee of $90 for a home service call. In addition he charges $25 for every 20 minutes as labour cost. Draw a graph to show the total charge against the time in hours.

Calculate the slope of the line.
Answer: Fixed cost = $90 (FC)
Variable cost = $25 for every 20 minutes = $75 per hour (TVC)
Total cost = TC = TVC + FC
TC = $75t + $90
∴ Slope of the line = 75
Following is the graph:
Diff: 1 Type: SA Page Ref: 189-202
Topic: 5.1 Cost-Volume-Profit Analysis and Break-Even Charts
Objective: 5-1 and 5-2: Construct and interpret cost-volume-profit charts; Compute break-even values using cost-volume-profit relationships.
27) Excel hardware is introducing a new product on a new product line of capacity 800 units per week at a production cost of $50 per unit. Fixed costs are $22,400 per week. Variable selling and shipping costs are estimated to be $20 per unit. Excel plan to market the new product at $110 per unit. What is the break-even capacity per week?
A) 204 B) 373
C) 560
D) 280
E) 320
Answer: C
Diff: 1 Type: MC Page Ref: 189-202
Topic: 5.1 Cost-Volume-Profit Analysis and Break-Even Charts
Objective: 5-1 and 5-2: Construct and interpret cost-volume-profit charts; Compute break-even values using cost-volume-profit relationships.
28) Excel hardware is introducing a new product on a new product line of capacity 800 units per week at a production cost of $50 per unit. Fixed costs are $22 400 per week. Variable selling and shipping costs are estimated to be $20 per unit. Excel plan to market the new product at $110 per unit. What would be the weekly net income at 90% of the capacity?
A) $9600
B) $7200
C) $6400
D) $56 800
E) $20 800
Answer: C
Diff: 2 Type: MC Page Ref: 189-202
Topic: 5.1 Cost-Volume-Profit Analysis and Break-Even Charts
Objective: 5-1 and 5-2: Construct and interpret cost-volume-profit charts; Compute break-even values using cost-volume-profit relationships.
29) Sala pipe fittings produce pipe elbows and reducers from stainless steel. The company can process up to 20 000 tonnes of stainless steel sheets in a year. The company pays the steel company $800 per tonne of stainless steel sheets and each tonne is used to manufacture $2000 worth of elbows and reducers. Variable processing costs are $470 per tonne and fixed processing costs $3.4 million per year at all production levels. Administrative overhead is $3 million per year regardless of the volume of the production. Marketing and transportation costs work out to be $230 per tonne. Determine the break-even volume in terms of percent capacity utilization.
A) 30%
B) 34%
C) 43.8%
D) 24.6%
E) 64% Answer: E
Diff: 2 Type: MC Page Ref: 189-202
Topic: 5.1 Cost-Volume-Profit Analysis and Break-Even Charts
Objective: 5-1 and 5-2: Construct and interpret cost-volume-profit charts; Compute break-even values using cost-volume-profit relationships.
30) Last year, Terrific Copying had total revenue of $475 000, while operating at 60% of capacity. The total of its variable cost is $150 000. Fixed costs were $180 000. What is Terrific's contribution rate?
A) 62.1%
B) 16.7%
C) 20%
D) 60%
E) 68.4% Answer: E
Diff: 1 Type: MC Page Ref: 204-206
Topic: 5.2 Contribution Margin and Contribution Rate
Objective: 5-3: Compute break-even values using contribution margin and contribution rate.
31) Sala pipe fittings produce pipe elbows and reducers from stainless steel. The company can process up to 20 000 tonnes of stainless steel sheets in a year. The company pays the steel company $800 per tonne of stainless steel sheets and each tonne is used to manufacture $2000 worth of elbows and reducers. Variable processing costs are $470 per tonne and fixed processing costs $3.4 million per year at all production levels. Administrative overhead is $3 million per year regardless of the volume of the production. Marketing and transportation costs work out to be $230 per tonne. In order to attain a net income of $2.4 million how many tonnes of steel must be processed this year?
Answer: Total fixed cost = $3 000 000 + $3 400 000 = $6 400 000
Total variable cost = $800 + $470 + $230 = $1500 per tonne
Net profit = Total revenue - Total Variable Cost - Fixed cost = Price × Volume - Variable cost per unit × volume - Fixed cost
⇒$2 400 000 = $2000 × N - $,500 × N - $6 400 000
⇒ N = 17 600
17 600 tonnes of steel must be processed this year to attain a net income of $2.4 million.
Diff: 2 Type: SA Page Ref: 189-202
Topic: 5.1 Cost-Volume-Profit Analysis and Break-Even Charts
Objective: 5-1 and 5-2: Construct and interpret cost-volume-profit charts; Compute break-even values using cost-volume-profit relationships.
32) Last year, Terrific Copying had total revenue of $475 000, while operating at 60% of capacity. The total of its variable cost is $150 000. Fixed costs were $180 000. What is Terrific's break-even point expressed in dollars of revenue?
A) $289 855
B) $1 077 844
C) $900 000
D) $263 158
E) $300 000
Answer: D
Diff: 1 Type: MC Page Ref: 204-206
Topic: 5.2 Contribution Margin and Contribution Rate
Objective: 5-3: Compute break-even values using contribution margin and contribution rate.
33) Last year, Terrific Copying had total revenue of $475 000, while operating at 60% of capacity. The total of its variable cost is $150 000. Fixed costs were $180 000. If the current selling price, variable costs, and fixed costs are the same as last year, what net income can be expected from revenue of $500 000 in the current year
A) $381 388
B) $394 737
C) $1 418 216
D) $1 184 210
E) $346 260
Answer: E
Diff: 1 Type: MC Page Ref: 208-210
Topic: 5.3 Effects of Changes to Cost-Volume-Profit
Objective: 5-4: Compute the effects of changes to cost, volume, and profit.
34) Last year, Terrific Copying had total revenue of $475 000, while operating at 60% of capacity. The total of its variable cost is $150 000. Fixed costs were $180 000. What is the expected revenue this year at full capacity?
A) $791 667
B) $250 000
C) $300 000
D) $550 000
E) $1 341 667
Answer: A
Diff: 1 Type: MC Page Ref: 208-210
Topic: 5.3 Effects of Changes to Cost-Volume-Profit
Objective: 5-4: Compute the effects of changes to cost, volume, and profit.
35) Calculate the contribution margin, if the variable cost per unit to produce a microwave is $39 and a contribution rate is 45%.
A) $17.55
B) $1.15
C) $70.91
D) $31.91
E) $39
Answer: D
Diff: 2 Type: MC Page Ref: 204-206
Topic: 5.2 Contribution Margin and Contribution Rate
Objective: 5-3: Compute break-even values using contribution margin and contribution rate.
36) Sunbeam wants to sell microwaves at a unit contribution margin of $42 and a unit contribution rate of 60%. What should be the break even volume if the total cost of production is kept below $10 000.
A) 143
B) 238
C) 357
D) 714
E) 900
Answer: B
Diff: 2 Type: MC Page Ref: 204-206
Topic: 5.2 Contribution Margin and Contribution Rate
Objective: 5-3: Compute break-even values using contribution margin and contribution rate.
37) Samsung sell refrigerators at $900 per unit. Their variable cost is estimated to be $550 per unit and their fixed costs are estimated to be $8.75 million per annum. Calculate the minimum number of units, Samsung should produce every year to make a profit?
A) 9722
B) 15 909
C) 25 000
D) 2500
E) 21 875
Answer: C
Diff: 2 Type: MC Page Ref: 189-202
Topic: 5.1 Cost-Volume-Profit Analysis and Break-Even Charts
Objective: 5-1 and 5-2: Construct and interpret cost-volume-profit charts; Compute break-even values using cost-volume-profit relationships.
38) Citizen sells a watch for $35 at a fixed cost of $1 million per annum. Recent recession has seen jump in material cost to $20. What is the new break-even volume of watches per year?
A) 28 571
B) 50 000
C) 66 667
D) 6667
E) 7000
Answer: C
Diff: 2 Type: MC Page Ref: 208-210
Topic: 5.3 Effects of Changes to Cost-Volume-Profit
Objective: 5-4: Compute the effects of changes to cost, volume, and profit.
39) Citizen sells a watch for $35 at a variable cost of $15 per unit and fixed cost of $1 million per annum. Recent recession has seen jump in material cost by $7. What is the change in profit due to recession if Citizen produces and sells 100 000 watches in a year?
A) $1 000 000 decrease
B) $700 000 decrease
C) $300 000 decrease
D) $800 000 increase
E) $1 800 000 increase
Answer: B
Diff: 2 Type: MC Page Ref: 208-210
Topic: 5.3 Effects of Changes to Cost-Volume-Profit
Objective: 5-4: Compute the effects of changes to cost, volume, and profit.
40) Caroline needs to put some money in her pocket this winter, so she plans on removing snow from driveways. She will need to pay $560 for a snow-blower to make her job easier. A variable cost of $3 per job for supplies would also be required. She estimates that she could clean 40 driveways a month. What price should she charge the customers for the service in order to break even?
Answer: X = 40; VC = 3.00; FC = 560.00
Let the price per unit be SP
(SP × 40) = 560 + (3 × 40)
(SP × 40) = 560 + 120
(SP × 40) = 660
SP = 17
Diff: 2 Type: SA Page Ref: 189-202
Topic: 5.1 Cost-Volume-Profit Analysis and Break-Even Charts
Objective: 5-2: Compute break-even values using cost-volume-profit relationships.
41) Caroline needs to put some money in her pocket this winter, so she plans on removing snow from driveways. She will need to pay $560 for a snow-blower to make her job easier. A variable cost of $3 per job for supplies would also be required. She estimates that she could clean 40 driveways a month. What price should she charge the customers for the service in order to make a profit of $1200?
Answer: X = 40; VC = 3.00; FC = 560.00; Profit = 1200.00

Let the price per unit be SP
(SP × 40) - 560 - (3 × 40) = 1200
(SP × 40) - 560 - 120 = 1200
(SP × 40) = 680 + 1200
SP = 47
Diff: 2 Type: SA Page Ref: 189-202
Topic: 5.1 Cost-Volume-Profit Analysis and Break-Even Charts
Objective: 5-2: Compute break-even values using cost-volume-profit relationships.
42) Raider Corporation made $130 000 in sales last year. They had fixed costs of $29 300 and variable costs of $26 000. What is the breakeven point if their capacity is at $160 000? Provide algebraic statements of the revenue and cost functions, as well as a breakeven point in sales dollars.
Answer: TR = 1 × X = = 0.2
TC = 29 300 + 0.2X
1.00X = 29 300 + 0.2X
0.8X = 29 300
X = 36 625
Diff: 2 Type: SA Page Ref: 189-202
Topic: 5.1 Cost-Volume-Profit Analysis and Break-Even Charts
Objective: 5-2: Compute break-even values using cost-volume-profit relationships.
43) A new smartphone is being sold by Motorola at $650. The fixed cost per month to make these phones is $840 000 and the variable cost per phone is $150. Determine the breakeven volume for Motorola using the contribution margin approach.
Answer: Fixed cost = $840 000; Selling price per unit = $650; Variable cost per unit = $150; Contribution margin per unit = 650 - 150 = 500
Breakeven volume = = 1680
Diff: 1 Type: SA Page Ref: 204-206
Topic: 5.2 Contribution Margin and Contribution Rate
Objective: 5-3: Compute break-even values using contribution margin and contribution rate.
44) Darby is running a flower stand, and is selling a single bouquet for $31.50. Her contribution margin is $24.57 per bouquet and the breakeven sales in dollars for Darby's flower stand are $700 per day. How much can she pay per day in fixed costs to run the stand?
Answer: CM = 24.57

Contribution rate =
Contribution rate =
Contribution rate = 0.78 = 78%
Breakeven sales =
700 =
700 × 0.78 = FC
546 = FC
Diff: 4 Type: SA Page Ref: 204-206
Topic: 5.2 Contribution Margin and Contribution Rate
Objective: 5-3: Compute break-even values using contribution margin and contribution rate.
45) Tarfex Tech intended to sell a new product in order to keep up with customer demands. The product was to be sold to consumers at $620, creating a contribution margin of $150 per unit. They spent $9800 on advertising and were able to sell 1,200 units on the first day. Determine the resulting profit.
Answer: X = 1200; CM = 150; FC = 9800.00; SP = 620.00


Contribution margin per unit = Selling price per unit - Variable cost per unit


150 = 620 - VC
VC = 620 - 150
VC = 470
(Selling price × Volume) - Fixed cost - (Variable cost per unit × Volume) = Profit
(620 × 1200) - 9800 - (470 × 1200) = PFT
744 000 - 9800 564 000 = PFT
170 200 = PFT
Diff: 5 Type: SA Page Ref: 204-206
Topic: 5.2 Contribution Margin and Contribution Rate
Objective: 5-3: Compute break-even values using contribution margin and contribution rate.
46) Barb has a hot-dog stand near the ferry terminal for Centre Island. She pays $500 per month as rent and $3000 per month in wages for the hired help. Variable costs per hot dog come out to be $1.30 and she sells each hotdog for $3.00. In summer months, she is able to sell 4500 hotdogs in a month. Recently, another hot dog vendor opened his stand across the street. To attract and retain her customers, she added a free soda can which increased her variable costs by 20 cents. To make things worse, the rent was also increased by 15%. What is the change in her monthly net income due to these recent changes. Assume that the monthly sale figures remain at 4500 units.
Answer: OLD numbers X = 4500; VC = 1.30; FC = 500 + 3000 = 3500; SP= 3.00
(Selling price × Volume) - Fixed cost - (Variable cost per unit × Volume) = Profit
(3 × 4500) - 3500 - (1.30 × 4500) = PFT
4150 = PFT
NEW numbers X = 4500; VC = 1.30 + 0.20 = 1.50; FC = 1.15(500) + 3000 = 3575; SP = 3.00
(Selling price × Volume) - Fixed cost - (Variable cost per unit × Volume) = Profit
(3 × 4500) - 3575 - (1.50 × 4500) = PFT
3175 = PFT
Monthly profit is reduced by = 4150 - 3175 = 975
Diff: 5 Type: SA Page Ref: 208-210
Topic: 5.3 Effects of Changes to Cost-Volume-Profit
Objective: 5-4: Compute the effects of changes to cost, volume, and profit.
47) Barb has a hot-dog stand near the ferry terminal for Centre Island. She pays $500 per month as rent and $3000 per month in wages for the hired help. Variable costs per hot dog come out to be $1.30 and she sells each hotdog for $3.00. In summer months, she is able to sell 4500 hotdogs in a month. To increase her sales, she added a free soda can which increased her variable costs by 20 cents. However, it increased her monthly sales to 5000 units. What is the change in her monthly net income due to these recent changes.
Answer: OLD numbers X = 4500; VC = 1.30; FC = 500 + 3000 = 3500; SP = 3.00
(Selling price × Volume) - Fixed cost - (Variable cost per unit × Volume) = Profit
(3 × 4500) - 3500 - (1.30 × 4500) = PFT
4150 = PFT
NEW numbers X = 5000; VC = 1.30 + 0.20; FC = 500 + 3000 = 3500; SP = 3.00
(Selling price × Volume) - Fixed cost - (Variable cost per unit × Volume) = Profit
(3 × 5000) - 3500- (1.50 × 5000) = PFT
4000 = PFT
Change in monthly profit = 4000 - 4150 = -150
Diff: 4 Type: SA Page Ref: 208-210
Topic: 5.3 Effects of Changes to Cost-Volume-Profit
Objective: 5-4: Compute the effects of changes to cost, volume, and profit.