IshaanBarrett
January4,2024
VisualizingHousingBorderlands:HistoriesofMigration,Multiculturalism,CapitalFlight,and UrbanConflictinWashington,DC
Introduction
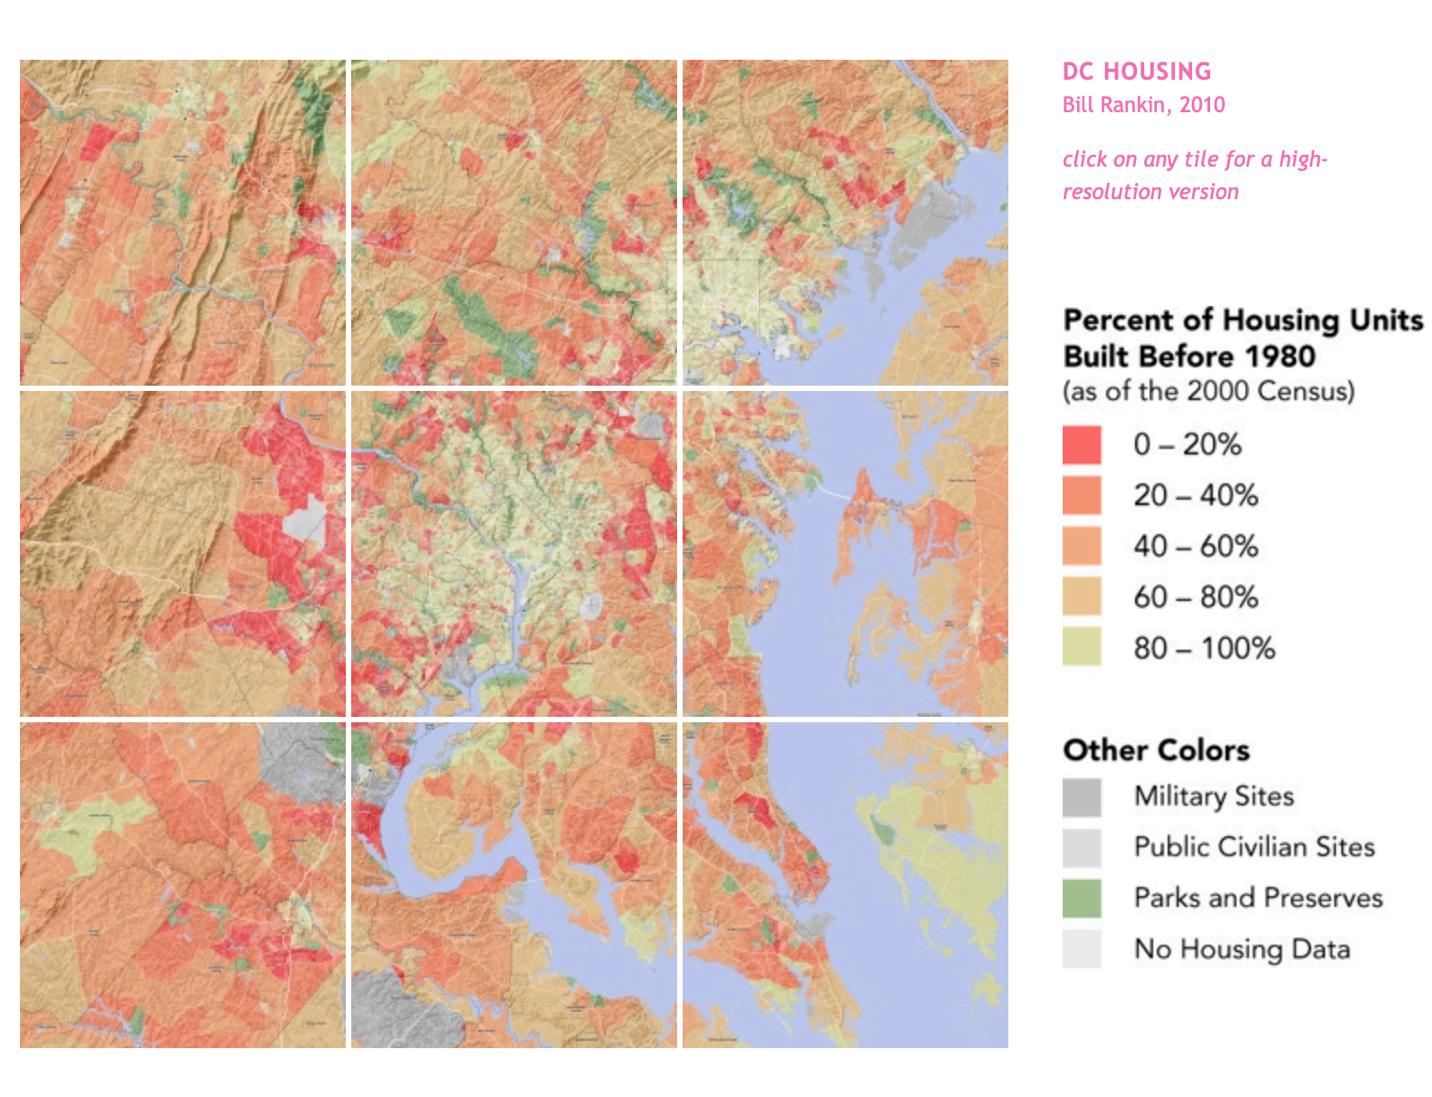
BillRankin’s2010mapofhousingdevelopmentintheWashington,DCmetropolitan areaisamosaicofredandgreen,enfoldingbothurbanandsuburbanareaswithinitsboundaries. Atfirstglance,thesheerscaleofRankin’smapmakesthesmalldiamond-shapedoutlineofDC hardtosee.Butpayingcloseattentiontothelightgreencoloredswathofthecitymakesitstand outagainstitssurroundingbackdropofred-tingedspace.Rankin—AssociateProfessorof HistoryatYaleUniversityandaward-winningcartographer—plotsthepercentageof“housing units”builtinthebroaderDCareabefore1980demarcatinglowerpercentagesinredandhigher percentagesingreen.Using1980asacriticaldateallowsRankintomeasuretherelative “newness”ofhousingunitsbetweentheurbancenterofDCandthesurroundingsuburbs.A formalanalysisofRankin’smaprevealsthelargelystagnantdevelopmentofhousingunits withinDC’surbancoreoverthepastthirtyyearsandtheexplosionofDC’ssuburbsby comparison.Atthesametime,theuniquetemporalpivotofRankin’sanalysisunderscoresthe tenuousrelationshipbetweenraceandplaceinWashington,DC.
ItisthecollectionofthesecartographictraitsthatmakesRankin’smapsouniqueand particularlyinterestingtostudyconceptsinurbanplanning,gentrification,capitalflight,andthe overarchingmulticulturalhistoryofDCthatpermeatesthesethemes.Mapssuchastheseallowa visualdiscourseofhousingandhistorytobecomeapparentwhilesurfacingthemanywaysthat geographyandurbanplanninginteractwithotherhistoricaleventsthatshapedournation’s capital.Thus,byanalyzinghistoryandvisualrepresentationsofhousing,thispaperdiscusses howurbanDCcanbedemarcatedbytheexplosiveeconomicgrowthofDC’ssuburbsdrivenby historicalpatternsofwhiteflightandethnictension.Thisexplorationbeginswithavisual analysisofRankin’smapandanoverviewofitslimitations;ittransitionstoadiscussionofits historicalbackgroundbeforereachingafinalsynthesisandconclusion.
VisualAnalysis
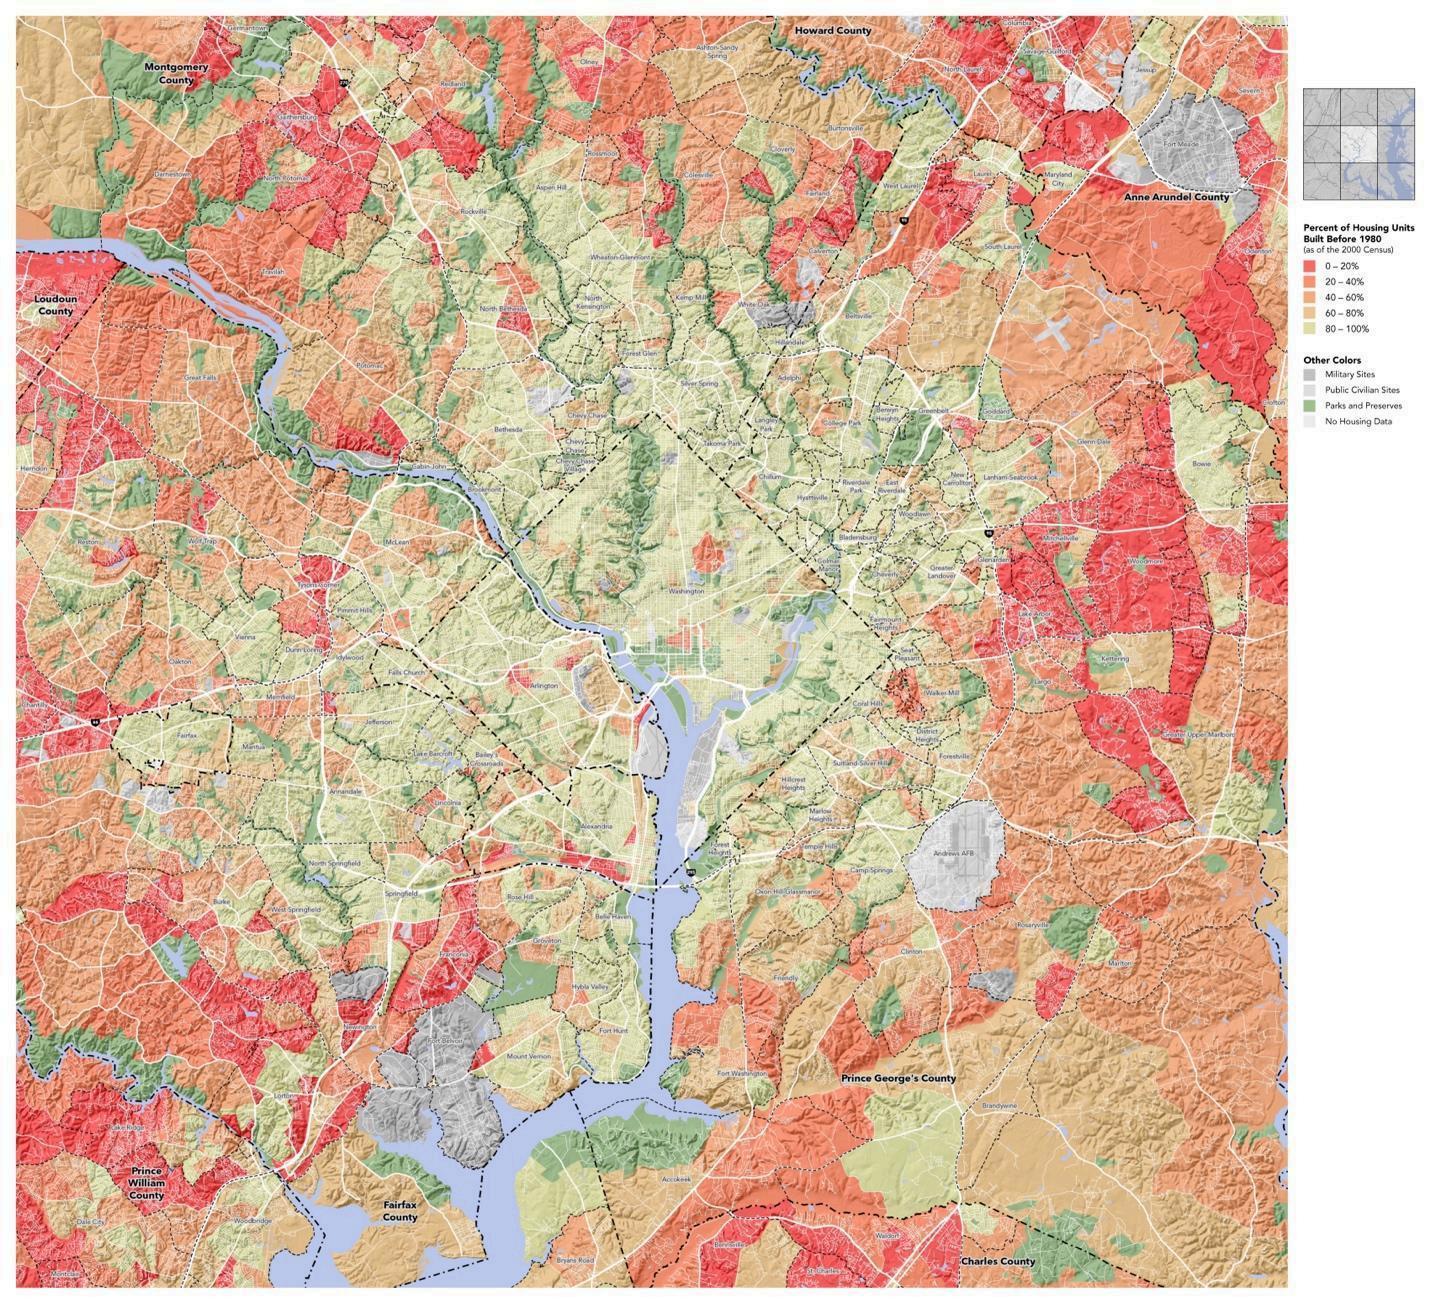
BeforeconsideringthelargermessageofRankin’smap,itisimportanttonotetheunique meritsofhisapproachtodocumentingthedevelopmentofhousingunitswithinDC’s“urban core”andthesurroundingsuburbs(Rankin2010).Themap’smoststrikingfeatureatfirstglance appearstobethecolorsthatareused;greenareasseemtocallforwardasenseofeasewhilered zonesalerttheviewertothepossibleharmfulimplicationsoftheseregions.Inthisway,Rankin isnotonlyabletoofferameaningfulvisualcharacteristictodistinguishtheage—oreven “newness”—ofhousingunitsbutcandeliveracritiqueofthenewerdevelopmentsthat potentiallyarosefromunfavorablecircumstances.Similarly,Rankin’suseofscaleandscopeis
particularlyimportant.HischoicetoincludeboththeWashington,DCmetropolitanareaandthe broadexpanseofthetri-stateareaprovidesawealthofvisualdatatoanalyze(Figure1).Red zonesofnewerhousingdevelopmentsformaringaroundthegreenpatchofDC,articulatingthe prominentdevelopmentlocalizedawayfromthecityandwithinitsperiphery(Rankin2010). Historicalscholarsarethusabletoappreciatehowparticulargeographicpatternsemergewhen DC’shousingdevelopmenttimelineismappedusingacolorgradient(Figure2).Rankin’smap breaksthemyththathousingdevelopmentchoicesaremadeopportunisticallybecauseit illustratesacohesivenetworkofnewerhousingunitswithinDC’ssuburbs.
LimitationsandHistoricalScholarship
Thismap,however,isnotwithoutlimitation.Whilethefocusofthemapremainsonthe relativeageofhousesintheDCarea,Rankin’smodelexcludesdemographicpatternsand historicalcontextthatmightexplainhowentitieschoselocationstobuildthesehousingunits.In addition,itprovidesasnapshotofwhathousingunitageslooklikerelativeto1980butneglects toexpoundontheeconomicimplicationsofthisinquiry Housingdevelopmentoutsidethecity allowforagrowingpopulationofsuburbanresidentstolivebeyondDCbutworkwithinit.This producesinherenteconomicinequityascapitalflow—intheformofincomeandproperty taxes—moveswiththeflowofresidentsfromwithinDCtothesuburbs.Butitalsohasunique effectsonthewayhousingiscommodifiedasamoney-makingresourcefordevelopment companies.Duringthelate19th andearly20th centuries,industrializationandurbangrowth progressed;atthesametime,capitalinvestmentshiftedawayfromtheinnercitytosuburban areas(Smith1979,p.285).Thismovementofcapitalrepresenteddevelopmentcompanies’ searchformoreprofitableopportunitiesinundevelopedsuburbanareas.Theseprofitscouldbe expandedbyacquiringlandatlowercosts,developinghousingonthisland,andoffering residentialunitsathighpricedifferential(Smith1979,p.287).Notonlydoesthisexplainthe newnessofRankin’ssuburbanhousingclusterbutelucidatesamorecomplicatedhistoryof suburbanmigrationinformedbyrace,ethnictension,andsocioeconomicinequality.
RobertManning’sarticleaboutthepost-industrialeconomicandsocialshiftsin Washington,DCprovidesnecessarycontextthatcansupplementRankin’svisualmodel.Inhis piece“MulticulturalWashington,DC,”Manninghighlightsthateffective“challengestoracist JimCrowpoliciesacceleratedurbanflight,especiallyschooldesegregation”(Manning1998, p.337).Nearly300,000whiteresidentsfromDC’smetropolitanareamovedtosuburbs, accountingforamoderatenumberofnewsuburbanresidentsbetween1950and1970.Ontopof that,ManninghighlightsthewidespreadimpactsofCivilRightsMovementandtheinfluxof localimmigrantsthatprecipitatedtheconditionsforDC’surbanriotsof1960(Manning1998). DCexperienced“anabruptshiftinthedemographicbalanceofpowerbetweencentralcityand suburbia”followingtheseeventsthatallowedthesuburbstogrowalongsideashrinkingurban population(Manning1998,p.337-8).Between1960and1980,theMarylandandVirginia suburbsexpandedfromamodest1.24milliontoastaggering2.4million;incontrast,theDistrict experiencedasteadypopulationdropfrom756,276in1970to638,333in1980andjust606,900
in1990(Manning1998,p.338).BrandiThomsonSummers,asociologistandhistorianstudying thehistoricallyBlackH-Streetneighborhood,documentsthetangibleimpactofthesechanges withinthecityduringtheCivilRightsera.
Forone,Summershighlightshownewfederalsubsidyprogramsacceleratedthe movementofpeoplefromurbanmetropolitanareastothesuburbs.Racistlendingpractices unfairlyprivilegedwhiteresidentsduringthe1940sand1950sandallowedasignificantinflux ofnewwhitehomeownersinthesuburbs(Summers2019,p.8).Duringthe1960’s,HStreet becamethecentralhubforBlackresidentsinWashington,DC;overtime,itboastednumerous markets,businesses,andcommercecenters.Buttheflightofmiddleclassresidentsfromthecity madeHStreetsufferasshoppersdivestedfromlocalbusinessesinfavorofsuburbanmalls (Summers2019,8).Gradually,Blackconsumers“leftcommercialcorridorslikeHStreetto falter”andbeganturningtothesuburbs.Onlythe1968arrivaloftheFairHousingActofficially allowedequallendingpracticesfornewBlackfamiliesandhomeownerstojoinwhiteresidents beyondDC’surbancenter(Summers2019,8).ThismovementofpeopleoutofHStreetwas eventuallycompoundedbythenumerousoutbreaksofviolencethroughoutDCandothercities nearby Afterthe1963MarchandWashingtonandMartinLutherKingJr’sfamous“IHavea Dream”speech,BlackDCresidentsexperiencedanewwaveofoptimism.Newlandmarkcourt casesandlegislationbroughtconcretehopetoresidentssearchingforequality
Butin1968,everythingchangedanditbecameclearthathostiletensionsinthecity, surfacedbyrisingBlackactivismalongsidepersistentpolicesurveillance,wouldremain (Summers2019,37).King’sassassination—compoundedbyarisingmovementagainst widespreadsocialandeconomicinjustices—spurredoutrageinthecity.Overthecourseof severaldays,Washington,DCexperiencedprotestsacrossnorthwestFourteenthStreet,theShaw district,andnortheastHStreet(Summers2019,37).Uprisingseruptedinheavilypopulated majorityBlackareasofnorthwestFourteenthandUStreetsbeforespreadingtoother neighborhoodsaswell(Summers2019,37).Inlaterdecades,despitethegovernment’s collaborationwithlocalorganizerstorebuildthesemajorityBlackneighborhoods,thetaskwas eventuallydeemedeconomicallyunfeasible.Urbandevelopersallowedtheseneighborhoodsto deterioratethroughaggressiverebrandingstrategiesthatcharacterizedthemnegatively (Summers2019,45-6).Householdsandwhitefamiliesespeciallybeganturningtothesuburbsto escapethehighsocialtensionsoftheinnercity.Widespreadrenewalfollowedbyaggressive gentrificationwouldwaituntilthe21st centurytoreachfullforceandconsequently,newsocial andeconomicissuesarose.Today,peopleinDCcontinuetofeeltheeffectsoftheserenewal projectsandseparatethehistoryofthecityintopre-andpost-riotrealities.Washington,DC’s identityas“ChocolateCity”—aplaceboastingamajorityBlackpopulation—liveswithinthis historyandisrelayedthroughthebuiltenvironmentofthecityaswell.Howthencanthis historicalnarrativeofsuburbanizationandracialtensionbeseeninRankin’smap?
DiscussionandConclusion
Rankin’smaprefractstheseprominentdemographicchangesbyusinghousingasan analyticallens.Selecting1980asapivotpointtostratifythepercentageofnewhousingunits furtherrevealssomeofWashington,DC’scomplicatedurbanhistory.Onthesurface,Rankin’s mapallowsustoexplorehousingasadynamicprocessthatextendsintothesuburbsby respondingtochangesincitycenters.Cheaplandcosts,highprofits,andamovementofpeople intothesuburbscharacterizethehighnumberofnewhousingunitscreatedfarbeyondDC’s urbancenter.Butmuch—ifnotall—ofthesenewdevelopmentswouldarrivewellafter1980;the highconcentrationofredfaroutsidetheDCdiamondshowstherelativenewnessofsuburban housingcomparedtothecity.DC’solderhousingdevelopmentsagreeswiththehistorythat Summersmakesclear:themovementofpeoplefromthecitytothesuburbsrespondedtothe activism,protests,andviolenceofWashington,DCinthe1960’s.Asmallgreenborderaround theDCdiamondshowstheseolderhousingdevelopmentsthatcroppedupbecauseofthese demographicandspatialshiftswithinthecity Buttheboomingredfarbeyondthecityhighlights theexplosionofthesuburbsasDC’surbanidentitywasforeverchangedbythe1968riots. Rankin’smapmightshowtheageofhousingunitsrelativeto1980inandaroundWashington, DC.Closeobserversandhistoricallymindedlookerswillunderstand,asevidencedinthispaper, howRankin’sattentiontohousingrevealsamorecomplicatedhistoryofsuburbanizationdriven bycapitalflightandracialmigrationbetween1940and1980.Thispaperobservestheunfolding ofhousingdevelopmentinDCwhilestitchingtogetherspatialandtemporalperspectivesthat unearthscomplicatedurbanhistories.Consequently,futureurbangeographers,mappers,andGIS practitionersmightexplorehousingasmorethanjustacontemporarymetricofeconomicgrowth anddevelopment,butalensofhistoricalanalysisthatcanlinktogethercomplexandchallenging momentsinthestudyofurbanhistory.
AppendixA(page4):Bibliography
AppendixB(pages5-6):Figures
AppendixA:Bibliography
Manning,RobertD.1998.“MulticulturalWashington,DC:TheChangingSocialandEconomic LandscapeofaPost-IndustrialMetropolis.” Ethnic and Racial Studies 21(2):328–55. https://doi.org/10.1080/014198798330043.
“Radicalcartography.”n.d.AccessedMarch5,2024.http://www.radicalcartography.net/.
Rankin,Bill.2010.“DCHousing.”OnlineMap.radicalcartography. http://www.radicalcartography.net/DChousing.html.
Smith,Neil.1979.“TowardaTheoryofGentrificationABacktotheCityMovementbyCapital, NotPeople.” Journal of the American Planning Association 45(4):538–48. https://doi.org/10.1080/01944367908977002.
Summers,BrandiThompson.2019.“CapitalReinvestment.”In Black in Place,28–60.The SpatialAestheticsofRaceinaPost-ChocolateCity.UniversityofNorthCarolinaPress. http://www.jstor.org.ezproxy.cul.columbia.edu/stable/10.5149/9781469654034_summers. 7.