SOLUTIONS MANUAL
CHAPTER 2: DESIGN LOADS AND STRUCTURAL FRAMING
Copyright©2018McGraw-HillEducation.Allrightsreserved. NoreproductionordistributionwithoutthepriorwrittenconsentofMcGraw-HillEducation.
2-1
Fundamentals of Structural Analysis 5th Edition Leet Solutions Manual Visit TestBankDeal.com to get complete for all chapters
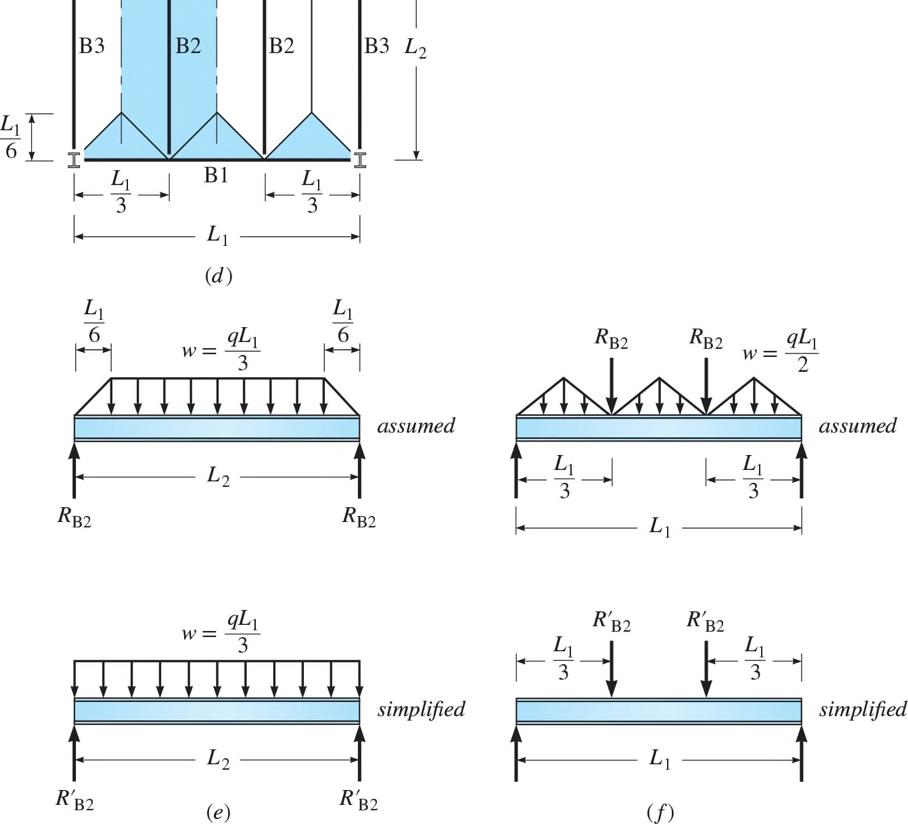
P2.1. Determine the deadweight of a 1-ft-long segment of the prestressed, reinforced concrete tee-beam whose cross section is shown in Figure P2.1. Beam is constructed with lightweight concrete which weighs 120 lbs/ft3.
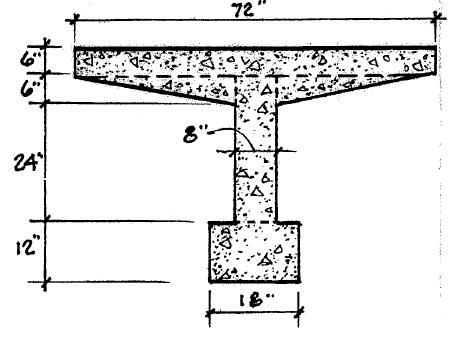
Compute the weight/ft. of cross section @ 120 lb/ft3
Compute cross sectional area:
Weight of member per foot length: 23 wt/ft7.5ft120lb/ft900 lb/ft.
Copyright©2018McGraw-HillEducation.Allrightsreserved. NoreproductionordistributionwithoutthepriorwrittenconsentofMcGraw-HillEducation.
2-2
() ()() 2 1 Area0.5620.52.670.672.51.51 2 7.5ft æö ÷ ç ¢¢¢¢¢¢¢¢ =´+´´+´+´ ÷ ç ÷ ç ÷ èø =
=´=
18ʺ Section 24ʺ 12ʺ 6ʺ 6ʺ 48ʺ 72ʺ 8ʺ P2.1
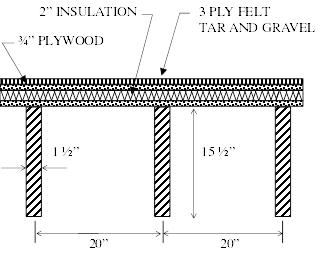
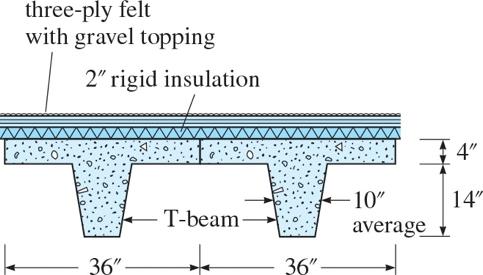
P2.2. Determine the deadweight of a 1-ft-long segment of a typical 20-in-wide unit of a roof supported on a nominal 2 × 16 in. southern pine beam (the actual dimensions are 1 2 in. smaller). The 3 4 -in. plywood weighs 3 lb/ft2.
Copyright©2018McGraw-HillEducation.Allrightsreserved. NoreproductionordistributionwithoutthepriorwrittenconsentofMcGraw-HillEducation.
2-3
See Table 2.1 for weights () 323 wt / 20 unit 20 Plywood: 3 psf15 lb 12 20 Insulation: 3 psf15 lb 12 209.17 lb Roof’g Tar & G: 5.5 psf11219.17 lb 1.515.515.97 lb lb Wood Joist37 ft14.4in/ft Total wt of 20 unit19 ¢¢ ¢¢ ¢ ´´= ¢¢ ¢ ´´= ¢¢ ¢ ´´= ¢¢ ¢¢¢ ´´= = ¢¢ = .17 + 5.97 25.14 lb. Ans. =
20ʺ20ʺ 2ʺ insulation three ply felt tar and gravel 3/4ʺ plywood 15 1/2ʺ 1 1/2ʺ Section P2.2
P2.3. A wide flange steel beam shown in Figure P2.3 supports a permanent concrete masonry wall, floor slab, architectural finishes, mechanical and electrical systems. Determine the uniform dead load in kips per linear foot acting on the beam.
The wall is 9.5-ft high, non-load bearing and laterally braced at the top to upper floor framing (not shown). The wall consists of 8-in. lightweight reinforced concrete masonry units with an average weight of 90 psf. The composite concrete floor slab construction spans over simply supported steel beams, with a tributary width of 10 ft, and weighs 50 psf.
The estimated uniform dead load for structural steel framing, fireproofing, architectural features, floor finish, and ceiling tiles equals 24 psf, and for mechanical ducting, piping, and electrical systems equals 6 psf.
Uniform Dead Load WDL Acting on the Wide Flange Beam:
Wall Load: 9.5(0.09ksf)0.855klf
Floor Slab: 10(0.05ksf)0.50klf
Steel Frmg, Fireproof’g, Arch’l Features, Floor Finishes, & Ceiling: 10(0.024ksf)0.24klf
Mech’l, Piping & Electrical Systems: 10(0.006 ks
Total1.66klf DLW = =
f)0.06 klf
wide flange steel beam with fireproofing ceiling tile and suspension hangers Section
Copyright©2018McGraw-HillEducation.Allrightsreserved. NoreproductionordistributionwithoutthepriorwrittenconsentofMcGraw-HillEducation.
2-4
¢
= ¢ = ¢ = ¢
concrete floor slab piping
mechanical
duct
9.5ʹ
8ʺ concrete masonry partition
P2.3
P2.4. Consider the floor plan shown in Figure
P2.4. Compute the tributary areas for (a) floor beam B1, (b) floor beam B2, (c) girder G1, (d) girder G2, (e) corner column C1, and (f ) interior column C
Copyright©2018McGraw-HillEducation.Allrightsreserved. NoreproductionordistributionwithoutthepriorwrittenconsentofMcGraw-HillEducation.
2-5
2 2 20 ft Method 2 88 () Method 1: 403 22 1 32044(4)28 : 8 2 ft TT TT aAA AA 2 2 ft Method 2: 6.67 () Method 1: 2066.7 2 1 66.723.33(3.33)55.6ft 2 TT TT bA A A A 2 2 ft Method 2 6.67 () Method 1: 2010(10) 2 166.7 11 166.723.33(3.33)5(5) 22 180 : . ft 6 2 T T T T A cA A A 2 2 ft Metho 4020 () Method 1: 36 22 1080 1 108024(4 d 2: ) 2 10ft 96 T T T T A dA A A 2 2 ; 4020 () 200 22 4020402 ft 0 (; ) 900 2 f 222 t TT TT eA fA A A
A 40ʹ20ʹ B1 G2 G4 G3 C3C1 C4 C2 G1 B2 B4 6 @ 6.67ʹ = 40ʹ B3 2 @ 10ʹ = 20ʹ 5 @ 8ʹ = 40ʹ 1 23 B C P2.4 5 ft G1 10 ft 5 ft 6.66ft 6.67 ft 6.67 ft G1 10 ft Right Side Left Side 4 ft 4 ft 36ft G2 36 ft G2 B1 4 ft B1 36 ft 4 ft 6.66ft 6.67 ft 6.67 ft B4 AT,C2 AT,C1
P2.5. Refer to Figure P2.4 for the floor plan. Calculate the tributary areas for (a) floor beam B3, (b) floor beam B4, (c) girder G3, (d) girder G4, (e) edge column C3, and (f ) corner column C4.
Copyright©2018McGraw-HillEducation.Allrightsreserved. NoreproductionordistributionwithoutthepriorwrittenconsentofMcGraw-HillEducation.
2-6
2 2 2 0 ft Method 2: () Method 1: 1020 20 1 20 f 045 2 15t 0 T T T T A A a A A 2 2 2 ft Metho () Method 1: d 2: f 6.6720133.4 1 133.443.33 2 111.2t TT T T bA A A A 2 2 2 ft Method 2: () Method 1: 3620 720 1 7202473t 6 2 f TT TT A A cA A 2 2 22 ft Method 2 () Method 1: 44033.33(10) 493.4 11 493.42423.33 22 : 4ft 88.5 T T T T A A dA A 2 2 () 3020600 () 101010 ; ft ; t 0 f TT TT eA fA A A A 40ʹ20ʹ B1 G2 G4 G3 C3C1 C4 C2 G1 B2 B4 6 @ 6.67ʹ = 40ʹ B3 2 @ 10ʹ = 20ʹ 5 @ 8ʹ = 40ʹ 1 23 B C P2.4
B4 B3 5 ft B4 B3 10ft 5 ft 6.66ft 6.67 ft 6.67 ft 3.33 ft G3 33.33 ft G3 33.33 ft Right Side Left Side 4 ft 4 ft 36ft G4 36 ft G4 3.33 ft 4 ft 36 ft 4 ft B4 AT,C3 AT,C4
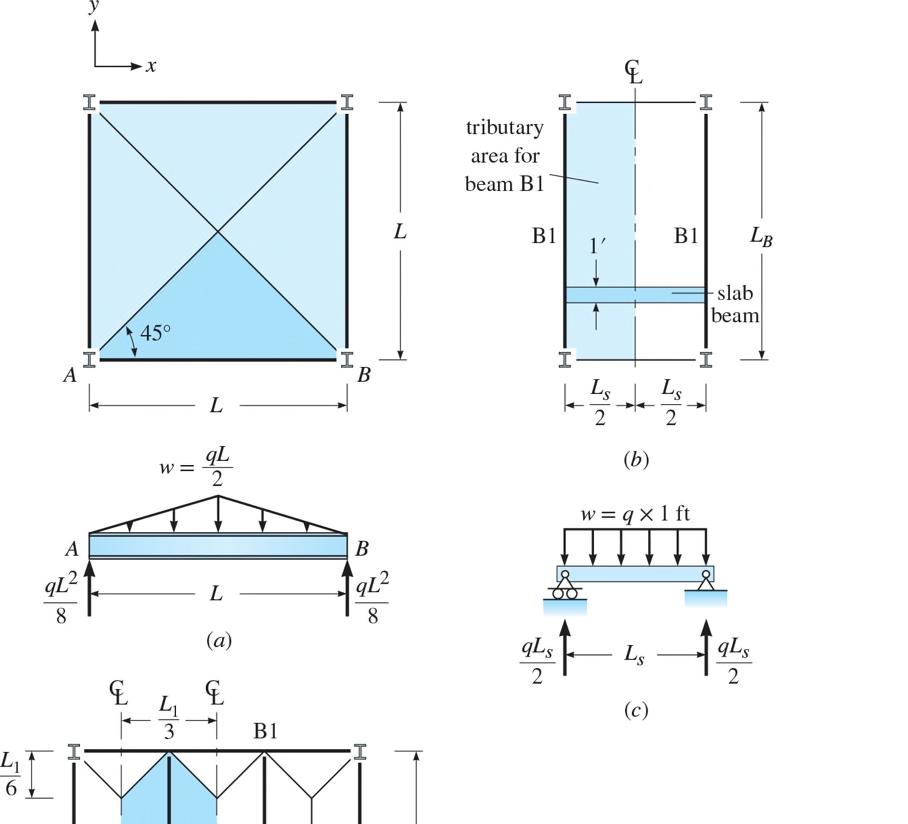
P2.6. The uniformly distributed live load on the floor plan in Figure P2.4 is 60 lb/ft2. Establish the loading for members (a) floor beam B1, (b) floor beam B2, (c) girder G1, and (d) girder G2. Consider the live load reduction if permitted by the ASCE standard.
Copyright©2018McGraw-HillEducation.Allrightsreserved. NoreproductionordistributionwithoutthepriorwrittenconsentofMcGraw-HillEducation.
2-7
2 () 8(40)320 ft, 2, 640400 1560 600.2550.6 psf 2 640 8(50.6)404.8 lb/ft0.40kips/ft , ok TLLTLL aAKAK L w ====> =+=> === æö ÷ ç ÷ ç ÷ ç èø 2 6.67 () (20)66.7 ft, 2, 133.4400, No Reduction 2 6.67 (60)200.1 lb/ft0.20kips/ft 2 TLLTLL bAKAK w ====< === 2 tribbeam 6.67 () (20)10(10)166.7 ft,
Reduction 2 6.67 (60)200.1 lb/ft0.20kips/ft 2 ()() 60(10)(20) 6000 lbs6kips 22 TLLTLL cAKAK w qWL P =+===< === ==== 2 4020 () 361080 ft, 2, 2160400 22 1560 600.2534.4 2 2160 34.4 psf 4020 8(34.4)8256 lbs8.26kips 22 , ok TLLTLL dAKAK L L P =+===> =+=> = =+== æö ÷ ç ÷ ç ÷ ç èø æö ÷ ç ÷ ç ÷ ç èø æö ÷ ç ÷ ç ÷ ç èø A 40ʹ20ʹ B1 G2 G4 G3 C3C1 C4 C2 G1 B2 B4 6 @ 6.67ʹ = 40ʹ B3 2 @ 10ʹ = 20ʹ 5 @ 8ʹ = 40ʹ 1 23 B C P2.4
2, 333.4400, No
w B1 and B2 w P G1 PPPP 5 spaces @ 8’ each G2
P2.7. The uniformly distributed live load on the floor plan in Figure P2.4 is 60 lb/ft2. Establish the loading for members (a) floor beam B3, (b) floor beam B4, (c) girder G3, and girder G4. Consider the live load reduction if permitted by the ASCE standard.
psf
Copyright©2018McGraw-HillEducation.Allrightsreserved. NoreproductionordistributionwithoutthepriorwrittenconsentofMcGraw-HillEducation.
2-8
()
15 600.2560
400
aAKAK L w ====> =+= === æö ÷ ç ÷ ç ÷ ç èø 2 ()
6.67(60)400.2
w
===
()
1560 600.2538.7
2 1440 ()() 38.7(8)(40) 6192
22 TLLTLL cAKAK L qWL P ====> =+= ==== æö ÷ ç ÷ ç ÷ ç èø 2 8 () 4033.33(10)493.3 ft, 2,
2 1560 600.2543.7,
2 986.6 43.7(4)174.8
kips 2 TLLTLL dAKAK L w P =+===> =+=> === === æö ÷ ç ÷ ç ÷ ç èø æö ÷ ç ÷ ç ÷ ç èø A 40ʹ20ʹ B1 G2 G4 G3 C3C1 C4 C2 G1 B2 B4 6 @ 6.67ʹ = 40ʹ B3 2 @ 10ʹ = 20ʹ 5 @ 8ʹ = 40ʹ 1 23 B C P2.4
2
10(20)200 ft, 2, 400400
10(60)600 lb/ft0.60kips/ft TLLTLL
6.67(20)133.4 ft, 2, 266.8400, No Reduction
lb/ft0.40kips/ft TLLTLL bAKAK
====<
2 tribbeam
36(20)720 ft, 2, 1440400
psf > , ok
lbs6.19 kips
986.6400
ok
lb/ft0.17kips/ft 43.7(6.67(20) 2914.8 lbs2.91
w B3 and B4 PPPP 5 spaces @ 8’ each G3 PPPP 6 spaces @ 6.67’ each P w G4
P2.8. The building section associated with the floor plan in Figure P2.4 is shown in Figure
P2.8. Assume a live load of 60 lb/ft2 on all three floors. Calculate the axial forces produced by the live load in column C1 in the third and first stories. Consider any live load reduction if permitted by the ASCE standard.
Copyright©2018McGraw-HillEducation.Allrightsreserved. NoreproductionordistributionwithoutthepriorwrittenconsentofMcGraw-HillEducation.
2-9
2 3rd 1st 40204020 () 900 ft, 4, 3600400 2222 1560 600.2530 psfok (minimum permitted) 2 3600 900(30)27000 lbs27 kips (3)900(30)27000 lbs81 kips , TLLTLL aAKAK L P P =++===> =+== === === æöæö çç÷÷ çç÷÷ çç÷÷ èøèø æö ÷ ç ÷ ç ÷ ÷ ç èø
20ʹ 40ʹ 3 @ 12ʹ = 36ʹ C3C1 Building Section P2.8 P3rd P1st C2 PLAN ELEVATION B4 AT,C2 AT,C1
P2.9. The building section associated with the floor plan in Figure P2.4 is shown in Figure
P2.8. Assume a live load of 60 lb/ft2 on all three floors. Calculate the axial forces produced by the live load in column C3 in the third and first stories. Consider any live load reduction if permitted by the ASCE standard.
Copyright©2018McGraw-HillEducation.Allrightsreserved. NoreproductionordistributionwithoutthepriorwrittenconsentofMcGraw-HillEducation.
2-10
2 3rd 1st 4020 () 20600 ft, 4, 2400400 22 1560 600.2533.4 psf, ok 2 2400 600(33.4)20040 lbs20.0 kips (3)600(33.4)60120 lbs60.1 kips TLLTLL aAKAK L P P =+===> =+== === === æö ÷ ç ÷ ç ÷ ç èø æö ÷ ç ÷ ç ÷ ç èø 20ʹ 40ʹ 3 @ 12ʹ = 36ʹ C3C1 Building Section P2.8
B4 AT,C3 AT,C4 PLAN ELEVATION P3rd P1st C3
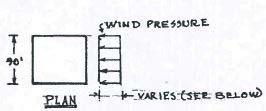
P2.10. A five-story building is shown in Figure P2.10. Following the ASCE standard, the wind pressure along the height on the windward side has been established as shown in Figure P2.10(c). (a) Considering the windward pressure in the east-west direction, use the tributary area concept to compute the resultant wind force at each floor level. (b) Compute the horizontal base shear and the overturning moment of the building.
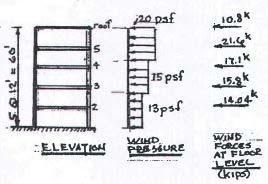
a) Resulant Wind Forces
Roof 20 psf (6 × 90) = 10,800 lb
5th floor 20 psf (12 × 90) = 21,600 lb
4th floor 20 psf (2 × 90) + 15 (10 × 90) = 17,100 lb
3rd floor 15 psf (10 × 90) + 13 (2 × 96) = 15,800 lb
2nd floor 13 psf (12 × 90) = 14,040 lb
b) Horizontal Base Shear VBASE = Σ Forces at Each Level =
10.8k + 21.6k + 17.1k + 15.8k + 14.04k = (a)
VBASE = 79.34k
Overturning Moment of the Building =
10.8k (60′)+ 21.6 (48′) + 17.1 (36′) +
15.8k (24′)+ 14.04k(12′) =
M overturning = 2, 848ft.k
Copyright©2018McGraw-HillEducation.Allrightsreserved. NoreproductionordistributionwithoutthepriorwrittenconsentofMcGraw-HillEducation.
2-11
Σ
(Force @ Ea. Level × Height above Base)
(a) Plan Building Section N (b)(c) A 1 3 @ 20ʹ = 60ʹ 3 @ 30ʹ = 90ʹ 4 @ 25ʹ = 100ʹ 13 wind pressures in lb/ft2 15 20 5 @ 12ʹ = 60ʹ 2 3 4 5 B C D P2.10
P2.11. A mechanical support framing system is shown in Figure P2.11. The framing consists of steel floor grating over steel beams and entirely supported by four tension hangers that are connected to floor framing above it. It supports light machinery with an operating weight of 4000 lbs, centrally located. (a) Determine the impact factor I from the LiveLoadImpact Factor, Table 2.3. (b) Calculate the total live load acting on one hanger due to the machinery and uniform live load of 40 psf around the machine. (c) Calculate the total dead load acting on one hanger. The floor framing dead load is 25 psf. Ignore the weight of the hangers. Lateral bracing is located on all four edges of the mechanical floor framing for stability and transfer of lateral loads.
a) Live Load Impact Factor = 20%
b) Total LL
c) Total DL
Copyright©2018McGraw-HillEducation.Allrightsreserved. NoreproductionordistributionwithoutthepriorwrittenconsentofMcGraw-HillEducation.
2-12
Machinery = 1.20 (4
= 4.8k Uniform LL = ((10′ × 16′) ‒ (5′ × 10′)) (0.04 ksf) = 4.4k Total LL = 9.2k ∴ Total′ LL Acting on One Hanger = 9.2k/4 Hangers = 2.3klps
kips)
Floor Framing = 10′ × 16′ (0.025 ksf) = 4k ∴ Total DL Acting on one Hanger = 4k/4 Hangers = 1 kip ∴ Total DL + LL on One Hanger = 2.3k + lk = 3.3 kips hanger hanger hanger hanger hanger floor grating mechanical support framing vertical lateral bracing beyond floor framing above supports Mechanical Floor Plan (beams not shown) (a) Section (b) edge of mechanical support framing vertical lateral bracing, located on 4 sides of framing (shown dashed) hanger 2.5ʹ 3ʹ3ʹ 10ʹ 2.5ʹ 5ʹ mechanical unit mechanical unit P2.11
P2.12. The dimensions of a 9-m-high warehouse are shown in Figure P2.12. The windward and leeward wind pressure profiles in the long direction of the warehouse are also shown. Establish the wind forces based on the following information: basic wind speed = 40 m/s, wind exposure category = C, Kd = 0.85, K zt = 1.0, G = 0.85, and C p = 0.8 for windward wall and ‒0.2 for leeward wall. Use the K z values listed in Table 2.4. What is the total wind force acting in the long direction of the warehouse?
Use I = 1
2 22 0.613 (Eq. 2.4b) 0.613(40) = 980.8 N/m 980.8(1)()(1)(0.85) = 833.7
4.66.1m:833.7(0.90)750.3N/m
6.1 = 7.6 m: 833.7(0.94) = 783.7 N/m
7.6 = 9 m: 833.7(0.98) = 817.1 N/m
For the Windward Wall = (Eq. 2.7) where = 0.85(0.8) = 0.68 = 0.68
m481.8N/m 4.66.1 m510.2N/m 6.17.6 m532.9N/m 7.69 m555.6N/m
Total Windforce, FW, Windward Wall 481.8[4.6×20] + 510.2[1.5×20] + 532.9[1.5×20] + 555.6[1.4×20]
For Leeward Wall
(0.85)(0.2) at 9m817.1 N/m (above) 817.1 (0.85)(0.2)138.9 N/m
Copyright©2018McGraw-HillEducation.Allrightsreserved. NoreproductionordistributionwithoutthepriorwrittenconsentofMcGraw-HillEducation.
2-13
s zszztd zzz qV qqIKKK qKK = = = = 2 2 2 2
04.6m:833.7(0.85)708.6N/m
q q q q -== -== = =
z z z z
zp
pqGC GC pq 2 2 2 2 04.6
p p p p
p z
-= -= -= -=
W W F F = =
91,180 N
2
hph hz pqGCq qq p ==== =-=-
Windforce, FL, on Leeward Wall * (209)(138.9)25,003 N Total Force 91,180N25,003 116,183.3 N L WL F FF =´-==+ =+ = *Both FL and FN Act in Same Direction.
2
Total
qz GCp qhGCp 40 m 9 m 20 m (not to scale) P2.12
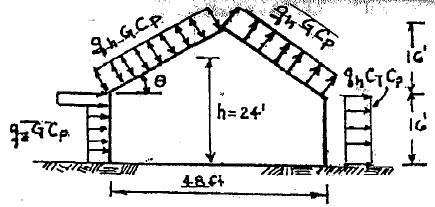
P2.13. The dimensions of an enclosed gabled building are shown in Figure P2.13a. The external pressures for the wind load perpendicular to the ridge of the building are shown in Figure P2.13b. Note that the wind pressure can act toward or away from the windward roof surface. For the particular building dimensions given, the C p value for the roof based on the ASCE standard can be determined from Table P2.13, where plus and minus signs signify pressures acting toward and away from the surfaces, respectively. Where two values of C p are listed, this indicates that the windward roof slope is subjected to either positive or negative pressure, and the roof structure should be designed for both loading conditions. The ASCE standard permits linear interpolation for the value of the inclined angle of roof ��. But interpolation should only be carried out between values of the same sign. Establish the wind pressures on the building when positive pressure acts on the windward roof. Use the following data: basic wind speed = 100 mi/h, wind exposure category = B, Kd = 0.85, K zt = 1.0, G = 0.85, and C p = 0.8 for windward wall and 0.2 for leeward wall.
Consider Positive Windward Pressure on Roof, i.e. left side. Interpolate in Table P2.10
From Table 2.4 (see p48 of text)
Copyright©2018McGraw-HillEducation.Allrightsreserved. NoreproductionordistributionwithoutthepriorwrittenconsentofMcGraw-HillEducation.
2-14
Angle θ 10 15 20 25 303545≥6010 15 ≥20 C p −0.9 −0.7 −0.4 −0.3 −0.2 −0.2 0.0 0.01θ* −0.5 −0.5 −0.6 0.0 0.2 0.2 0.3 0.4
TABLE P2.13 Roof Pressure Coefficient C p *θ defined in Figure P2.13
WindwardLeeward
24 θæö ¢ ÷ ç == ÷ ç ÷ ç ÷ ¢ èø
Mean Roof Height, h 24 ft
1 16 tan33.69(forTable2.10)
( ) () 33.6930 0.20.1 3530 0.2738(Roofonly) p p C C=+´=
0.57, 015 0.62, 1520 0.66, 2025 0.70, 2530 0.76, 3032 z K ¢ =¢¢ =¢¢ =¢¢ =¢¢ =(b) (a) 48ʹ Section 80ʹ wind 16ʹ 16ʹ h qhGCp qhGCp qzGCp qhGCp θ P2.13
P2.13. Continued 2 22
1.0, 0.85, 1
0.00256 (Eq 2.4a) 0.00256(100)25.6 lb/ft
015; 25.6 (1)(0.57)(1)(0.85)
12.40 lb/ft
1516; 13.49 lb/ft 24; 14.36 lb/ft
Wind Pressure on Windward Wall & Roof
Wall 015 12.40×0.85×0.80
8.43 psf
Wall, 151613.49×0.85×0.8 = 9.17 psf
Roof, 14.36×0.85×0.2738
3.34 psf
For Wall
Wind Pressure on Leeward Side 2
For 24; 14.36 lb/ft hp hz
PqGC hqq = ¢ ===
C p ‒0.2 for wall 0.6 for roof 2
2 For .44 Wall lb/ft P P = = 2
14.36 (0.85)(0.2)
14.36 (0.85)(0.6)
For Roo ft(upi f lft) P
7.32 lb/
Copyright©2018McGraw-HillEducation.Allrightsreserved. NoreproductionordistributionwithoutthepriorwrittenconsentofMcGraw-HillEducation.
2-15
2 2 2
ztd s s zszztd z z
KKI qV q qqIKKK q q hq === = == = ¢ = = ¢ = == ––
z
PqGC P P = ¢ = = –
zP
P ¢¢ = –
P P = =
==-
P2.14. Establish the wind pressures on the building in Problem P2.13 when the windward roof is subjected to an uplift wind force.
See P2.13 Solution Windward Roof (Negative Pressure)
33.7
Interpolate between 30 and 35 for negative C p value in Table P2.12
0.274
p hp
C pqGC ====-
21.76(0.66) 0.85(0.274)
2
3.34 lb/ft (Suction)
Note: Wind pressures on other 3 surfaces are the same as in P2.13.
2-16
Copyright©2018McGraw-HillEducation.Allrightsreserved. NoreproductionordistributionwithoutthepriorwrittenconsentofMcGraw-HillEducation.
TABLE P2.13 Roof Pressure Coefficient C p
Windward
Angle θ 10 15 20 25 30 35 45 ≥60 10 15 ≥20 C p −0.9 −0.7 −0.4 −0.3 −0.2 −0.2 0.0 0.01θ* −0.5 −0.5 −0.6 0.0 0.2 0.2 0.3 0.4
*θ defined in Figure P2.11
Leeward
(b) (a) 48ʹ Section 80ʹ wind 16ʹ 16ʹ h qhGCp qhGCp qzGCp qhGCp θ P2.13
80ʹ 140ʹ 160ʹ wind 140 mph leeward D C B E F G H A P2.15
zszztd
Eq2.8 0.00256Eq 2.6a 0.00256(140) 50.176 psf; Round to 50.18 psf
ztd I KK = == K z, Read
2
zz zz qK qK = =
(1.15)() 1 (0.85)
49.05
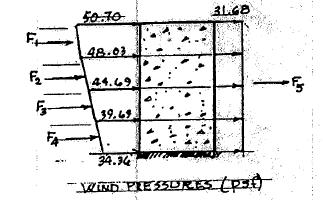
p qz GC p; Use Value of qz at 140 ft. i.c. K z 152 0.549.05(1.52)74.556 74.556 74.556(0.85)(0.5) 31.68 psfANS. pz p Cq pGC p =-== ===Wind Pressure on Side Walls 49.05(1.52)(0.85)(0.7) 44.36 psf zppqGC p ===-
(b) Variation of Wind Pressure on Windward and Leeward Sides
49.05
pkK ==
zz
Elev. (ft) 0 35 70 105 140 p (psf) 34.36 39.69 44.69 48.03 50.70
Copyright©2018McGraw-HillEducation.Allrightsreserved. NoreproductionordistributionwithoutthepriorwrittenconsentofMcGraw-HillEducation.
2-17
s
Elev. (ft) 0 35 70 105 140 K z 1.03 1.19 1.34 1.44 1.52 50.18
(a) Compute Variation of Wind Pressure on Windward Face 49.05
2
s qqIKKK qV q = = = = 1.15
for hospitals 1; 0.85
in Table 2.4
p
C
Compute Wind Pressure “p” on Windward Face
pzpzp qGCKGC== where G 0.85 for natural period less than 1 sec. = 0.8 on windward side
(0.85)(0.8)33.354
Compute “p” for Various Elevations
Compute Wind Pressure on Leeward Wall
P2.15. (a) Determine the wind pressure distribution on the four sides of the 10-story hospital shown in Figure P2.15. The building is located near the Georgia coast where the wind velocity contour map in the ASCE Standard specifies a design wind speed of 140 mph. The building, located on level flat ground, is classified as stiff because its natural period is less than 1 s. On the windward side, evaluate the magnitude of the wind pressure every 35 ft in the vertical direction. (b) Assuming the wind pressure on the windward side varies linearly between the 35-ft intervals, determine the total wind force on the building in the direction of the wind. Include the negative pressure on the leeward side.
P2.15. Continued Compute 1 2 3 4 5
Total 50.748.0235160 276.42kips 21000 48.0344.6935160 259.62k 21000 44.6939.6935160 236.26k 21000 39.6934.3635160 207.39k 21000 31.68140160 709.63k 1000
+´éù êú == êú ëû +´éù êú == êú ëû +´éù êú == êú ëû +´éù êú == êú ëû ´ == 12345 TotalWindForceΣ 1689.27kips FFFFF =++++ =
F F F F F
2-18
Copyright©2018McGraw-HillEducation.Allrightsreserved. NoreproductionordistributionwithoutthepriorwrittenconsentofMcGraw-HillEducation. Wind Force (kips) ()
P2.16. Consider the five-story building shown in Figure P2.10. The average weights of the floor and roof are 90 lb/ft2 and 70 lb/ft2, respectively. The values of SDS and SD1 are equal to 0.9g and 0.4g, respectively. Since steel moment frames are used in the north-south direction to resist the seismic forces, the value of R equals 8. Compute the seismic base shear V. Then distribute the base shear along the height of the building.
Copyright©2018McGraw-HillEducation.Allrightsreserved. NoreproductionordistributionwithoutthepriorwrittenconsentofMcGraw-HillEducation.
2-19
Fundamental Period 4/4 3/4 22 [0.035 for steel moment frames] 0.035(60) 0.75 sec. 4(10090) 90 lb/ft(10090) 70 lb/ft 3,870,000 lbs3,870 kips n tt TChC T T W == = = =´+´ == () 1 max 1forofficebldgs. (/) 0.43870 258kips 0.75(8/1) 0.9(3870) /8/1 435kips D DS SW VI TRI V SW V RI == == == = min 0.0441 0.0441 (1)(0.9)(3870) 153.6 kips DS VISW = = = Therefore, Use 258 kips V = I0.5 11.125 2 k=+= 1 k xx xnk iii Wh FV Wh = = å (a) Plan Building Section N (b)(c) A 1 3 @ 20ʹ = 60ʹ 3 @ 30ʹ = 90ʹ 4 @ 25ʹ = 100ʹ 13 wind pressures in lb/ft2 15 20 5 @ 12ʹ = 60ʹ 2 3 4 5 B C D P2.10
Copyright©2018McGraw-HillEducation.Allrightsreserved. NoreproductionordistributionwithoutthepriorwrittenconsentofMcGraw-HillEducation.
2-20
P2.16. Continued Forces at Each Floor Level Floor Weight Wi, (kips) Floor Height hi (ft) k iiWh Σ k xx k ii Wh WhFx (kips) Roof 630 60 63,061 0.295 76.1 5th 810 48 63,079 0.295 76.1 4th 810 3645,6380.213 56.0 3rd 810 2428,9220.135 34.8 2nd 810 12 13,261 0.062 16.0 3,870 213,961 258
P2.17. When a moment frame does not exceed 12 stories in height and the story height is at least 10 ft, the ASCE standard provides a simpler expression to compute the approximate fundamental period:
T = 0.1N
where N number of stories. Recompute T with the above expression and compare it with that obtained from Problem P2.16. Which method produces a larger seismic base shear?
ASCE Approximate Fundamental Period:
The simpler approximate method produces a larger value of base shear.
Copyright©2018McGraw-HillEducation.Allrightsreserved. NoreproductionordistributionwithoutthepriorwrittenconsentofMcGraw-HillEducation.
2-21
0.1 50.5seconds 0.36750 810kips 0.5(5/1) TN NT V = =\= ´ ==
P2.18. (a) A two-story hospital facility shown in Figure P2.18 is being designed in New York with a basic wind speed of 90 mi/h and wind exposure D. The importance factor I is 1.15 and K z 1.0. Use the simplified procedure to determine the design wind load, base shear, and building overturning moment. (b) Use the equivalent lateral force procedure to determine the seismic base shear and overturning moment. The facility, with an average weight of 90 lb/ft2 for both the floor and roof, is to be designed for the following seismic factors: SDS 0.27g and SD1 0.06g; reinforced concrete frames with an R value of 8 are to be used. The importance factor I is 1.5. (c) Do wind forces or seismic forces govern the strength design of the building?
(a) Wind Loads Using Simplified Procedure:
Table 2.8, Mean Roof Height 30ʹ
Copyright©2018McGraw-HillEducation.Allrightsreserved. NoreproductionordistributionwithoutthepriorwrittenconsentofMcGraw-HillEducation.
2-22
Design Wind Pressure P s K zt IPS30 1.66
303030 Zones1.66(1)1.151.909
psf24.44
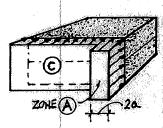
C8.5 psf16.22 psf SSSS PPPP == Resultant Force at Each Level; Where Distance a 0.1(100) 10; 0.4(30) 12 ; 3 10Controls & 2a20RegioAn() a ¢¢ == ( ) () roof roof 1520 ()24.44psf3.67 21000 1580 ()16.3psf9.78 21000 : ZoneA: ZoneC: Resultant13.45 k k k F F ¢¢ = = ¢¢ = ( ) () 2nd k 2nd : Zone A: ZoneC: 20 ()1524.44psf7.33 1000 80 ()1516.3psf19.5 Resul 6 1000 tant = 26.89 k k F F ¢ ¢ = ¢ ¢ = base roof2nd Base Sheak = + = 40.34 VFFk O.T. O.T. Overturning Moment = Σ = 13.4530+ 26.8915 () ()= 806.9 ii kkftk MFh M ¢¢
A12.8
psf
15ʹ 15ʹ 100ʹ 100ʹ P2.18
P2.18. Continued
(b) Seismic Loads by Equivalent Lateral Force Procedure Given:
(c) Seismic Forces Govern the Lateral Strength Design.
Copyright©2018McGraw-HillEducation.Allrightsreserved. NoreproductionordistributionwithoutthepriorwrittenconsentofMcGraw-HillEducation.
2-23
W
& Roof; SDS 0.27g, SD1 0.06g; R = 8, I 1.5 ( ) 1 base BaseShear R/I D SW V T = Where W Total Building Dead Load 2 roof 2 2nd total 90 psf 100900 90 psf 100 () ()900 1800 k k k W W W ¢ == ¢ == = And= =
sec. x TnTCh 0.016 Reinf. Concrete Frame 0.9 Reinf. Concrete Frame 30Building Height TC X h = = ¢ = ( )
base max. min. 0.061800 59.2 0.033 Controls 0.342sec8/1.5 0.271800 0.05191.1 R/I(8/1.5) 0.0440.0440.271.51800 0.017832.1 kk k DSk k DS k VW SW VW VSIW W === ==== == == basebase,Where59.2 Σ Force @ Each Level k Xxk Xk ii Wh FVV Wh == T < 0.5 Sec. Thus K 1.0 Level WiHi k ii Whkk xxii WhWh Force @ Ea. Level: Roof 900k 30 27000 0.667 Froof 39.5k 2nd 900k 15 13500 0.333 F2nd 19.76k base Σ= 40500 Σ = = 59.2 kk iix WhFV O.T. Overturning Moment Σ xiMFh = O.T. = 39.53019.()()76151,481.4 ft kk Mk ¢¢+=⋅
90 psf Floor
0.342
()() () ()()()
P2.19. In the gabled roof structure shown in Figure P2.13, determine the sloped roof snow load P s. The building is heated and is located in a windy area in Boston. Its roof consists of asphalt shingles. The building is used for a manufacturing facility, placing it in a type II occupancy category. Determine the roof slope factor, C s using the ASCE graph shown in Figure P2.19. If roof trusses are spaced at 16 ft on center, what is the uniform snow load along a truss?
with obstructions or non-slippery surfaces
unobstructed slippery surfaces with thermal resistance, R ≥ 30°F·h·ft2/Btu
(5.3°C·m2/W) for unventilated roofs or R ≥ 20°F·h·ft2/Btu
(3.5°C·m2/W) for ventilated roofs
warm
From Fig. P2.17 C s is Approximately 0.9 (Non-Slippery Surface)
)( )( )( )
0.7 0.71.01.040 psf19.6 psf
19.6 psf17.64 psf
Uniform Load Acting on Trusses Spaced @ 16 o.c.
17.64 psf 16282. plf ()2
Copyright©2018McGraw-HillEducation.Allrightsreserved. NoreproductionordistributionwithoutthepriorwrittenconsentofMcGraw-HillEducation.
2-24
Sloped Roof Snow Load PS CSpf Where pf Flat Roof Snow Load pf 0.7 C e Ct Ipg 1 0.7 Windy Area 1.0 Heated Building 1.0 Type II Occupancy 40 psf for Boston Based on Roo 16 Tan f Slope33.7 24 s Ce Ct I Pg Cθæö ¢ ÷ ç == ÷ ç ÷ ç ÷ ¢ èø = = = = =
( )
0.9
f sss P PCP == ===
snow
W
==
(
¢
roofs
Roof Slope Cs 0 0 0.2 0.4 0.6 0.8 5° 1.0 30°60°90°
1.0 P2.19 (b) Section h qhGCp qhGCp qzGCp qhGCp θ P2.13
Roof slope factor Cs with
roofs and Ct ≤
P2.20. A beam that is part of a rigid frame has end moments and mid-span moments for dead, live, and earth-quake loads shown below. Determine the governing load combination for both negative and positive moments at the ends and mid-span of the beam. Earthquake load can act in either direction, generating both negative and positive moments in the beam.
Copyright©2018McGraw-HillEducation.Allrightsreserved. NoreproductionordistributionwithoutthepriorwrittenconsentofMcGraw-HillEducation.
2-25
Load Combinations-Factored Strength End Moments ( ) ()O 1.41.4180ftk252ftk 1.21.60.5or R DL DLLLLS =-⋅=-⋅ ++ ()() () * O 1.21801.6150456ftk 1.21.00.2DLELLS =-+-=-⋅ ++ ()()() 1.218080150446ftk =-+-+-=-⋅ Mid-Span Moments ( ) () ()() () O * 1.41.490ftk126ftk 1.21.60.5or1.2901.6150348ftk 1.21.00.2 R DL DLLLLS DLELLS =+⋅=+⋅ ++=+++=+⋅ ++ ()() O 1.2900150258ftk =++=+⋅ Beam Needs to be Designed for Max. End Moment 456 ft k Max. Mid-Span Moment 348 ft k
End Moments (ft-kip) Mid-Span Moments (ft-kip) Dead Load 180 90 Live Load 150 150 Earthquake 80 0
P2.21. Calculate the vertical hydrostatic load on the 5100-lb empty shipping container in Figure P2.19 subjected to a tsunami inundation height of 3ʹ. Assuming the container is water-tight, will the tsunami wave be capable of carrying away the container as debris?
γ70.4(3)(8)(20)
33792 lbs
33.8 kips
33.8 kips 5.1 kips
s container
Yes, the container will be carried away.
Copyright©2018McGraw-HillEducation.Allrightsreserved. NoreproductionordistributionwithoutthepriorwrittenconsentofMcGraw-HillEducation.
2-26
VW V V FV F F W == = = >=
8ʹ 20ʹ 8.6ʹ P2.21
P2.22. Consider the building in Figure P2.22, which has a width into the page of 35 ft. Maximum inundation height, hmax, and flow velocity, umax, have been determined as 33 ft and 20 ft/sec, respectively. Calculate the hydrodynamic and hydrostatic resultant load and location on the walls ABCandIJKL for Load Cases 2 and 3, due to both inflow and outflow directions. If windows are inundated, calculate the expected hydrostatic loading on the adjacent outside walls due to water retained by the floor, or floors. Finally, calculate the debris impact load to be applied to the free-standing column CD. Assume I tsu = 1.0 and Cd = 1.25.
Copyright©2018McGraw-HillEducation.Allrightsreserved. NoreproductionordistributionwithoutthepriorwrittenconsentofMcGraw-HillEducation.
2-27
max max Load Case 2: 2 22 ft 3 20ft/sec des des hh uu == == Hydrodynamic, Load Case 2 Hydrodynamic, Load Case 3 Hydrostatic on interior walls 1122 γ70.4(35)3 22 11.1 kips hsdes h Fbh F == = Debris Impact on CD 330330(0.65)(1.0)
kips iotsu h FCI F == =
214.5
30ʹ 16ʹ 16ʹ 16ʹ 30ʹ 3ʹ A B C D E F G H I J K L OPEN IN Flow OUT Flow P2.22 K 6 ft FdK J 3 ft Load Case 2 8 ft 8 ft K 8 ft FdK J 3 ft Load Case 3 1 ft 8 ft 8 ft 8 ft FdJ FhK J 3 ft Hydrostatic on inside walls 33 ft 2 2 Trib height8614ft 1 γ()()()()()(20) 2 1 70.4(1.0)(1.25)(1.0)(35)(14)(20) 2 8624 kips desK dKstsudcxdesK dK dK h FICCBh F F ==+= = = = 2 , 2 Trib height189ft 1 70.4(1.0)(1.25)(1.0)(35)(9)(6.67) 2 616 kips Trib height8816ft 1 70.4(1.0)(1.25)(1.0)(35)(16)(6.67) 2 1096.2 kips desJ dJ dJ desK dK dK h F F h F F ==+= = = ==+= = = max max Load Case 3: 33 ft 1 6.67ft/sec 3 des des hh uu == ==
Design Loads and Structural Framing


Chapter 2

1 Copyright © McGraw-Hill Education.All rights reserved. No reproduction or distribution without the prior written consent of McGraw-Hill Education.
2 Copyright © McGraw-Hill Education.All rights reserved. No reproduction or distribution without the prior written consent of McGraw-Hill Education. Chapter Opener
3 Copyright © McGraw-Hill Education.All rights reserved. No reproduction or distribution without the prior written consent of McGraw-Hill Education. Figure 2.1
4 Copyright © McGraw-Hill Education.All rights reserved. No reproduction or distribution without the prior written consent of McGraw-Hill Education. Figure 2.2
5 Copyright © McGraw-Hill Education.All rights reserved. No reproduction or distribution without the prior written consent of McGraw-Hill Education. Figure 2.3
6 Copyright © McGraw-Hill Education.All rights reserved. No reproduction or distribution without the prior written consent of McGraw-Hill Education. Figure 2.4
7 Copyright © McGraw-Hill Education.All rights reserved. No reproduction or distribution without the prior written consent of McGraw-Hill Education. Figure 2.5
8 Copyright © McGraw-Hill Education.All rights reserved. No reproduction or distribution without the prior written consent of McGraw-Hill Education. Figure 2.5(Continued)
9 Copyright © McGraw-Hill Education.All rights reserved. No reproduction or distribution without the prior written consent of McGraw-Hill Education. Figure 2.6
10 Copyright © McGraw-Hill Education.All rights reserved. No reproduction or distribution without the prior written consent of McGraw-Hill Education. Figure 2.7
11 Copyright © McGraw-Hill Education.All rights reserved. No reproduction or distribution without the prior written consent of McGraw-Hill Education. Figure 2.8
12 Copyright © McGraw-Hill Education.All rights reserved. No reproduction or distribution without the prior written consent of McGraw-Hill Education. Figure 2.9
13 Copyright © McGraw-Hill Education.All rights reserved. No reproduction or distribution without the prior written consent of McGraw-Hill Education. Photo 2.1
14 Copyright © McGraw-Hill Education.All rights reserved. No reproduction or distribution without the prior written consent of McGraw-Hill Education. Figure 2.10
15 Copyright © McGraw-Hill Education.All rights reserved. No reproduction or distribution without the prior written consent of McGraw-Hill Education. Figure 2.11
16 Copyright © McGraw-Hill Education.All rights reserved. No reproduction or distribution without the prior written consent of McGraw-Hill Education. Figure 2.12
17 Copyright © McGraw-Hill Education.All rights reserved. No reproduction or distribution without the prior written consent of McGraw-Hill Education. Figure 2.13

