What is the InBody Test?
Ever wondered what your weight truly represents? When you step on a traditional scale, all you see is a number—there's no insight into how much of that weight is muscle, fat, or water.
The InBody Test goes beyond the basics, offering a non-invasive, quick, and accurate body composition analysis. This test provides a detailed breakdown of your body’s composition, giving you a clear understanding of your muscle, fat, and water distribution. In just 15-120 seconds, depending on the model, you’ll receive an easy-to-read InBody Result Sheet. No more guesswork or outdated methods like pinching or dunking. With the InBody Test, you get reliable results that help you set precise, actionable health and fitness goals.

Part 1: Body Water and Body Composition Analysis
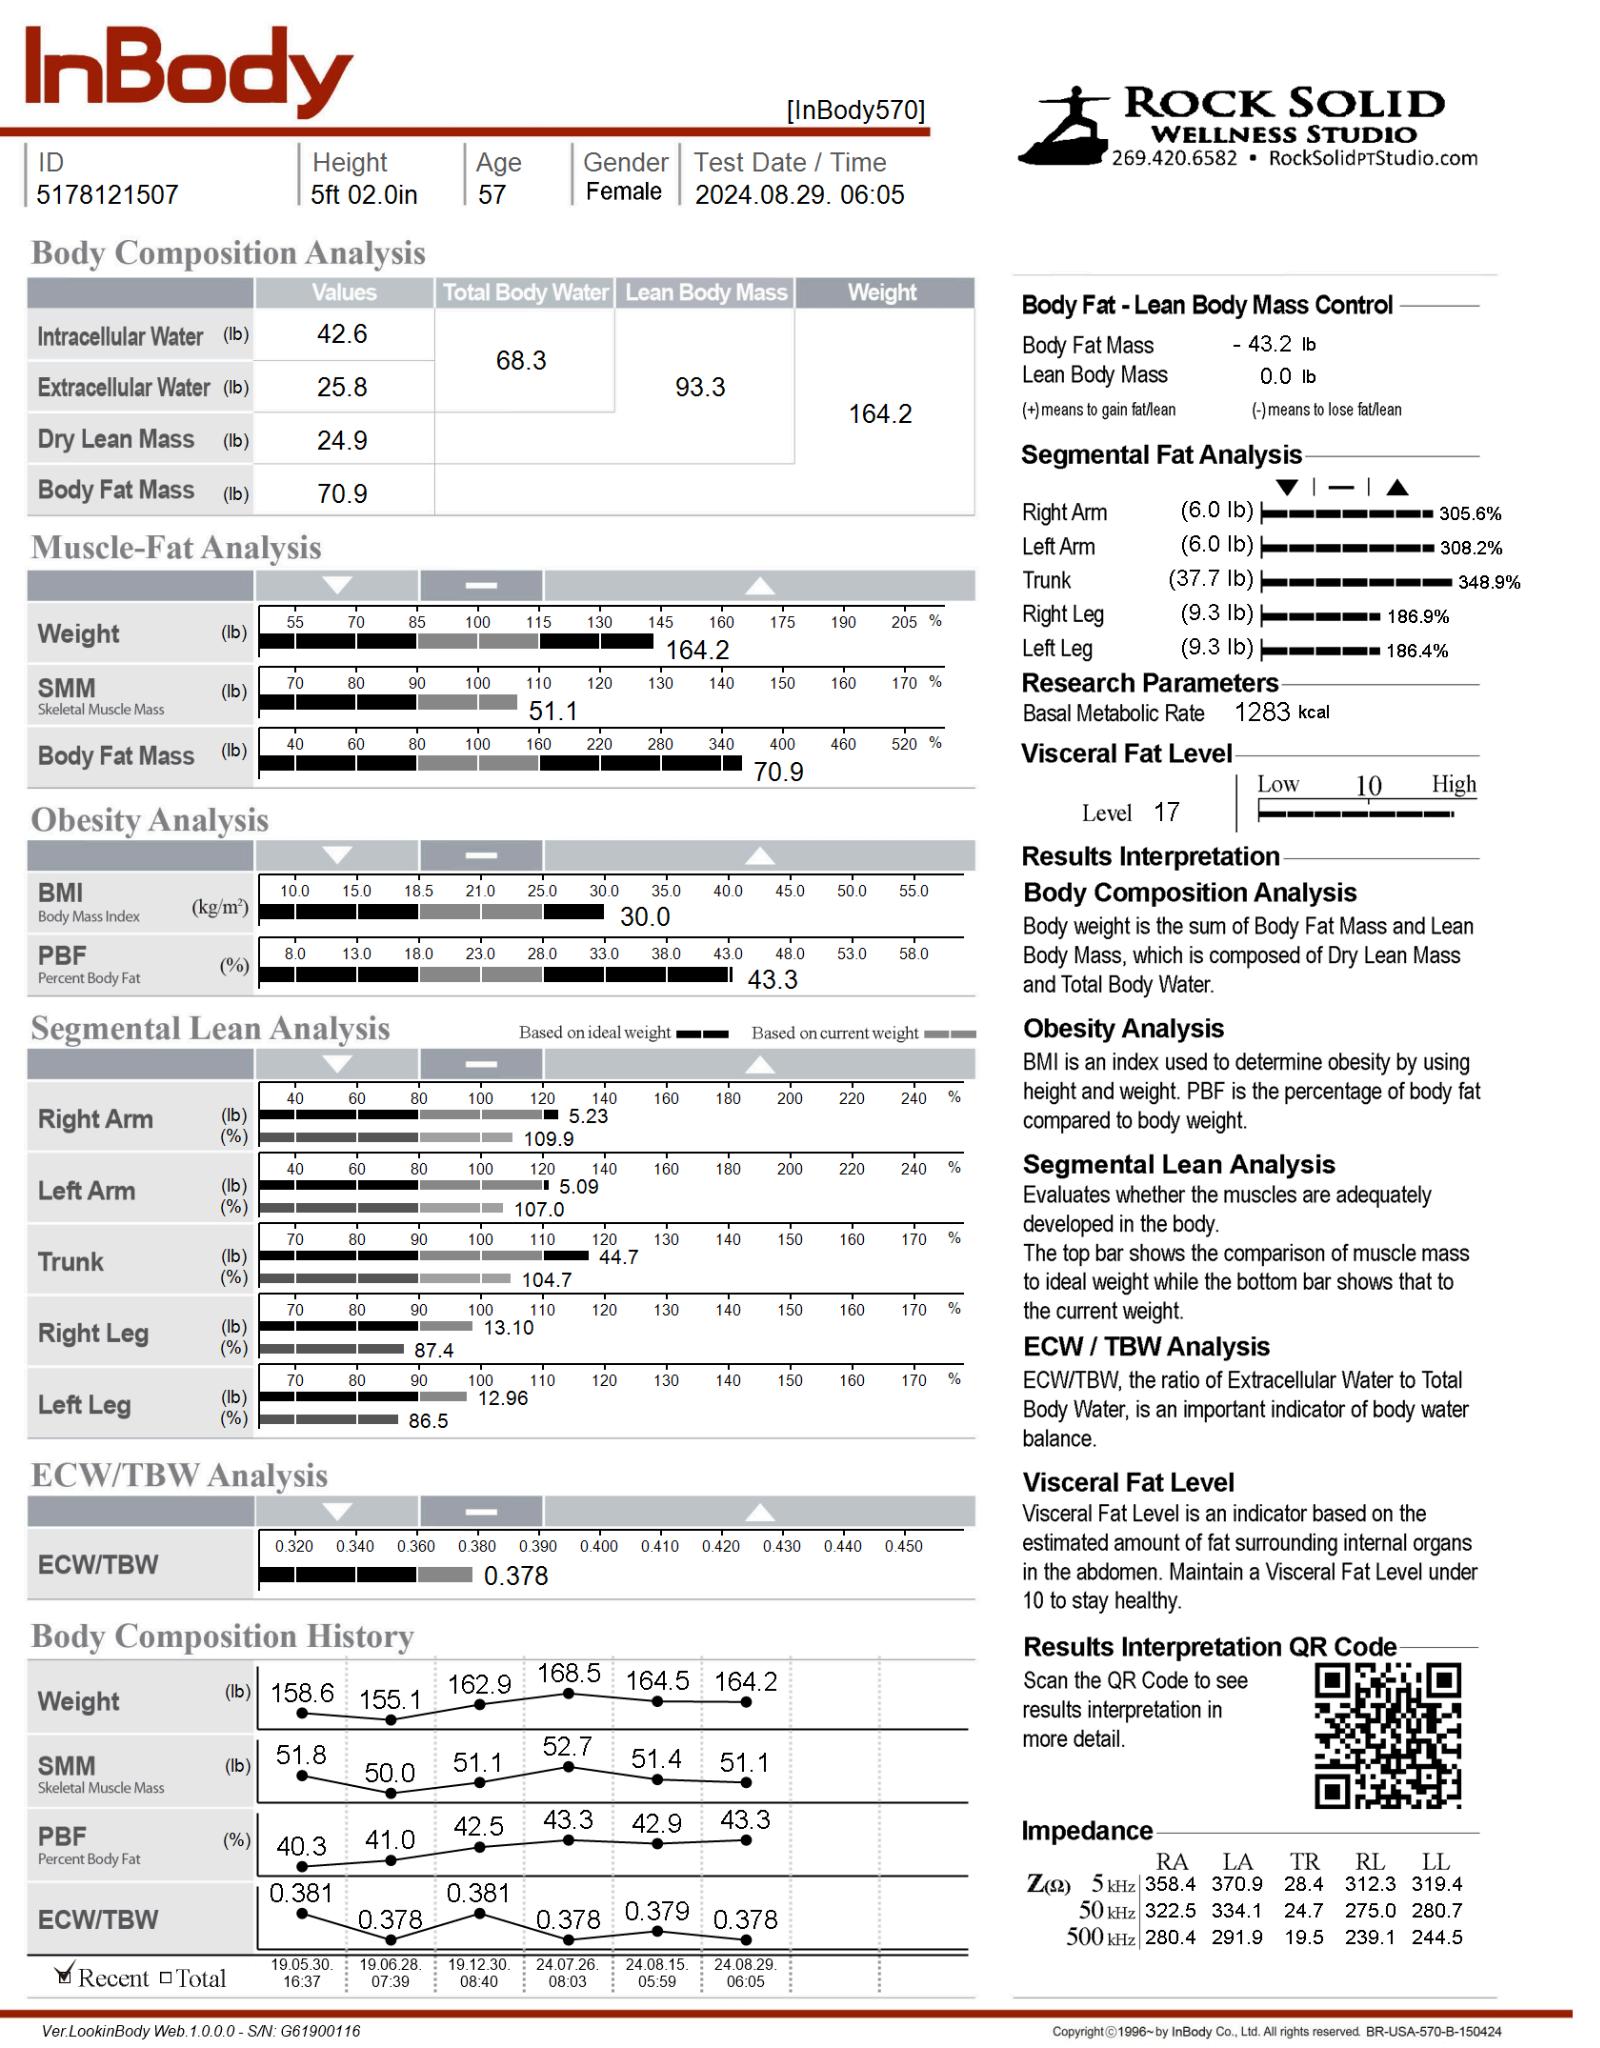
This section provides a clear and comprehensive breakdown of your overall body composition, presenting key measurements in pounds (lb), including:
● Total Body Water (further divided into Intracellular and Extracellular Water)
● Lean Body Mass
● Dry Lean Mass
● Body Fat Mass
● Total Weight
Let’s dive into how you can interpret these measurements to assess muscle gain or identify potential fluid imbalances.

Intracellular and Extracellular Water
At the top, you'll find Intracellular Water (the water inside your cells) and Extracellular Water (the water outside your cells), which together constitute your Total Body Water
While both ICW and ECW are important, keeping an eye on Extracellular Water (ECW) can offer significant insights. An increase in ECW without a corresponding rise in ICW might indicate acute inflammation. Conversely, a decrease in ICW often suggests muscle loss. Monitoring these changes can help you better understand your body's condition.
Dry Lean Mass
This value represents the weight of the protein and mineral content in your body.
Since protein constitutes the majority of your muscle, and Dry Lean Mass excludes body water, an increase in Dry Lean Mass typically indicates that you’ve gained muscle
Body Fat Mass
Below Dry Lean Mass, you'll find the Body Fat Mass value, which indicates the amount of body fat in your body, including both surface-level fat (subcutaneous) and internal fat (visceral).
Lean Body Mass (LBM)
Displayed in the second column from the right, Lean Body Mass (LBM) is the total of your Intracellular Water (ICW), Extracellular Water (ECW), and Dry Lean Mass. LBM represents the weight of everything in your body except fat, which is why it’s also referred to as Fat-Free Mass. This includes muscle, water, bones, and organs.
Increases in LBM typically indicate muscle growth, which you can also observe as an increase in Dry Lean Mass, signaling an improvement in body composition. However, it’s important to note that individuals who do not maintain normal body water ratios may
experience an increase in LBM due to swelling from strenuous exercise or activity, rather than muscle gain.
ECW/TBW Analysis.

The ECW/TBW ratio measures the distribution of fluid between compartments in your body, indicating how much of your total body water is extracellular.
Regularly taking InBody Tests will help you establish your normal fluid status and identify any imbalances. As a general guideline, aim for an ECW/TBW ratio below 0.390.
While minor fluctuations in your ECW/TBW ratio are normal, this measurement is primarily useful for providing context in the Segmental Lean Analysis. The graph helps you quickly identify if your body is experiencing occasional inflammation or swelling due to strenuous exercise or activity It also offers additional context for interpreting Lean Body Mass (LBM). A high LBM combined with a high ECW/TBW ratio typically indicates excess body water, not just muscle mass.
Part 2: Muscle, Fat, & Obesity Risk
Muscle-Fat Analysis
This section compares your Weight, Skeletal Muscle Mass, and Body Fat Mass to the healthy average range for individuals of the same height and sex. The Muscle-Fat Analysis offers valuable insights into your current body composition, helping you identify areas for improvement to reach your desired body composition goals.
Muscle-Fat Analysis is a popular feature because it provides a clear, easy-to-understand overview of body composition, allowing you to focus on specific health and fitness objectives.

Muscle-Fat Analysis Components
WEIGHT:
This represents your Total Body Weight.
SKELETAL MUSCLE MASS (SMM):
This is the total weight of your skeletal muscle, which can be developed and increased through exercise. Unlike Lean Body Mass, which includes everything except body fat, an increase in SMM directly indicates muscle gain.
BODY FAT MASS:
This shows the total amount of body fat in your body, including both surface-level (subcutaneous) and internal (visceral) fat.
The Muscle-Fat Analysis also helps you determine if you have a healthy balance of Skeletal Muscle Mass and Body Fat Mass in relation to your weight.
Muscle, Fat, & Obesity Risk: How to Interpret the Numbers
You can compare your measurements to the healthy averages for individuals of the same height and sex using the percentages above the bar graphs. The 100% mark represents the healthy average for your height and sex. For example, if your Weight bar is at 130%, it means your weight is 30% above the average. Conversely, if your Weight bar is at 70%, it indicates that your weight is 30% below the healthy average for your height.
Obesity Analysis
This section presents your body fat percentage, known as Percent Body Fat (PBF), and your Body Mass Index (BMI), along with the healthy ranges for each measurement.
Understanding Obesity Analysis
Obesity Analysis offers valuable insights into your current obesity level and associated health risks.
Body fat percentage (PBF) is calculated by dividing your body fat mass by your total weight, making it a more accurate indicator of obesity risk than BMI. Let’s delve into why PBF is a more reliable metric for assessing your obesity and overall health risks.

Why You Should Focus on Body Fat Percentage Over BMI
BMI is calculated by dividing your weight by your height squared, resulting in a single value that doesn’t distinguish between fat and muscle mass. If you rely on BMI to track your fitness progress, you won’t know whether changes in your weight are due to fat loss or muscle gain.
BMI also tends to oversimplify health risks. For example, two individuals with the same height and weight will have the same BMI and, according to BMI, the same health risks—even if one person has a healthy amount of fat and high muscle mass, while the other has a higher fat percentage.
In contrast, Percent Body Fat (PBF) provides a clearer picture by indicating how much of your weight is fat mass. By tracking your PBF, you can focus on reducing actual fat, rather than just weight, which could include muscle loss.
Healthy Ranges for BMI and PBF
● BMI: According to the World Health Organization, a healthy BMI range is 18.5–24.99 kg/m². This range is typically displayed on your InBody Result Sheet, although the device can be programmed to use a different range if needed.
● PBF: Healthy body fat percentage ranges differ for men and women, as women generally have more body fat due to reproductive factors and genetics. InBody calculates the recommended ranges as follows:
○ For men: 10-20%
○ For women: 18-28%
Body Composition History
This graph showcases some of the most critical measurements from your previous tests (up to 8), allowing you to easily identify trends and monitor your progress over time.
Located at the bottom of the Result Sheet, the Body Composition History graph automatically tracks your Weight, Skeletal Muscle Mass, Percent Body Fat, and ECW/TBW ratios from recent tests.

Purpose of the Body Composition History Graph
This graph is designed to help you monitor both positive and negative changes in your body composition, enabling you to adjust your diet and exercise plan to achieve your desired results.
Tracking Positive Changes
The Body Composition History graph allows you to easily identify when positive changes occur For example, if you notice a gradual increase in Skeletal Muscle Mass and a decrease in Body Fat Mass over your last few tests, it’s a strong indication that you’re making excellent progress toward improving your overall body composition.