2022 ESGReport

ENVIRONMENTAL | SOCIAL | GOVERNANCE

2 | ROCKBRIDGE

2022 ESG REPORT | 3

4 | ROCKBRIDGE
We reject the notion that strong ESG practices come at the expense of financial performance.
A Message from our CEO
At Rockbridge, we have always believed in making a lasting difference in everything we do. That belief is reflected in our long-standing commitment to conduct business responsibly, invest in our team, and give back to our communities and the world around us. This way of working is at the heart of how we do business at Rockbridge. Though we haven’t formally classified these efforts as ESG practices in the past, the spirit of ESG has been present here for years through our culture of leading by example and continuously improving our business.
By establishing an ESG team and platform in 2021, we formalized our commitment to ESG progress. Our platform will not only elevate the good work already being done across the organization, but also provide opportunities to take our ESG performance to the next level. I am pleased to share this report, which provides a performance baseline that will shape our ongoing efforts.
Some in our industry believe that environmental sustainability or strong compliance practices come at the expense of financial performance. We strongly reject this notion. We do not view ESG factors as a balancing act between responsible operations and financial performance, but instead as a mutually beneficial relationship. At Rockbridge, we are committed to maximizing impact while delivering strong returns. We believe that an ESG platform grounded in curiosity and transparency is not only the right thing to do, but that it will also unlock value throughout our portfolio and enhance our investments.
In our firm’s 22-year history, we’ve seen how our commitments can produce incredible impact, both locally and globally. This motivates and drives us. We are proud of what we’ve achieved to date and know that our passion for continuous improvement will create additional positive outcomes going forward. Thank you for your continued support as we seize new opportunities to create value for our investors, for our partners, and for the communities where we do business.
James T. Merkel Co-Founder & Chief Executive Officer

2022 ESG REPORT | 5
At Rockbridge, we are committed to leading by example, seeking continuous improvement, and making a difference in everything we do.
6 | ROCKBRIDGE


A MESSAGE FROM OUR CEO 5 ABOUT ROCKBRIDGE 11 SCOPE OF ESG REPORT 14 ROCKBRIDGE ESG APPROACH 18 RELEVANCE 27 RESPONSIBILITY 37 RELATIONSHIPS 55 RESILIENCE 71 SUPPLEMENTAL INFORMATION 79 8 | ROCKBRIDGE

2022 ESG REPORT | 9
276 HOSPITALITY & MIXED-USE ASSETS
$9.3B BILLION OF TOTAL PROJECT CAPITALIZATION

10 | ROCKBRIDGE AS OF YEAR-END 2021
REACH INCLUDES 38 STATES
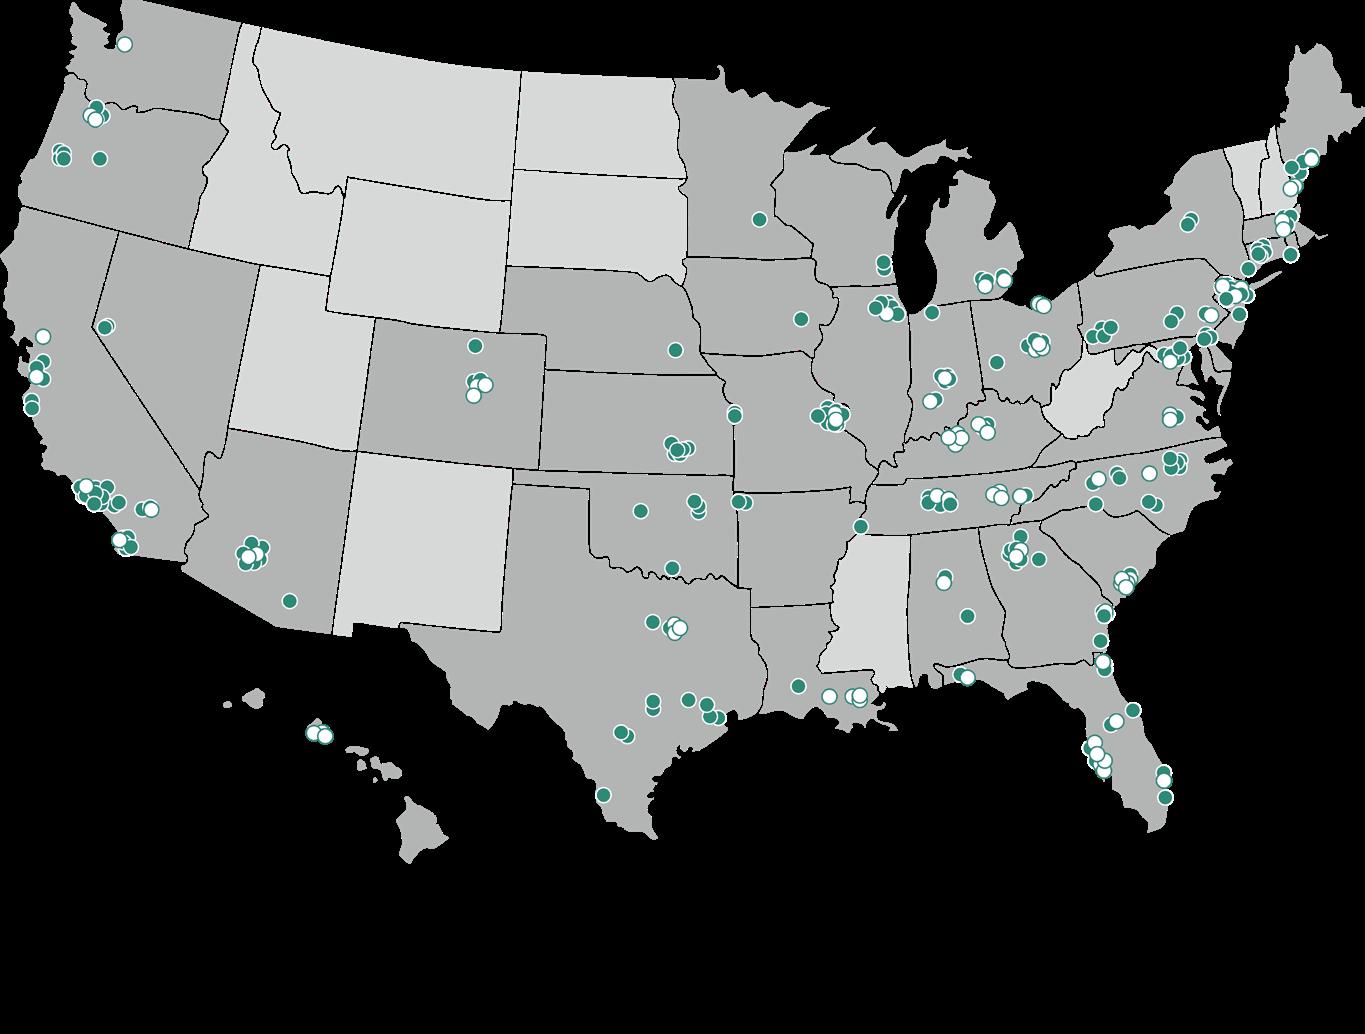
TOP 10 LARGEST HOTEL OWNERS & DEVELOPERS IN THE US
About Rockbridge
Rockbridge is a hospitality-focused private equity real estate firm based in Columbus, Ohio. Founded in 1999, Rockbridge invests in high-quality hotels, both branded and independent, located in primary, secondary, and specialty markets throughout the country. As of year-end 2021, the Firm had invested in 276 hospitality and mixed-use assets, representing more than $9 billion of total project capitalization across 38 states. Our 22-year, cycle-tested track record includes high-yield debt, quasi-equity, and equity investments.
Map notates both realized and unrealized investments in Rockbridge’s hospitality funds and direct investments from 1999 – 2021.

2022 ESG REPORT | 11
Relevance Responsibility Relationships & Resilience
OUR FOUR ROCKS
We believe our continued success is a result of building a team and culture that is intensely collaborative, innovative, curious, and focused. These attributes are among a strong set that have positioned Rockbridge as a leading investor and partner, and placed Rockbridge among the top 10 largest hotel owners and developers in the United States based on total rooms under ownership.
Our corporate culture revolves around a set of ideals, including Relevance, Responsibility, Relationships, and Resilience. We call them our Rocks. Our Rocks provide a natural complement to our ESG efforts, and much of this ESG report uses these four Rocks as a reporting framework.

12 | ROCKBRIDGE
KEY ROCKBRIDGE AFFILIATES
As part of its investment activity, Rockbridge invests in the physical asset quality of its hotel portfolio through execution of comprehensive renovations and thorough remediation of deferred building maintenance. Rockbridge also serves as the lead developer on numerous ground-up construction, adaptive reuse, and historical rehabilitation projects. These projects increasingly include independent, lifestyle, or boutique hotels with complex design needs and programming expectations, necessitating an elevated level of focus and hotel-specific expertise from the project teams. To support these efforts, Rockbridge has deepened its renovation and development expertise through investments in three affiliates over the past decade.
RB Hotel Development is a design, development, and construction management company that has executed on more than $2 billion of renovation and development work since its inception in 2011. For purposes of this report, all references to "RBHD" refer to RB Hotel Development.
Makeready is a hotel management company based in Dallas, Texas specializing in branding, design, and operations of hotels, restaurants, and retail in urban neighborhoods and leisure destinations throughout the United States since its founding in 2015.

OWNERSHIP & INVESTMENT MODEL
RB Hospitality Management is a dedicated asset management and hotel operational oversight platform founded in 2022. For purposes of this report, all references to "RBHM" refer to RB Hospitality Management.

Rockbridge’s hotel ownership and investment model relies on the use of our operating platform of hospitality specialists and affiliated management companies, as well as partnerships with third-party operators situated throughout the country. This model allows us to align the requirements of an investment opportunity with an operating partner’s skill set to position any investment for successful execution. We believe this flexibility has yielded strong market awareness and an ability to mobilize solutions to problems or respond to opportunities quickly. This decoupling of day-to-day hotel management from our highly focused investment management platform provides advantages for driving strong returns and managing risk, but also has distinct implications on Rockbridge’s methods for managing ESG performance.
Rockbridge’s shared influence over property-level ESG outcomes is discussed further on page 24.
2022 ESG REPORT | 13
Scope of ESG REPORT
Unless otherwise noted, the ESG metrics in this report reflect Rockbridge’s performance at its corporate headquarters and for its active investment portfolio as of year-end 2021.

14 | ROCKBRIDGE

2022 ESG REPORT | 15
PROPERTY-LEVEL DATA REPORTING SCOPE
Property-level data includes quantitative metrics on utility consumption, energy ratings, and geospatial risk analytics, as well as qualitative survey response data stemming from Rockbridge’s 60-question ESG survey on established and emerging ESG best practices in our hotel portfolio. This data provides critical insights that enable us to establish a performance baseline and set targets for future improvements with confidence, knowing that we can measure the metrics we want to influence.
ROCKBRIDGE PORTFOLIO ACTIVE INVESTMENTS
AS OF YEAR-END 2021
ROCKBRIDGE PORTFOLIO INVESTMENTS ELIGIBLE FOR PROPERTY-LEVEL DATA CAPTURE
100% 98% 100% UTILITY DATA CAPTURE RATE ON ELIGIBLE PROPERTIES
ESG SURVEY DATA CAPTURE RATE ON ELIGIBLE PROPERTIES
ESG SURVEY RESPONSE RATE ON PROPERTIES SURVEYED
Please see Appendix D and Appendix E for additional detail on property-level ESG reporting scope.

16 | ROCKBRIDGE
Successes
PROPERY-LEVEL DATA CONSIDERATIONS FOR CERTAIN INVESTMENT TYPES
Our 22-year track record includes high-yield debt, quasi-equity, and equity investments made via Rockbridge’s hospitality funds and other direct investments. High-yield debt investments are excluded from the scope of this ESG report for all property-level data, including utility data and ESG survey responses. As a lender, we have limited operational influence and data visibility. We may explore opportunities to apply ESG best practices to this subset of our portfolio in the future.

Rockbridge’s portfolio includes several non-hotel assets, undeveloped land parcels, or hotels that are considered either non-operational or mid-construction for certain reporting years. These investments are excluded from the scope of this ESG report for all property-level data, including utility data and ESG survey responses, either because an extended shutdown or other unique operational circumstance could jeopardize data integrity and inaccurately skew portfolio-level results, or because ESG data for these investments is not available.
Our portfolio has continued to undergo investment activity in 2022, including modifications, new originations, and dispositions. Investments are analyzed in this report based on their status as of year-end 2021.
AFFILIATE ACTIVITIES
Certain other Rockbridge affiliates, including Makeready, BridgePoint Hospitality, and RBXMedia, may have an ownership interest in, partnership with, or management responsibilities for certain projects in which Rockbridge holds no direct investment. These projects are excluded from the scope of this ESG report, as are the general business activities of Makeready, BridgePoint Hospitality, and RBXMedia, which are not a core part of Rockbridge’s operations and function as separate corporate entities.
RBHD and RBHM, though separate affiliates, are supplemental to Rockbridge’s hotel investment capabilities. The entity-specific business activities of RBHD and RBHM are excluded from this report, though we expect to report more extensively on their ESG-specific impacts in future reports. Employee demographics of RBHD and RBHM are included in the scope of Rockbridge’s reporting given our shared Columbus headquarters, and given that the strategies put forward by Rockbridge’s ESG platform will apply to, and require collaboration with, both RBHD and RBHM.
Rockbridge ESG Approach
Though Rockbridge hasn’t historically applied an ESG label to certain business activities, the spirit of ESG has been part of Rockbridge’s approach to business for decades. Following the formalization of our ESG platform, that original spirit remains intact: we remain committed to leading by example, seeking continuous improvements, and using our team and our resources to make a difference in everything we do. The formation of Rockbridge’s ESG platform is a natural evolution of that ethos.

The Rockbridge ESG platform formalizes our commitment to maximizing positive impact while driving strong returns. To us, conducting business responsibly, investing in our team, and giving back to our community have been foundational elements of our company culture, and, more simply, who we are. Our ESG platform was built with the intention to elevate the good work already being done across the organization, and to identify opportunities to take our ESG performance to the next level. We will continue to approach our ESG efforts with curiosity and transparency, knowing that ESG will only continue to grow in importance, and that we have a lot of work yet to do.
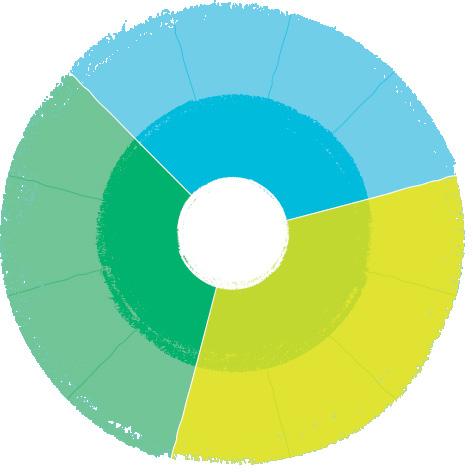
On the following page, our ESG wheel reflects ESG factors currently considered to be most material to our business model and where we believe we can make the largest impact based on our in-house expertise and scope of influence. These core elements of our ESG framework come together to drive our efforts forward.
18 | ROCKBRIDGE
The Rockbridge ESG Wheel
Sustainable Property Operations

Employee Health, Safety, Development, & Compensation
Corporate Philanthropy & Volunteerism
Environmental Policy & Management
High-Performance Buildings
Climate Risk Assessment
Advocacy for Diversity, Equity, Inclusion, & Human Rights
Community Engagement & Stakeholder Partnerships
Data Protection & Secure Business Operations
Transparent & Timely Reporting
Risk Management & Investment Oversight
Ethics & Compliance
2022 ESG REPORT | 19
OS C I A L ENGAGEMENT CORPORATEGOVERNANC E ENVIRONME
NTAL RESPONSIBILITY
CORPORATE GOVERNANCE
Formal ESG integration started with establishing Rockbridge’s ESG team, which now serves a critical role in our corporate governance efforts. This internal, cross-functional team uses feedback from all corners of the Firm to inform our interdisciplinary ESG approach. The ESG team’s initial work included inventorying the ESG-related materials, metrics, policies, and practices that Rockbridge already had available. The team then established an ongoing ESG data collection strategy — one that pairs ESG disclosures with financial materiality and aligns with widely-accepted reporting frameworks. Through this process, we are institutionalizing the Firm’s written ESG documentation to codify our data management efforts, guide future endeavors, and ensure selfaccountability.
As a Firm, we remain committed to ethics and compliance through team member training and disclosures and will continue to audit data security and business continuity, manage investment risks, and report transparently on our business. This Firm-level governance approach extends to our hotel portfolio, where we are focused on gaining visibility into property-level compliance and governance practices.
We are proud to publish a comprehensive ESG report, which aligns our ESG disclosures with established industry guidelines. Transparent and timely reporting remains a pillar of Rockbridge’s corporate governance, and as such, we will seek to both provide regular ESG performance updates and refine our reporting capabilities.

20 | ROCKBRIDGE
Better data leads to better decisions, and better decisions create better financial outcomes.
ENVIRONMENTAL RESPONSIBILITY
Rockbridge is excited about several environmental sustainability initiatives that are already producing tangible results, particularly those that provide better access to higherquality data and enable us to measure the metrics we want to manage. We were pleased to achieve a 100% response rate on our first property-level ESG survey, providing us access to critical data on operational sustainability practices that has historically gone uncaptured. Since 2021, we have also gained visibility into utility consumption across several million square feet in our portfolio. Stronger transparency on utility consumption, backed by reliable data, has enabled the addition of new climate-specific metrics to track physical hazard exposure and climate transition risk across our portfolio. We are further engaged at the industry level to track environmental policies and opportunities, including our ongoing involvement with the American Hotel & Lodging Association and its Sustainability Committee.
Better data leads to better decisions, and better decisions create better financial outcomes. Increased access to important asset-level environmental data enables Rockbridge to think about portfolio ROI opportunities, energy rebates, tax credits, and financing opportunities — actionable strategies that we use to drive hotel demand and strong returns.
SOCIAL ENGAGEMENT
Social responsibility is an area where Rockbridge has maintained several long-standing philanthropic engagements and has generated millions of dollars of impact to causes we care about during our decade-plus commitments. Since the start of our ESG platform, we have created new internal positions and policies to augment our Firm-level efforts on community engagement, diversity, equity, and inclusion. We also gained better visibility into the work that our hotels are doing to support the local communities in which Rockbridge does business.
These efforts are about taking social responsibility to the next level, ultimately to attract and retain top talent and reinforce our position as a business partner of choice. There are financial benefits, both tangible and intangible, to be had from these efforts, and while financial success is a key driver of our business, having a positive impact along the way is what makes it special.

| 21


22 | ROCKBRIDGE
Applying Our ESG Framework
As Rockbridge’s ESG platform efforts continue, we remain focused on unlocking both financial and sustainability benefits across three themes: seizing opportunity, managing risk, and formalizing commitment.
Seizing Opportunity
Rockbridge is targeting ESG efforts that provide both financial and sustainability benefits, and that emphasize compatibility with returns — not trade-offs. We are confident that our heightened focus on ESG integration will reveal new interdisciplinary opportunities to drive hotel demand and strong returns, as well as to support our team and partners.

Managing Risk
As stewards of investor capital, identifying, assessing, and addressing risk has always been a hallmark of Rockbridge’s investment platform. Going forward, with more formal ESG integration, better data transparency can enable stronger risk mitigation at the Firm level and throughout our real estate portfolio, including physical and transitional climate risks, as well as risks associated with supply chains, rising labor costs, and deferred building maintenance, among others.
Formalizing Commitment
Our ESG platform formalizes our commitment to maximizing positive impact while delivering strong returns. We work to make a difference in everything we do, which we believe is a core responsibility as institutional investors and as good corporate citizens. A more formal ESG commitment deepens our ability to manage risk and drive strong returns, and also adds efficiency and clarity to our internal policies and reporting. We believe investor interest in company ESG disclosures will continue to grow, and our platform positions us to manage investor inquiries in the most transparent and informative manner possible.
2022 ESG REPORT | 23
SHARED INFLUENCE OVER ESG OUTCOMES
Partnerships are an integral part of our ESG platform. Rockbridge shares property-level operational influence — including implementation of ESG best practices — over its hotel portfolio with the management and brand partners we select. Hotel managers implement standard corporate practices in on-property operating protocol, and hotel brands apply service and design standards. No hotel’s ESG success (or failure) can be solely attributed to any one partner, as all ESG efforts are inherently collaborative.
Hotel owners, management companies, and brands each bring deep expertise in their respective business models to contribute a unique perspective and skillset to a hotel project. This shared control of the end-product affects many facets of hotel operations that directly impact ESG performance. At times, this can bring about competing priorities or delayed decisions as Rockbridge seeks to improve ESG outcomes. However, any short-term limitations this may place on our ability to influence ESG outcomes are outweighed by the efficiencies of this natural collaboration. We see value in having access to best practices — ESG and otherwise — from all corners of our industry, and in return, we will continue contributing our own knowledge and experience to accelerate collective progress.

24 | ROCKBRIDGE
This report is a natural evolution of Rockbridge’s long-standing commitment to making a difference in everything we do. Our ESG approach is grounded in the responsibility we feel as community leaders and stewards of capital. We appreciate the support of our investors in this journey and look forward to reporting on our progress.
—Bill Avoli, Managing Director, Capital Markets

2022 ESG REPORT | 25


26 | ROCKBRIDGE
Relevance
ESG is more relevant today than ever before, and the formation of Rockbridge’s ESG platform couldn’t have come at a better time. ESG factors are becoming increasingly relevant on a global scale, and the hospitality industry shares a unique piece of the global challenge to improve sustainability and ESG outcomes.
Enhancing environmental sustainability, pursuing sustainable social and economic development, mitigating and adapting to the impacts of climate change, and ensuring responsible industry operations are global challenges. The hotel industry, being a highly visible, global industry, has a role to play in supporting solutions.

2022 ESG REPORT | 27
ESG APPLICATIONS TO THE HOTEL INDUSTRY

For hotel owners, perceived tradeoffs are often the largest barrier to incorporation of ESG factors into business operations. The idea that environmental sustainability or strong compliance practices will only come at the expense of guest satisfaction, staff efficiency, online rankings, focused branding, and most importantly, financial performance, is harmful. At Rockbridge, we reject that narrative. We do not view ESG factors as a balancing act between responsible operations and financial performance, but rather as a mutually beneficial relationship. When implemented effectively, ESG best practices will support a hotel’s financial goals, and vice versa.
Hotels are relevant and necessary targets for sustainability enhancement in the built environment. As shown in the figure below, hotels are more intense users of water and energy and have a larger carbon footprint than other real estate sectors, as measured on the basis of both asset value and floor area. However, hotels’ status as the real estate sector with the largest carbon footprint is not always accompanied by equivalent investment in carbon footprintreducing initiatives and prudent resource use. While this high resource usage intensity may be partially attributable to a hotel’s operational intensity, 24-hour demands, and limited control of guests’ individual resource consumption, the data clearly indicates enormous potential to increase both a hotel’s positive environmental impact and its bottom line. Additionally, this suggests a higher level of responsibility that the entire hotel sector must acknowledge to focus on important ESG issues.
Rockbridge has recognized this need and is working to close the gap between awareness and action.
28 | ROCKBRIDGE
Intensity Level per Square Foot Hotel Office Retail Industrial Residential Other Water (Gal) Power (kWh) Carbon (KgCO2e) 60 50 40 30 20 10 0 55 33 9 Intensity Level per $1MM GAV Water (kGal) Power (MWh) Carbon (MtCO2e) 200 150 100 50 0 170 104 28 Source: GRESB
ESG has become fundamental to the conversation in our industry. We pride ourselves on our responsiveness to investors’ needs for transparent and accurate portfolio reporting — ESG will be no different.
—Áine Cronin, Vice President, Capital Markets

2022 ESG REPORT | 29
30 | ROCKBRIDGE
Maker Exchange | Knoxville, TN

Rockbridge developed Maker Exchange, a space that connects The Tennessean and Marriott hotels in downtown Knoxville, Tennessee as a celebration of the city and an investment in the local maker community. It is dedicated to showcasing why Knoxville has been dubbed “The Maker City” and gives a nod to the richness and vibrancy within its community of artists and craftspeople.
From light fixtures to furniture, we worked with local makers to create unique pieces for the space, which serves as a hub to both educate and inspire locals and hotel guests from across the country. In addition to hosting meetings and special events, the space hosts permanent art collections and houses a marketplace for local makers to offer their work for sale as further support to the artisan community.

2022 ESG REPORT | 31
ESG IN ACTION
OUR STAKEHOLDERS
ESG factors have become increasingly important due to their broad scope of relevance to the various stakeholders in Rockbridge’s business model, and their wide-ranging applications to our industry. We serve a diverse group of stakeholders, with varying degrees of impact, engagement and investment in sustainability efforts. In addition to the inherent relevance of ESG for Rockbridge’s portfolio of hotels, acceleration of ESG interest from investors and partners continues to increase — a change that Rockbridge welcomes.
Responding to stakeholder needs starts with understanding their motivations — and these deeply interwoven, and at times, conflicting, motivations present a complex challenge for creating ESG momentum. We apply our themes of seizing opportunity, managing risk, and formalizing commitment to assess our multifaceted universe of ESG stakeholders, organize our approach for responding adequately to their needs, and engage them effectively in our efforts.
Y F
Talent Pipeline
Hotel Guests
Meeting Planners
Hotel Brands Investors
Local Communities
ORMALIZINGCOMMITME
AHLA
RBHD
Operating Partners
Rockbridge Team
Suppliers & Vendors
Architects & Designers
Hotel Employees
Tourism Associations
Future Generations
Borrowers
Lenders
City Review Boards RBHM
Hotel Industry
N T
SEIZINGOPPORTUNIT
MANAGING RISK
Hilton | Richmond, VA
Our Hilton property in Richmond, Virginia is a member of the Virginia Green Travel Alliance, which was created in 2014 to support and expand the state’s sustainable tourism efforts. This includes the Virginia Green program, which recognizes statewide tourism partners with environmental commitments.


In 2021, the Hilton Richmond Downtown was recognized as “Green Hotel of the Year” by the Virginia Green program and was one of just fifteen tourism partners honored with a Virginia Green Travel Star Award — the program’s highest award.
This award was made possible by the operations team at both the property and the corporate levels, and the commitment they have to composting food waste, locally sourcing culinary ingredients, and promoting energy efficiency.
2022 ESG REPORT | 33 ESG IN ACTION

34 | ROCKBRIDGE
MEASUREMENT & SCOPE ACCOUNTABILITY
Many ESG reporting frameworks and benchmarks exist for the real estate industry to ensure standardized collection and reporting of relevant data. Though Rockbridge may use alternative or additional ESG frameworks in the future, we are currently electing to follow standards for ESG measurement and scope accountability as set forth by the Sustainability Accounting Standards Board, also referred to as “SASB” throughout this report. SASB guides the disclosure of financially material sustainability information by companies to their investors. Available for 77 industries, the SASB standards identify the subset of environmental, social, and governance issues most relevant to financial performance in each industry.
The SASB Real Estate framework is well aligned with Rockbridge’s scope of influence as a private hotel investor. The data captured and reported under the SASB Real Estate framework is also aligned with our goal of unlocking both financial and sustainability benefits. Rockbridge’s alignment with a global, widely accepted ESG reporting framework like SASB Real Estate ensures that the data we report and the actions we take via our ESG platform are those that are most relevant for our investors.
Please see Appendix B for Rockbridge’s complete SASB Real Estate disclosure.
Curiosity and transparency will close the gap between ESG awareness and ESG action.

2022 ESG REPORT | 35

36 | ROCKBRIDGE
When it comes to responsibility on a global scale, we know the questions that are being asked. How can we use environmental and energy resources in a more responsible and efficient way? How can we create buildings that contribute to a healthy climate? How can we create inclusive and resilient communities to support a population that is aging, growing, and increasingly diverse? And how can business and finance catalyze progress at a time when investor scrutiny of responsible business practices is at an all-time high?
These are complex societal questions that can feel like challenges for tomorrow. But these are also economic questions, and that makes them applicable to risk and returns today. We believe Rockbridge has a responsibility to lead by example as we seek answers to these important questions.

Responsibility 2022 ESG REPORT | 37
ENVIRONMENTAL PERFORMANCE MANAGEMENT
Environmental performance measurement was an early focus for Rockbridge’s ESG platform. Data access and data quality with respect to utility consumption was particularly important due to the direct financial implications, as well as the additional analytical layers unlocked by robust utility data: capital expenditure planning, climate risk mitigation, peer benchmarking, energy procurement, return-on-investment analysis, and more.
We are proud to report a 100% utility data capture rate for eligible properties. Though we have historically been mindful of energy and water efficiency in the design and ongoing operations of our hotels, gaining clear visibility into our property-level utility consumption and quantifying our greenhouse gas emissions by property allows tactical pursuit of opportunities throughout our portfolio to reduce both operating costs and environmental impact.
LIKE-FOR-LIKE TREND ANALYSIS OF KEY METRICS
The accompanying index trend charts demonstrate property-level environmental performance over time. We employ this analytical method to properly compare like-for-like annual performance of consistent property subsets across key environmental metrics. In doing so, we can visualize and study these metrics over time without sacrificing data quality or completeness. A “like-for-like” approach to property-level data analysis accommodates both the heterogeneity of Rockbridge’s hotel portfolio and the high volatility with which our portfolio changes annually. Highly inconsistent yearto-year portfolio composition necessitates creativity and care to extract appropriate insights.
Energy use and greenhouse gas emission intensity are reported on an area-normalized basis, represented as quantity per gross square foot. Water is reported on an occupancy-normalized basis, represented as quantity per occupied room night. Water consumption is largely determined by the number of users in a hotel, whereas energy use and greenhouse gas emissions are most impacted by a building’s size and the physical specifications of the building envelope and systems.
Please see Appendix A for Rockbridge’s detailed environmental performance since 2015 on a range of measurements and analytical methods for energy use, water use, and greenhouse gas emissions.
Key 2021 Environmental Metrics

ENERGY USE INTENSITY
23.8
kWh per Gross Sq. Ft. +14.9% Like-For-Like Annual Change
WATER USE INTENSITY
183.0 Gallons per Occupied Room -19.1% Like-For-Like Annual Change
GREENHOUSE GAS EMISSION INTENSITY
9.6 kgCO2e per Gross Sq. Ft. +9.3% Like-For-Like Annual Change
Like-for-like annual change metrics compare 2021 to 2020. In 2020, the COVID-19 pandemic disrupted occupancy and energy use across many hotels and necessitated temporary shutdowns at some properties, including at certain hotels in Rockbridge’s portfolio. The juxtaposition of heavy hotel demand disruption (2020) with the quick start to the hotel industry’s recovery (2021) is a primary driver of the higher-than-typical magnitude of like-for-like, year-over-year change in 2021 for the key environmental metrics shown.
38 | ROCKBRIDGE
Use Index vs. Base Year - Like-For-Like Trend (kWh / GSF)


2022 ESG REPORT | 39
Index vs. Base Year 115 110 105 100 95 90 85 80 75 70 65 7 Years (10 Hotels) 6 Years (4 Hotels) 5 Years (1 Hotels) 4 Years (7 Hotels) 3 Years (5 Hotels) 2 Years (8 Hotels) 2015 2016 2017 2018 2019 2020 2021 100 98 99 99 94 71 82 100 95 99 85 70 86 100 103 106 83 90 100 100 74 84 100 72 84 100 112
Energy
Water Use Index vs. Base Year - Like-For-Like Trend (Gal / ORN)

40 | ROCKBRIDGE Greenhouse Gas Emissions Index vs. Base
- Like-For-Like
/ GSF) Index vs. Base Year 115 110 105 100 95 90 85 80 75 70 65 5 Years (14 Hotels) 4 Years (3 Hotels) 3 Years (4 Hotels) 2 Years (7 Hotels) 2017 2018 2019 2020 2021 100 96 91 73 80 100 98 73 80 100 80 89 100 106
Year
Trend (kgCO2e
Index vs. Base Year 200 175 150 125 100 75 7 Years (10 Hotels) 6 Years (4 Hotels) 5 Years (1 Hotels) 4 Years (7 Hotels) 3 Years (5 Hotels) 2 Years (8 Hotels) 2015 2016 2017 2018 2019 2020 2021 100 97 93 87 80 115 92 100 94 99 106 188 121 100 100 97 118 107 100 97 118 100 100 121 93 100 90
ENERGY BENCHMARKING
EnergyStar is a joint program of the U.S. Environmental Protection Agency (EPA) and the U.S. Department of Energy (DOE). EnergyStar scores reflect a percentile ranking from 1 (poor) to 100 (excellent) of a building’s energy performance versus comparable buildings. A score of 50 represents median energy performance. EnergyStar provides a performance-based rating system that reflects a building’s ongoing energy performance. EnergyStar scores are based on energy efficiency over a defined period of time, as opposed to a prescriptive rating system (e.g. LEED Certification) that rates a building’s energy performance based on a one-time scorecard for a building’s systems, design, and physical specifications instead of ongoing energy performance.
EnergyStar provides Rockbridge with a simple comparison method to evaluate which of our hotels, if any, may be underperforming relative to similar hotels with similar physical specifications, based on weather-normalized source energy data. Rockbridge evaluates energy management best practices in both the design and ongoing operations of our hotels, and we pursue high-performance building upgrades throughout the investment process, when practicable. EnergyStar provides another layer of analysis to track progress and invest effectively in energy efficiency strategies.
AVERAGE ENERGYSTAR SCORE FOR 2021

70
2022 ESG REPORT | 41
Average (mean) score of 38 Rockbridge assets for which 2021 EnergyStar data was available.
Noelle | Nashville, TN
Water bottle refill stations installed on every guest floor at the Noelle in Nashville, Tennessee to prevent plastic bottles from reaching a landfill where they take hundreds of years to break down.
In addition to creating a unique branding moment for the hotel and providing a helpful guest amenity, water stations also provide a creative way to directly engage hotel guests in our on-property sustainability efforts.


ESG IN ACTION 42 | ROCKBRIDGE

2022 ESG REPORT | 43
ESG PROPERTY SURVEY HIGHLIGHTS
We are proud to report a 100% response rate to our ESG best practices survey from the portfolio properties — the completeness of this data exemplifies our hotels’ commitment to improving ESG performance, and this baseline data will allow us to measure and improve performance going forward.
Of the hotels in Rockbridge’s portfolio...
SUSTAINABILITY PLANNING & MONITORING
93% have preventive maintenance programs that cover mechanical, electrical, and/or plumbing systems
70% follow a documented management plan for efficient energy use
61% follow a documented management plan for efficient water use
37% have a sustainability committee or designated sustainability champion in place on property
ENERGY USE & EFFICIENCY
50% have a building management system that centralizes the control and monitoring of lighting and HVAC equipment
78% have HVAC systems that use zone controls or variable speed drive motors in at least one area of the property
96% have digital thermostats in more than 90% of guest rooms
70% have energy efficient lighting from LEDs or other energy-efficient bulbs in more than 90% of hotel floor area
EMPLOYEE ENGAGEMENT & WELL-BEING
100% have an anti-harassment policy in place
74% have undertaken an employee satisfaction survey in the past 3 years
83% are located within a quarter mile of public transportation access
72% have smart lighting with occupancy sensors or timers in at least one area of the hotel
28% have at least one electric vehicle charging station available for guests
44 | ROCKBRIDGE
WATER MANAGEMENT & CONSERVATION
70% have low-flow showerheads that regulate water usage in more than 90% of guestrooms
89% use an on-request approach to linen and towel change
61% use high-efficiency commercial washers
WASTE MANAGEMENT & MINIMIZATION
70% have eliminated plastic straw usage

70% have eliminated paper-based guest folios
48% have recycling bins in at least one high-traffic common area
39% have in-room separation of recyclables from non-recyclables in more than 90% of guestrooms
58% have access to monthly waste hauler data, and review the property’s weight and volume metrics on a regular basis
76% offer remaining food to team members or donate to local charities
74% follow a documented responsible purchasing policy

ESG IN ACTION
The Laylow | Honolulu, HI
The hotel shop at The Laylow, located in Waikiki, Hawaii, is proud to feature oneof-a-kind, eco-forward products from MicroMahalo, an Oahu-based vendor and artist. The MicroMahalo team collects and repurposes microplastics from Oahu’s beaches to create souvenirs and gifts, which not only prevent the would-be pollutants from doing further harm to the environment, but also help to raise awareness on the negative impacts that microplastics can have on the health of ocean ecosystems. Proceeds from sales support local beach and ocean conservation efforts.


2022 ESG REPORT | 45
The Cliff House | Ogunquit, ME
The team at The Cliff House in Ogunquit, Maine has long understood a responsibility to serve as environmental stewards of the Bald Head Cliff and surrounding Atlantic Ocean. This includes a commitment to planet-friendly energy procurement and efficient use. The Cliff House recently entered a long-term agreement to participate in a community solar program, which provides clean energy from solar farms located throughout the state of Maine, as well as utility expense savings via discounted credits applied to electric bills. The Cliff House furthers its commitment to development of clean and affordable energy by offering electric vehicle charging stations to its guests, including complimentary usage.

ESG IN ACTION


2022 ESG REPORT | 47
Our Firm-level paperless document signature efforts help save an estimated 509,000 sheets of paper annually, which translates to significant waste prevention:

9.1 US TONS OF WOOD PULP (55 TREES SAVED)

62.3 MILLION BTUS OF TOTAL ENERGY USAGE
43,100 POUNDS OF CO2 EQUIVALENTS
54,000 GALLONS OF WATER
2,980 POUNDS OF SOLID WASTE
COMPREHENSIVE GOVERNANCE PRACTICES
Rockbridge seeks to employ a governance structure with appropriate levels of oversight in the areas of audit, risk management, data security, and potential conflicts of interests. Rockbridge is committed to compliance with applicable labor laws and other important requirements in the jurisdictions in which we invest.
Furthermore, Rockbridge has a Code of Ethics and Compliance Manual that set forth certain duties, obligations, and prohibitions with respect to team members, including policies for personal trading, political contributions, and whistle-blower protections. Rockbridge conducts annual compliance training, led by its Chief Compliance Officer, who also maintains procedures and monitors team member compliance and disclosures.
Rockbridge’s pillars of corporate governance include Transparent & Timely Reporting, Ethics & Compliance, Risk Management & Investment Oversight, Data Protection & Secure Business Operations, and Strong Asset-Level Governance. See Appendix C for more detailed information.
48 | ROCKBRIDGE
Strong corporate governance and risk management practices allow us to pursue our investment strategy with confidence, integrity, and trust. We set this tone at the top of our organization, and it extends across the firm and throughout our portfolio.
 —Tamre Edwards, Executive Vice President & General Counsel
2022 ESG REPORT | 49
Sustainable operations negative impacts while

50 | ROCKBRIDGE
practices mitigate enhancing returns.
RESPONSIBLE INVESTING


We believe that by thoughtful consideration of environmental impacts and undertaking environmentally sustainable operational practices, Rockbridge can limit its negative impact on the environment while providing attractive riskadjusted returns. Therefore, review of environmental issues and considerations has always been a critical element of the due diligence the Firm conducts when evaluating a new investment, and remains a focus area in the ordinary course of managing existing investments.
Management and monitoring of environmental impacts and workplace health and safety concerns is a critical responsibility for Rockbridge. We engage third-party environmental consultants to perform site reviews and prepare an Environmental Site Assessment as part of our standard pre-acquisition diligence procedures. Prior to closing on a portfolio investment, we will establish remediation plans to address any environmental issues (past or present) identified, and make any necessary adjustments to insurance policies to ensure adequate capital availability for addressing risks and issues, should any arise.
With our ESG platform, we plan to further explore pre-acquisition tools and portfolio management strategies that will allow us to seize opportunity or manage risk in our investments.
2022 ESG REPORT | 51
RISK ASSESSMENT
Climate risk — both physical and transitional — requires assessment and mitigation throughout our portfolio. Our ESG platform will identify areas of greatest exposure and direct proactive property-level policy implementation or capital expenditures accordingly. We seek to incorporate pre-acquisition analysis and mitigation measures of relevant climate-related risks.
Physical climate risk includes analysis of climate perils (including flood, wind, precipitation, drought, extreme cold, extreme heat, and fire) and evaluation of adaptation strategies. Climate transition risk includes ongoing legislative review, evaluation of energy transition readiness, and supply chain vulnerability assessments. We continue to educate ourselves on climate risk, which we supplement via collaboration with partners and ongoing involvement with industry organizations such as the American Hotel & Lodging Association Sustainability Committee.

52 | ROCKBRIDGE

2022 ESG REPORT | 53


54 | ROCKBRIDGE
Relationships
The success of our company and our ESG efforts starts and ends with our team and the relationships we foster along the way. We take our responsibility to support our team members and partners seriously, and that sense of responsibility extends to the teams who operate our hotels, the guests who stay in them, and the communities in which they are located. Our commitment to strong relationships has always been one of Rockbridge’s core values, which has catalyzed some of our proudest achievements to date.
Our ESG platform now provides a space to deepen that commitment and better understand how we can continue to make a difference. It is also designed to shine a light on the areas where we have more work to do. We are motivated to tackle those areas first. Our ESG platform provides data, data brings self-awareness, and self-awareness strengthens relationships.

2022 ESG REPORT | 55
ROCKBRIDGE DEMOGRAPHICS
2021 Snapshot
FUTURE

GOALS & COMMITMENTS
We acknowledge that we have an opportunity to expand our efforts on diversity, equity, and inclusion, or DEI. In response, we have created a DEI Committee with the mission of establishing and clearly articulating our commitment to DEI within the organization and its business practices. Over the next year, we are focused on putting the right processes in place to ensure that we are inviting the proper outcomes. We will continue to evolve our hiring and leadership development processes to cultivate diversity and maximize access to opportunities. We look forward to reporting on these efforts in our next report.
56 | ROCKBRIDGE
90% 10% 63% 37% Female Male Other 100% Asian Black/African American Hispanic/Latino White 57% 43% 46% 35% 19% <30 Yrs 31-50 Yrs >50 Yrs GENDER RACE AGE 94% 1% 4% 1% MANAGEMENT (TOTAL = 30) ALL TEAM MEMBERS (TOTAL = 83)
DEI
THE AVERAGE TENURE OF OUR TEAM MEMBERS IS:
All Team Members: 7.7 years
Senior Vice Presidents: 14.2 years
Managing Directors: 11.0 years

Executive Vice Presidents: 15.4 years
INVESTMENT IN PEOPLE
Our team members are the heartbeat of our business, and we work to ensure the highest industry standards in our work practices, policies, benefits, and workplace environment. In addition to these offerings, we focus on enhanced wellness and total wellbeing by providing onsite gym access, along with Wellness Wednesday programming featuring group workouts, meditation classes, and onsite massage therapy. The business invests in a long-standing cultureshaping initiative with full-company quarterly offsites and daily reinforcement in our communication and productivity habits. The model is based on the science of positive psychology to awaken and empower individuals to understand the skills that lead to joyful, meaningful, and fulfilling lives.
2022 ESG REPORT | 57
Halcyon | Denver, CO


The team at the Halcyon in Denver, Colorado — named a Best Place to Work by Denver Business Journal — started a grassroots initiative via Instagram to show appreciation to team members, celebrate accomplishments, and offer professional development support. These efforts were so well-received that the management company’s (Rockbridge’s affiliate, Makeready) corporate office took notice — and has now rolled out a full-scale team building and development app across their entire portfolio to support their property teams.

58 | ROCKBRIDGE ESG IN ACTION
Rockbridge is committed to creating an inclusive culture that invites diversty of thought. We believe the collective sum of our unique backgrounds, capabilities, and talents enhances our culture and has a positive bearing on our reputation and performance.
 —Steve
Chief Operating Officer, Company Affairs
—Steve
Chief Operating Officer, Company Affairs
2022 ESG REPORT | 59
Lyons,
COMMUNITY ENGAGEMENT & SOCIAL IMPACT
Making transformative change in our communities is core to who we are at Rockbridge. In our 22-year history, we’ve invested heavily in social impact efforts and initiatives, including more than 8,000 total volunteer hours by Rockbridge team members over a 5-year period (2017–2021), for which Rockbridge was honored as a Columbus Business First Corporate Citizenship Award recipient in all 5 years. To build on this strong foundation of giving, we formalized our commitment with the addition of a Director of Community Engagement & Social Impact role to continue to drive and expand our impact. Our strategy is centered on four focus areas: youth empowerment, health and well-being, hospitality, and new opportunities fueled by the passions and interests of our team members. Some of the many organizations and initiatives that Rockbridge supports are described below.
YOUTH EMPOWERMENT
At the core of youth empowerment is the belief that young people are capable of incredible things. With exposure to inspiring ideas and opportunities and the tools to build their confidence – their potential is limitless.
ORGANIZATION ROCKBRIDGE IMPACT
$1.5 million raised to date for the organization’s annual Bowl for Kids’ Sake Fundraiser.
5-year partner with the high school Professional Work-Study Program empowering students in need of an affordable, highquality education, to excel in college, in career, and in character.


10 college scholarships provided to Columbus Public School seniors through the I Know I Can program.

Rockbridge created and funds a space at Junior Achievement’s popular BizTown learning program that allows elementary students to connect the dots between in-class learning and real world experiences.


Key funding partner in the development of a Worldreader global digital reading platform focused on social and emotional learning for kids.

60 | ROCKBRIDGE
HEALTH AND WELL-BEING
Rockbridge invests in health and wellness organizations that improve life expectancy, enhance quality of life, and decrease negative environmental impacts. We are working to provide better health for all through the impact of our philanthropic partners.

ORGANIZATION ROCKBRIDGE IMPACT
More than $6 million invested in innovative cancer research through the RTRX experience founded by Rockbridge.
Funding partner supporting children’s mental health initiatives.
Long-term funding partner and board leadership service on Alzheimer’s Association Central Ohio Chapter.

2022 ESG REPORT | 61
HOSPITALITY
The power of hospitality — to serve and create space — is at the core of everything we do. We believe that the power of hospitality and the hospitality industry have the opportunity and responsibility to be drivers of economic development and social impact, and we invest in programs and initiatives that harness the energy of our industry to do good.
ORGANIZATION
Long-standing partner to transform lives through the power of a job.

Long-standing funding partner and board leadership by Jim Merkel, in addition to active participation on the AHLA Sustainability Committee.

TIME-SENSITIVE AND RELEVANT OPPORTUNITIES
We are responsive to the needs of our communities and the passions of our team members, which is why we create the flexibility to invest in initiatives and new opportunities that are timely and need us to step up to make a difference. If it is important to them, it is important to us.
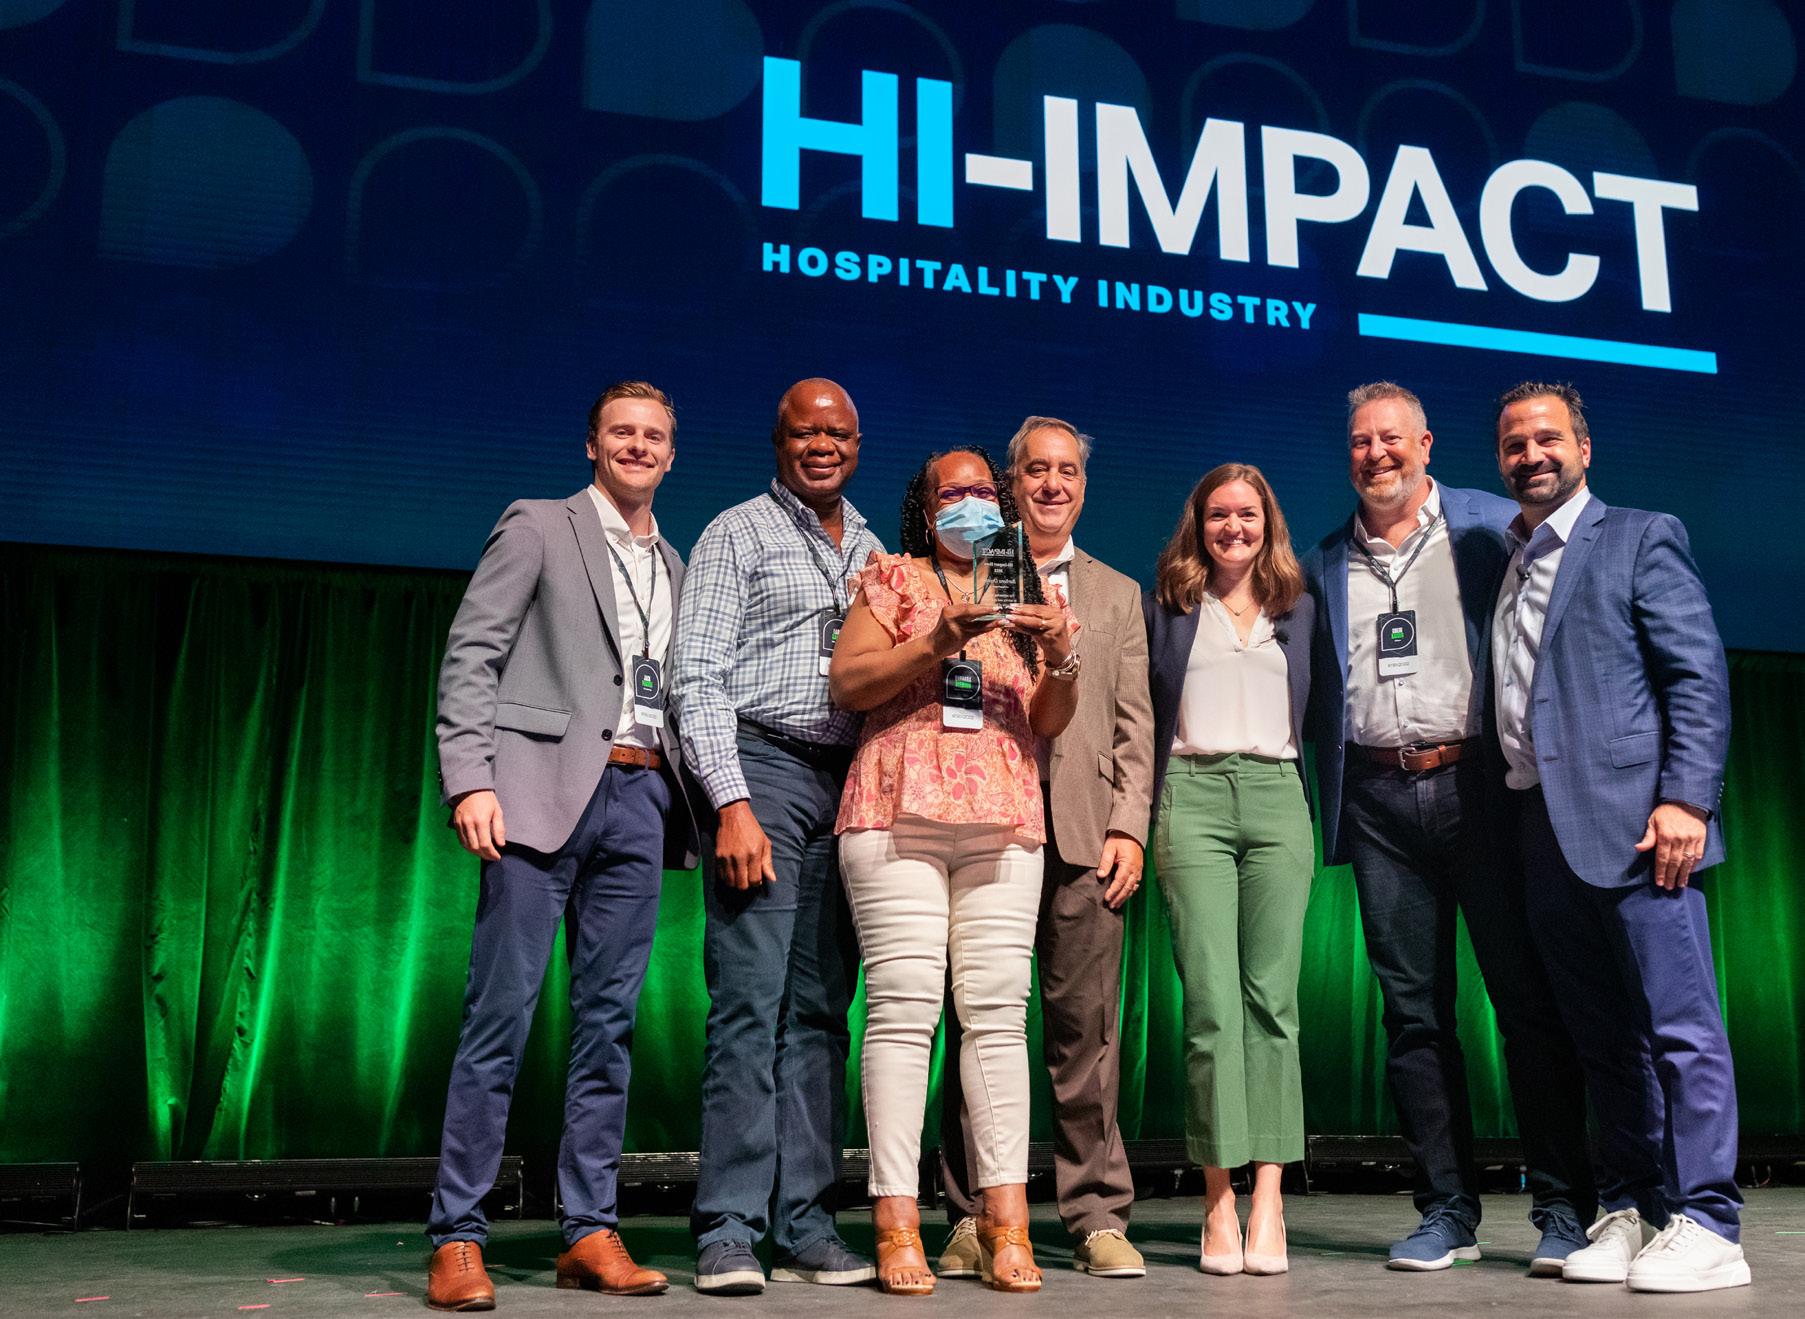
Fundraising to date: $166k
The HI-Impact Challenge was launched in 2018 as a fundraising competition to enlist our hotel network in the fight against cancer, while also giving back to the teams that participate. To date, they have raised $166K for innovative cancer research.
62 | ROCKBRIDGE
ROCKBRIDGE IMPACT
Our commitment to supporting the causes we believe in and the communities where we do business reflects our belief that we have the responsibility to make substantial change for good. We’re proud of our impact, and are passionately pursuing a better world through our work.
—Suraj Hinduja, Managing Director, RTRX and Director, Community Engagement & Social Impact, Rockbridge

2022 ESG REPORT | 63
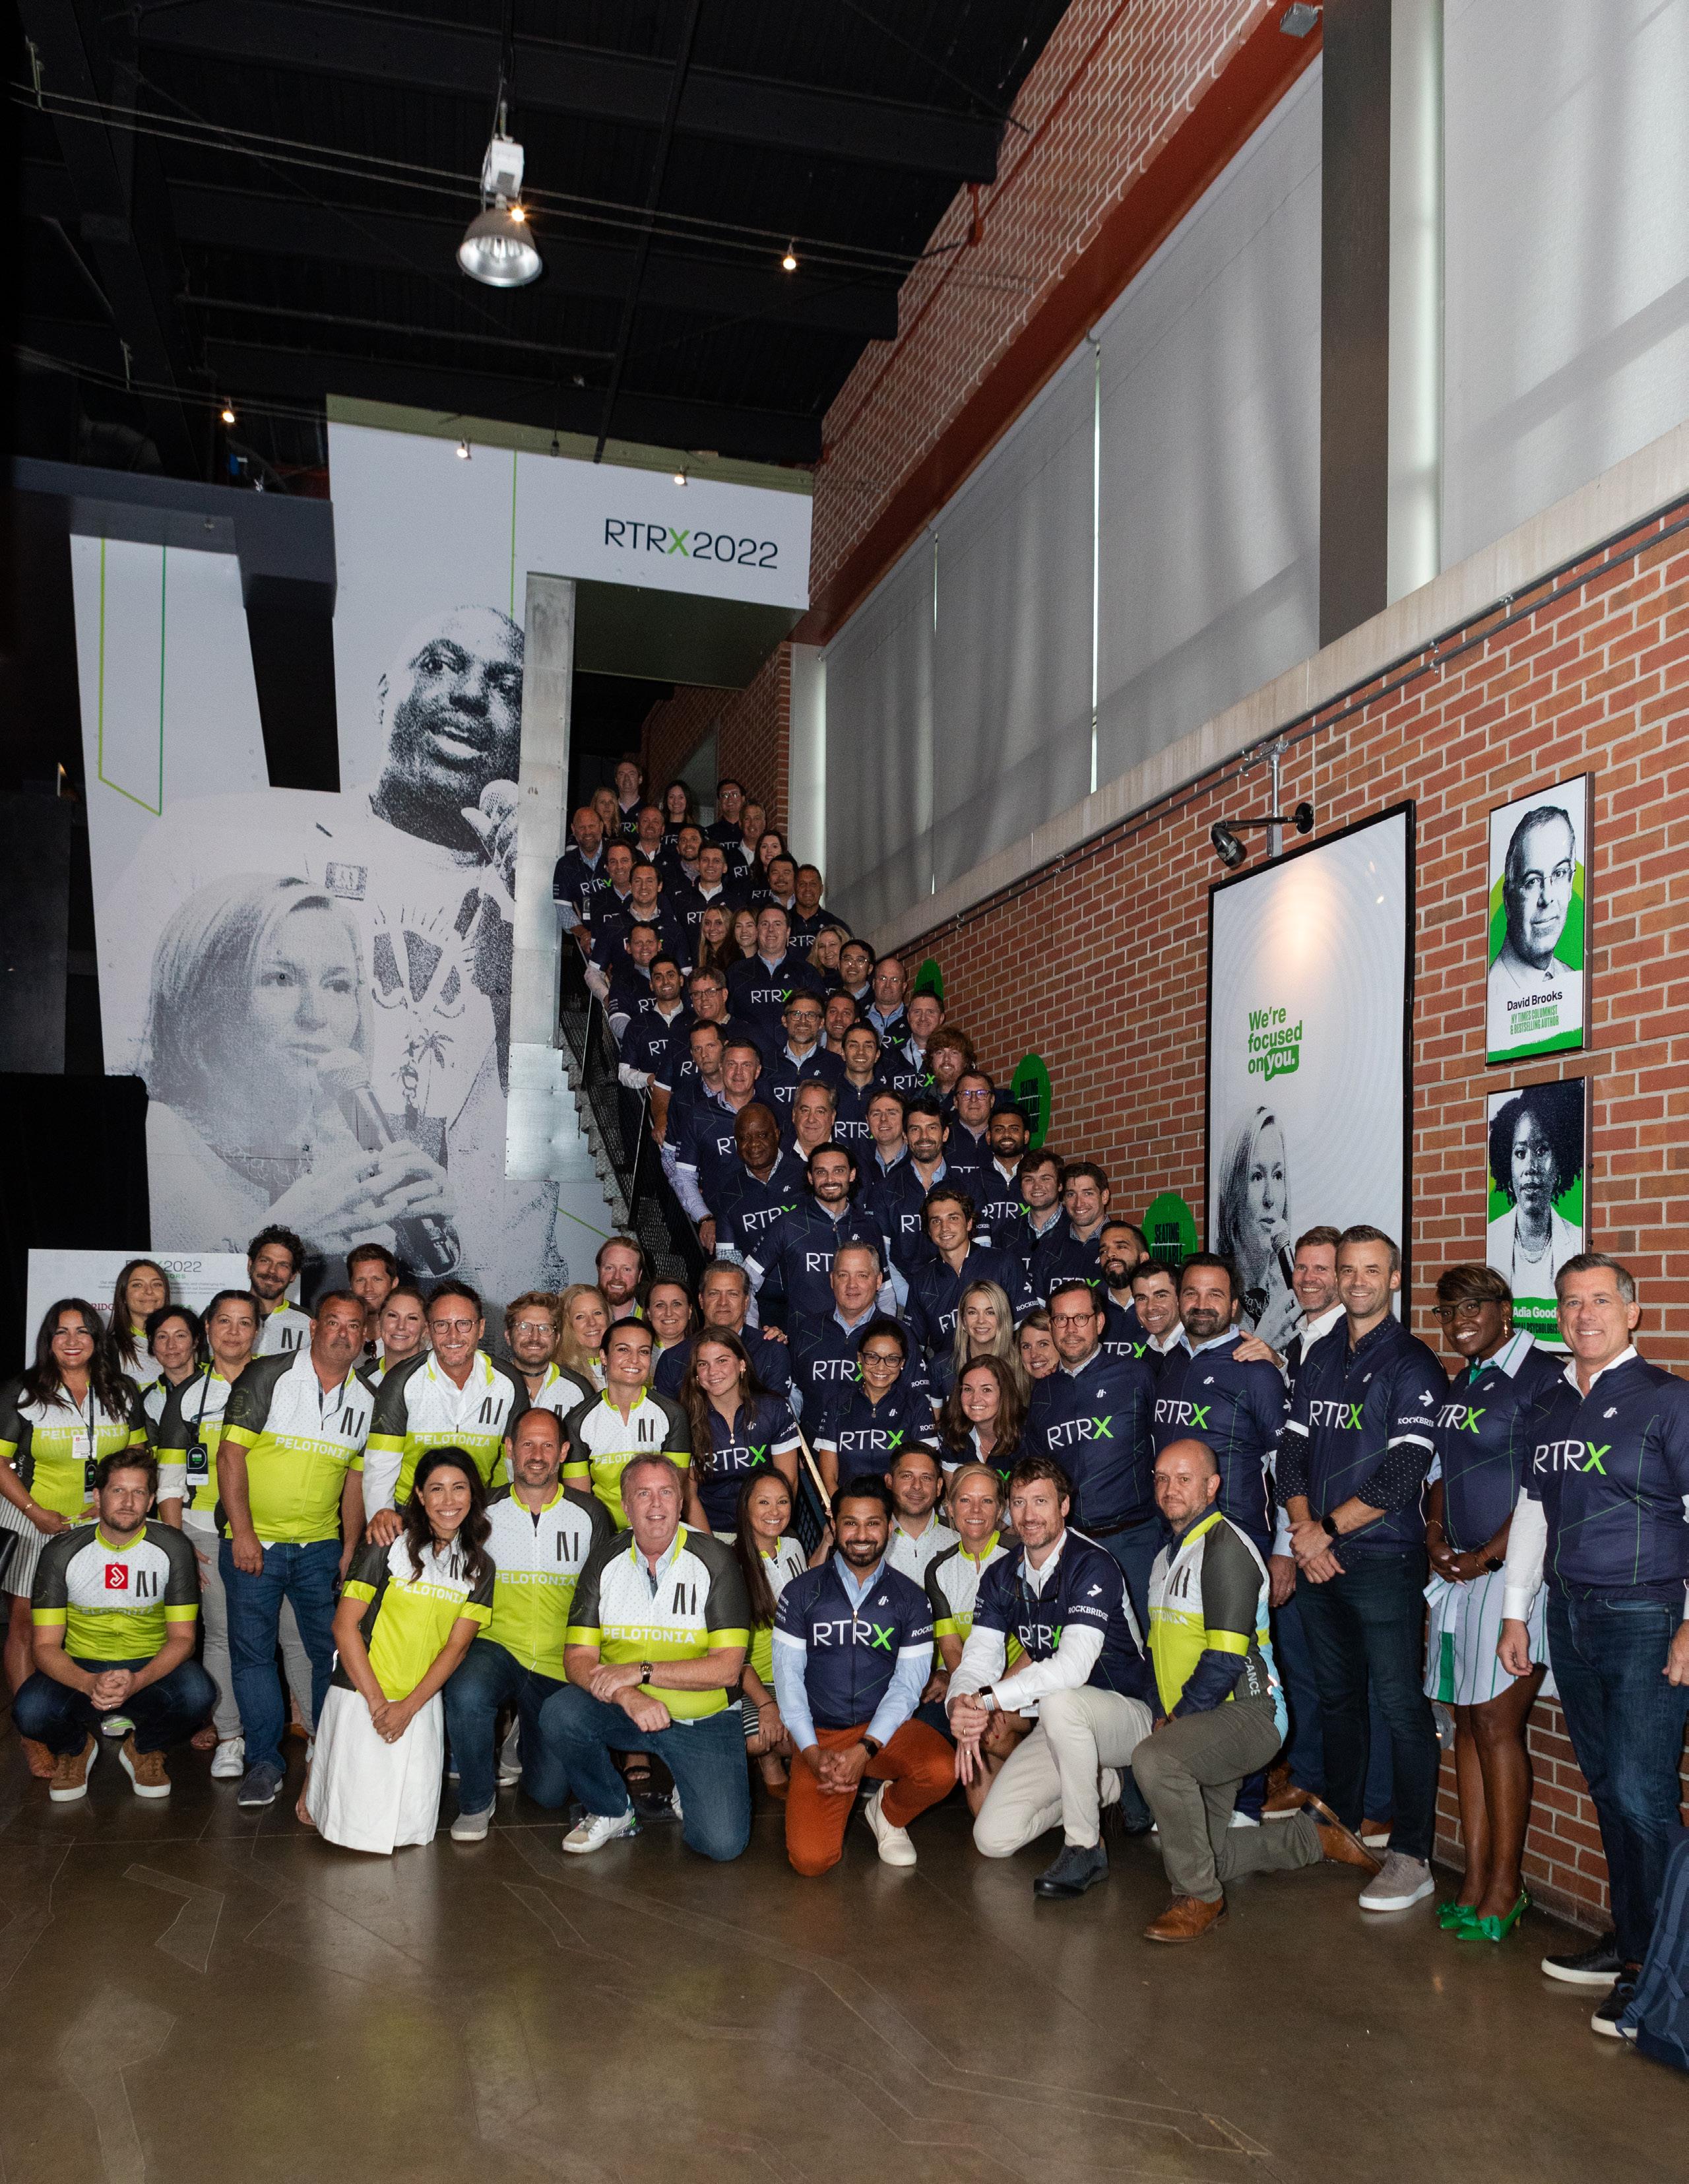
GROWTH FROM 12 PERSON PELOTON IN 2011 TO 300 PERSON SUPER PELOTON
64 | ROCKBRIDGE
Doing Good While Doing Business.
Created by Rockbridge Co-Founder & CEO Jim Merkel

in 2012, RTRX is a business, personal, and leadership development experience that began as a hospitality industry leadership event. Under Jim’s leadership, the experience has grown exponentially and expanded to include additional industries and public and private sector businesses. Held annually in August in conjunction with Pelotonia Ride Weekend, all proceeds directly benefit Pelotonia’s innovative cancer research. To date, RTRX has invested more than $6 million in Pelotonia’s work. A shared commitment to innovation, leadership, and well-being enables us to make a powerful impact on businesses, individuals, and the future of innovative cancer research.
The RTRX experience is uniquely curated with business, philanthropy, fun, and thought-provoking and inspiring content. Dynamic speakers take the audience on a formative change leadership journey challenging them to ask the tough questions, expand their thinking, and cultivate their ability to create, transform, and make an impact. Our past speakers have included guests like New York Times Columnist and Best-Selling Author David Brooks, John O’Leary, Golriz Lucina, Bill Walton, Dr. Robert Livingston, and Casey Gerald.
SUPER PELOTON
As part of the RTRX experience, many of our attendees join our peloton to ride in Pelotonia and raise funds for cancer research. The peloton has grown from 11 participants in 2011 to more than 300 annually. Team Rockbridge has further amplified its Pelotonia impact by inviting RTRX partners and sponsors to ride as part of the RTRX super peloton, forming a “team of teams” with a unified commitment.
2022 ESG REPORT | 65
MORE THAN 3,000 ATTENDEES
NATIONWIDE IMPACT SPANNING 28 STATES
66 | ROCKBRIDGE
THOUSANDS OF LEADERS AND TEAMS IMPACTED BY IMMERSIVE LEARNING & GROWTH

MORE THAN $6 MILLION INVESTED IN INNOVATIVE CANCER RESEARCH
DRIVING COLLABORATIVE CANCER RESEARCH ACROSS THE COUNTRY
2022 ESG REPORT | 67

68 | ROCKBRIDGE
Strategic objectives & well-defined initiatives allow us to adapt quickly to changes in the market and industry.
2022 ESG REPORT | 69

70 | ROCKBRIDGE
Resilience
Resilience, at Rockbridge, comes from people that care about doing work that matters. This approach has allowed us to deliver strong returns through many industry cycles and disruptions. That resilience comes from well-defined objectives and a planful approach to the future.
At Rockbridge, after more than two decades in business, we’ve learned that slow plus slow can often equal fast.

2022 ESG REPORT | 71
DEEPENING OUR ESG COMMITMENTS

One goal of Rockbridge’s ESG platform is the review and formalization of Rockbridge’s ESG-related frameworks and written commitments. This includes reviewing and updating existing practices and procedures at Rockbridge, as well as establishing new written guidelines for our ESG work, particularly related to environmental sustainability and diversity, equity, and inclusion. We are a process-driven company. Implementing procedural frameworks and clearly articulating our commitments are important to codify the thought we have put into the formalization of our ESG platform, while holding ourselves accountable for continuing this work in the future.
The Firm’s resilience stems from thoughtful protocols that we have established over more than two decades in business. These protocols are informed by the commitments we make. When new challenges arise, new protocols are formed, and as a result, our business grows stronger. We will take the same approach with our ESG commitments and protocols, allowing each new challenge we face today to inform and refine our approach for tomorrow.
72 | ROCKBRIDGE
The thoughtful identification and relentless pursuit of opportunities has always been a part of Rockbridge’s DNA — in the way we invest, and in the way we conduct business. Transparent strategic objectives and well-defined improvement initiatives ensure a planful approach, and help us respond to change in the market and our industry. Resilience then becomes a natural by-product of the process.
—Opal Brown, Director, Strategic Planning

2022 ESG REPORT | 73

74 | ROCKBRIDGE
Future Initiatives
We are proud of our efforts and look forward to the journey ahead as we diligently pursue opportunities to improve. We have identified the following areas to focus our attention in the coming years, and will continue to report on all aspects of our ESG platform.
DATA ACCESS & DATA QUALITY
> Expand energy data aggregation and benchmarking capabilities through partnerships
> Define and quantify investments in high-performance building upgrades and other ESG initiatives during renovation and construction projects (RBHD collaboration)
> Collect and monitor hotel waste data and waste diversion rates
> Calculate Scope 1, 2, and 3 greenhouse gas emissions in accordance with federal reporting requirements
> Supplement analytical methods for quantifying physical and transitional climate risks
> Continue to survey Rockbridge hotel portfolio on relevant ESG best practices
BUSINESS INTEGRATION
> Identify and address opportunities to drive hotel demand and enhance hotel profitability through ESG initiatives (RBHM collaboration)
> Supplement pre-acquisition ESG analysis tools and Investment Committee review process
> Support DEI commitment and implement strategies to improve Firm-wide DEI processes, including hiring practices (interview training, candidate debrief guidelines, talent pipeline expansion) and DEI programming (women’s leadership summit, engagement in local community)
> Review and expand green tenant initiatives at Rockbridge headquarters ("RBHQ")
REPORTING AND COMMUNICATION
> Evaluate reporting gaps for additional ESG frameworks, including the United Nations Sustainable Development Goals
> Advocate for ESG progress in the hotel industry and share ESG best practices with partners
> Catalogue ESG case studies throughout the Rockbridge portfolio that can be replicated and scaled
ESG PLATFORM OPERATIONS
> Expand ESG team reporting structure
> Document and communicate additional ESG Firm-wide protocols
> Build ESG data warehouse and improve internal ESG data organization processes
> Collaborate with We Rock team to support ongoing community engagement and social impact initiatives
2022 ESG REPORT | 75
THE PATH FORWARD
ESG becomes complicated when the details eclipse the substance. So, at Rockbridge, we aim to keep ESG simple through care and communication — with our work, with others, and with ourselves. The first steps we have taken to formalize our ESG commitment and establish baseline ESG performance are exciting progress, but we know we have only just begun to scratch the surface of the possibilities that lie ahead. We look forward to strengthening our ESG platform to continue unlocking value and maximizing impact for our investors, our partners, and for the communities in which we do business.
Please direct all questions and comments to esg@rockbridgecapital.com.
Relevance Responsibility Relationships & Resilience
76 | ROCKBRIDGE
When we care deeply, communicate honestly, and accept the good in others, we invite the world to be a little better — in ESG, as in life.
 —Grant
2022 ESG REPORT | 77
Behnke, Director, ESG

78 | ROCKBRIDGE
SUPPLEMENTAL INFORMATION
APPENDIX A
Environmental Performance Tables
APPENDIX B
Sustainability Accounting Standards

Board – Real Estate Disclosure
APPENDIX C | 88
Pillars of Rockbridge
Corporate Governance
APPENDIX D | 90
Schedule of Active Investments
as of December 31, 2021
APPENDIX E | 92
Reporting Scope Detail for
Property-Level Data
2022 ESG REPORT | 79
APPENDIX A - ENVIRONMENTAL PERFORMANCE TABLES
“Energy” reflects the sum of natural gas use and electricity use, using kilowatt hours as a standardized unit of measurement.
STATISTICS (LIKE-FOR-LIKE)
80 | ROCKBRIDGE
ENERGY USE - ABSOLUTE CONSUMPTION 2015 2016 2017 2018 2019 2020 2021 No. of Assets 17 29 30 31 34 39 43 Electricity (kWh) 71,841,508 104,404,579 96,842,928 95,202,024 97,548,692 90,373,597 115,474,649 per ORN 65.83 62.99 57.60 54.58 53.34 89.86 62.14 per GSF 17.74 17.57 16.95 17.43 16.84 13.26 14.95 Natural Gas (therms) 2,126,526 2,830,175 2,617,759 2,311,228 2,421,889 1,732,647 2,358,600 per ORN 1.95 1.71 1.56 1.33 1.32 1.72 1.27 per GSF 0.52 0.48 0.46 0.42 0.42 0.25 0.31 Energy (kWh) 134,148,943 187,328,996 173,543,518 162,921,239 168,510,294 141,140,339 184,581,866 per ORN 122.93 113.02 103.22 93.40 92.14 140.33 99.33 per GSF 33.12 31.52 30.38 29.83 29.09 20.71 23.90
ENERGY USEDESCRIPTIVE
2016 2017 2018 2019 2020 2021 Sample Size (n) 16 27 21 28 31 35 kWh | Current Year 129,638,028 158,360,148 123,122,422 145,053,025 114,487,230 154,138,511 kWh | Prior Year 130,483,563 159,917,558 123,238,804 151,648,485 150,796,881 134,112,809 ORNs | Current Year 1,038,353 1,505,782 1,195,903 1,529,546 787,959 1,469,561 ORNs | Prior Year 1,009,735 1,473,730 1,188,578 1,562,618 1,632,549 907,766 GSF 3,874,236 5,231,628 3,937,641 4,975,484 5,316,791 6,486,828 Descriptive Statistics - Area-Normalized Energy Consumption (kWh / GSF) - Current Year Mean, Weighted (x̄) 33.46 30.27 31.27 29.15 21.53 23.76 Std. Dev. (s) 7.73 9.07 11.11 9.98 6.19 6.88 Median 32.32 30.50 28.53 27.96 20.28 22.50 Minimum 13.22 13.61 13.60 10.30 10.89 10.39 Maximum 45.32 56.41 60.64 61.54 35.66 41.37 Descriptive Statistics - Area-Normalized Energy Consumption (kWh / GSF) - Prior Year Mean, Weighted (x̄) 33.68 30.57 31.30 30.48 28.36 20.67 Std. Dev. (s) 7.40 9.12 10.31 10.13 7.66 6.19 Median 33.97 31.17 30.25 28.15 26.77 19.87 Minimum 13.67 13.22 13.16 13.60 10.30 10.28 Maximum 45.42 57.92 56.41 60.64 46.33 35.66 Like-For-Like, Year-Over-Year Change (weighted x̄ kWh / GSF) Δ | Absolute (0.22) (0.30) (0.03) (1.33) (6.83) 3.09 Δ | Percent -0.65% -0.97% -0.09% -4.35% -24.08% 14.93%
APPENDIX A - ENVIRONMENTAL PERFORMANCE TABLES (CONTINUED)
2022 ESG REPORT | 81
WATER USE - ABSOLUTE CONSUMPTION 2015 2016 2017 2018 2019 2020 2021 No. of Assets 17 29 30 31 34 39 43 Water + Sewer (Gal) 217,324,815 322,921,569 299,127,302 296,160,871 291,105,151 220,316,950 339,684,028 per ORN 199.15 194.83 177.91 169.79 159.17 219.06 182.79 per GSF 53.65 54.34 52.36 54.23 50.26 32.33 43.98 WATER USE - DESCRIPTIVE STATISTICS (LIKE-FOR-LIKE) 2016 2017 2018 2019 2020 2021 Sample Size (n) 16 27 21 28 31 35 Gal | Current Year 201,999,523 274,143,542 213,340,630 249,742,060 167,244,905 268,925,973 Gal | Prior Year 196,141,931 279,675,738 217,830,640 266,330,508 257,523,392 205,261,659 ORNs | Current Year 1,038,353 1,505,782 1,195,903 1,529,546 787,959 1,469,561 ORNs | Prior Year 1,009,735 1,473,730 1,188,578 1,562,618 1,632,549 907,766 GSF 3,874,236 5,231,628 3,937,641 4,975,484 5,316,791 6,486,828 Descriptive Statistics - Occupancy-Normalized Water Consumption Mean, Weighted (x̄) 194.54 182.06 178.39 163.28 212.25 183.00 Std. Dev. (s) 89.82 80.30 74.63 66.40 112.06 96.14 Median 166.04 167.10 152.83 150.68 179.69 147.97 Minimum 92.28 33.83 77.83 63.39 75.59 39.68 Maximum 443.35 375.74 312.52 310.78 471.58 402.71 Descriptive Statistics - Occupancy-Normalized Water Consumption Mean, Weighted (x̄) 194.25 189.77 183.27 170.44 157.74 226.12 Std. Dev. (s) 80.68 83.83 83.79 68.65 56.04 135.74 Median 173.35 163.75 167.10 147.44 149.93 195.96 Minimum 88.77 80.82 76.43 71.11 88.38 17.30 Maximum 430.45 443.35 375.74 312.52 297.67 625.85 Like-For-Like, Year-Over-Year Change (weighted x̄ Gal / ORN) Δ | Absolute 0.29 (7.71) (4.88) (7.16) 54.51 (43.12) Δ | Percent 0.15% -4.06% -2.66% -4.20% 34.55% -19.07%
APPENDIX A - ENVIRONMENTAL PERFORMANCE TABLES (CONTINUED)
82 | ROCKBRIDGE
GHG EMISSIONS - ABSOLUTE EMISSIONS 2017 2018 2019 2020 2021 No. of Assets 24 25 27 32 363 GHG Emissions (kgCO2e) 52,109,114 57,167,769 58,611,657 46,828,293 64,811,777 per ORN 38.75 38.66 37.73 56.37 42.43 per GSF 11.58 11.81 11.51 8.69 9.93 GHG EMISSIONS - DESCRIPTIVE STATISTICS (LIKE-FOR-LIKE) 2018 2019 2020 2021 Sample Size (n) 21 28 31 35 kgCO2e | Current Year 44,841,900 49,990,805 36,670,597 48,401,738 kgCO2e | Prior Year 45,776,421 52,181,544 46,679,345 44,287,522 ORNs | Current Year 1,157,519 1,226,556 604,675 1,182,388 ORNs | Prior Year 1,149,501 1,274,039 1,255,079 732,799 GSF 3,857,990 4,288,620 4,150,824 5,058,930 Descriptive Statistics - Area-Normalized Energy Consumption (kgCO2e / GSF) - Current Year Mean, Weighted (x̄) 11.62 11.66 8.83 9.57 Std. Dev. (s) 3.46 3.29 2.90 3.03 Median 11.50 11.24 8.59 9.85 Minimum 4.88 4.09 3.61 4.49 Maximum 18.24 17.57 13.39 16.61 Descriptive Statistics - Area-Normalized Energy Consumption (kgCO2e / GSF) - Prior Year Mean, Weighted (x̄) 11.87 12.17 11.25 8.75 Std. Dev. (s) 3.49 3.21 3.69 3.00 Median 11.48 12.34 10.63 8.96 Minimum 5.94 6.32 4.09 3.82 Maximum 18.75 18.24 17.57 15.45 Like-For-Like, Year-Over-Year Change (weighted x̄ kgCO2e / GSF) Δ | Absolute (0.24) (0.51) (2.41) 0.81 Δ | Percent -2.04% -4.20% -21.44% 9.29%
APPENDIX A - ENVIRONMENTAL PERFORMANCE TABLES (CONTINUED)
2022 ESG REPORT | 83
ENERGY USE - INDEX TREND 2015 2016 2017 2018 2019 2020 2021 Total Trend Group Measure - kWh / GSF 7-Year Trend (10 Hotels) 34.37 33.72 34.17 33.91 32.43 24.57 28.19 6-Year Trend (4 Hotels) 23.01 21.82 22.69 19.54 16.10 19.80 5-year Trend (1 Hotel) 13.16 13.60 13.92 10.89 11.86 4-year Trend (7 Hotels) 29.14 29.04 21.68 24.39 3-Year Trend (5 Hotels) 27.58 19.80 23.25 2-Year Trend (8 Hotels) 17.80 19.94 Total Trend Group Measure - kWh / GSF (Index) 7-Year Trend (10 Hotels) 100.00 98.12 99.43 98.68 94.35 71.49 82.01 6-Year Trend (4 Hotels) 100.00 94.82 98.63 84.92 69.99 86.05 5-year Trend (1 Hotel) 100.00 103.40 105.78 82.77 90.14 4-year Trend (7 Hotels) 100.00 99.66 74.39 83.69 3-Year Trend (5 Hotels) 100.00 71.78 84.30 2-Year Trend (8 Hotels) 100.00 112.08 WATER USE - INDEX TREND 2015 2016 2017 2018 2019 2020 2021 Total Trend Group Measure - Gal / ORN 7-Year Trend (10 Hotels) 195.86 189.26 181.29 170.13 157.11 225.53 180.04 6-Year Trend (4 Hotels) 190.14 179.35 187.44 202.09 357.16 230.55 5-year Trend (1 Hotel) 91.23 90.86 88.38 107.58 97.60 4-year Trend (7 Hotels) 175.70 169.58 206.83 176.54 3-Year Trend (5 Hotels) 132.72 160.56 123.76 2-Year Trend (8 Hotels) 243.69 218.29 Total Trend Group Measure - Gal / ORN (Index) 7-Year Trend (10 Hotels) 100.00 96.63 92.56 86.86 80.21 115.15 91.92 6-Year Trend (4 Hotels) 100.00 94.33 98.58 106.29 187.84 121.26 5-year Trend (1 Hotel) 100.00 99.60 96.87 117.92 106.99 4-year Trend (7 Hotels) 100.00 96.52 117.72 100.48 3-Year Trend (5 Hotels) 100.00 120.97 93.24 2-Year Trend (8 Hotels) 100.00 89.58 GHG EMISSIONS - INDEX TREND 2017 2018 2019 2020 2021 Total Trend Group Measure - kgCO2e / GSF 5-year Trend (14 Hotels) 11.86 11.39 10.81 8.63 9.46 4-year Trend (3 Hotels) 14.00 13.73 10.16 11.20 3-Year Trend (4 Hotels) 11.49 9.21 10.22 2-Year Trend (7 Hotels) 7.86 8.38 Total Trend Group Measure - kgCO2e / GSF (Index) 5-year Trend (14 Hotels) 100.00 96.02 91.13 72.73 79.74 4-year Trend (3 Hotels) 100.00 98.07 72.61 79.99 3-Year Trend (4 Hotels) 100.00 80.15 88.91 2-Year Trend (7 Hotels) 100.00 106.50 WATER WATER
APPENDIX A - ENVIRONMENTAL PERFORMANCE TABLES (CONTINUED)
BASELINE WATER STRESS STRATIFICATION (AS OF YEAR-END 2021)
Baseline water stress measures the ratio of total water withdrawals (domestic, industrial, irrigation, and livestock consumptive and nonconsumptive) to available renewable surface and groundwater supplies. Available renewable water supplies include the impact of upstream consumptive water users and large dams on downstream water availability.
Special note: The Laylow - Honolulu, HI, does not have water stress data available. Water stress in small islands is very difficult to model because small islands are not part of a watershed.
FLOOD HAZARD AREA STRATIFICATION
(AS OF YEAR-END 2021)
Special flood hazard areas (SFHAs), or floodplains, are high risk areas that will be inundated by a flood event that has a
annual chance of being equaled or exceeded in any given year. The 1-percent annual chance flood is also referred to as the base flood or 100-year flood.
Zone AE: Low-lying areas that are in close proximity to lakes, ponds and other large bodies of water and vulnerable to stillwater flooding.
Zone VE: Coastal regions that experience annual flash flooding, hurricanes, storm-induced waves, and other weather-related hazards.
84 | ROCKBRIDGE
TOTAL EQUITY DEBT Water Stress Classification Count % GSF % Count % GSF % Count % GSF % Low (<10%) 32 43% 4,811,078 40% 28 50% 4,516,600 46% 4 21% 294,478 14% Low - Medium (10-20%) 6 8% 1,658,227 14% 5 9% 1,579,284 16% 1 5% 78,943 4% Medium - High (20-40%) 23 31% 3,840,756 32% 14 25% 2,615,826 27% 9 47% 1,224,930 56% High (40-80%) 4 5% 545,648 5% 3 5% 456,758 5% 1 5% 88,890 4% Extremely High (>80%) 9 12% 952,501 8% 5 9% 466,397 5% 4 21% 486,104 22% No Data 1 1% 176,332 1% 1 2% 176,332 2% - 0% - 0% Total - Full Portfolio 75 100% 11,984,542 100% 56 100% 9,811,197 100% 19 100% 2,173,345 100%
TOTAL EQUITY DEBT Flood Zone Hazard Code Count % GSF % Count % GSF % Count % GSF % B and X 53 71% 8,863,146 74% 43 77% 7,901,468 81% 10 53% 961,678 44% C and X 7 9% 674,794 6% 5 9% 422,691 4% 2 11% 252,103 12% AE 9 12% 1,393,558 12% 5 9% 704,411 7% 4 21% 689,147 32% VE, V1-30 3 4% 477,981 4% 1 2% 265,827 3% 2 11% 212,154 10% D 3 4% 575,063 5% 2 4% 516,800 5% 1 5% 58,263 3% Total - Full Portfolio 75 100% 11,984,542 100% 56 100% 9,811,197 100% 19 100% 2,173,345 100%
1%
APPENDIX B - SUSTAINABILITY ACCOUNTING STANDARDS BOARD:
2022 ESG REPORT | 85
PORTFOLIO 2021 SASB CODE ACCOUNTING METRIC UNIT OF MEASURE PROPERTY SUBSECTOR RESPONSE (IF APPLICABLE) IF-RE-000.A Number of assets, Number Equity Lodging / Resorts 54 by property subsector Operational 49 New Construction 3 Major Redevelopment 2 Equity Residential 2 Mortgage Commercial Financing 19 Total 75 IF-RE-000.B Leasable floor area, Gross square feet (ft²) Equity Lodging / Resorts 9,420,405 by property subsector Operational 8,775,511 New Construction 399,122 Major Redevelopment 245,772 Equity Residential 390,792 Mortgage Commercial Financing 2,173,345 Total 11,984,542 IF-RE-000.C Percentage of indirectly managed Percentage (%) Equity Lodging / Resorts 100% assets, by property subsector by floor area Operational 100% New Construction 100% Major Redevelopment 100% Equity Residential 100% Mortgage Commercial Financing 100% Total 100% IF-RE-000.D Average occupancy rate, Percentage (%) Equity Lodging / Resorts 53% by property subsector Operational 53% New Construction N/A Major Redevelopment N/A Equity Residential 91% Mortgage Commercial Financing 52% Total 54% ENERGY MANAGEMENT SASB CODE ACCOUNTING METRIC UNIT OF MEASURE PROPERTY SUBSECTOR RESPONSE (IF APPLICABLE) IF-RE-130a.1 Energy consumption data Percentage (%) Equity Lodging / Resorts 96% coverage as a percentage of total by floor area Operational 100% floor area, by property subsector New Construction 0% Major Redevelopment 100% Equity Residential 0% Mortgage Commercial Financing 0% Total 75% IF-RE-130a.2(i) Total energy consumed by Gigajoules (GJ) Equity Lodging / Resorts - 717,366 portfolio area with data coverage Operational IF-RE-130a.2(ii) Percentage grid electricity, Percentage (%) Equity Lodging / Resorts - 100% by property subsector Operational IF-RE-130a.2(iii) Percentage renewable energy, Percentage (%) Equity Lodging / Resorts - 0% by property subsector Operational
ROCKBRIDGE
DISCLOSURE
REAL ESTATE
APPENDIX B - SUSTAINABILITY ACCOUNTING STANDARDS BOARD: REAL ESTATE DISCLOSURE (CONTINUED)
ENERGY MANAGEMENT (CONTINUED)
IF-RE-130a.3
Like-for-like percentage change Percentage (%) Equity Lodging / Resorts - 14.9% in energy consumption for the Operational portfolio area with data coverage, by property subsector
IF-RE-130a.4(i) Percentage of eligible portfolio Percentage (%) Equity Lodging / Resorts - 100% that has an energy rating, by floor area Operational by property subsector
IF-RE-130a.4(ii) Percentage of eligible portfolio Percentage (%) Equity Lodging / Resorts - 0% that is certified to ENERGY by floor area Operational STAR, by property subsector
IF-RE-130a.5 Description of how building energy N/A
Rockbridge pursues high-performance building management considerations are upgrades and energy efficiency strategies integrated into property investment throughout the investment process when analysis and operational strategy practicable, both in the building’s physical shell and its ongoing operations. See pgs. 37-45 for further detail.
WATER MANAGEMENT
withdrawal data coverage
as a percentage of floor area in by floor area
regions with High or Extremely
High Baseline Water Stress,
Total water withdrawn by portfolio Thousand cubic
/ Resorts - 1,375 area with data coverage, by meters (10³ m³)
property subsector IF-RE-140a.2(ii) Water withdrawal percentage in Percentage (%)
/ Resorts - 13.6% regions with High or Extremely
High Baseline Water Stress, by property subsector
Like-for-like percentage change Percentage (%)
/ Resorts - 31.0% in water withdrawn for portfolio
area with data coverage, by property subsector
IF-RE-140a.4 Description of water management N/A
Rockbridge reviews water-specific analytics and risks and discussion of strategies pursues water efficiency upgrades throughout and practices to mitigate those risks the investment process when practicable, both in the building’s physical shell and its ongoing operations. See pgs. 37-45 for further detail.
86 | ROCKBRIDGE
SASB CODE ACCOUNTING METRIC UNIT OF MEASURE PROPERTY SUBSECTOR RESPONSE
APPLICABLE)
(IF
SASB CODE ACCOUNTING METRIC UNIT OF MEASURE PROPERTY SUBSECTOR RESPONSE (IF APPLICABLE) IF-RE-140a.1(i) Water withdrawal data coverage Percentage (%) Equity Lodging / Resorts 96% as a percentage of total floor area, by floor area Operational 100%
New Construction 0% Major Redevelopment 100% Equity Residential 0% Mortgage Commercial Financing 0% Total 75% IF-RE-140a.1(ii)
Equity Lodging / Resorts 100%
Operational 100%
New Construction N/A
Major Redevelopment 100%
Equity Residential N/A Mortgage Commercial Financing 0% Total 62% IF-RE-140a.2(i)
Operational
Operational
Operational
by property subsector
Water
Percentage (%)
by property subsector
Equity Lodging
Equity Lodging
IF-RE-140a.3
Equity Lodging
APPENDIX B - SUSTAINABILITY ACCOUNTING STANDARDS BOARD: REAL ESTATE DISCLOSURE (CONTINUED)
MANAGEMENT OF TENANT SUSTAINABILITY IMPACTS
IF-RE-410a.1(i) Percentage of new leases that Percentage (%) Equity Lodging / Resorts - N/A contain a cost recovery clause by floor area Operational for resource efficiency-related capital improvements, by property subsector
IF-RE-410a.1(ii) Associated leased floor area, Gross square feet (ft²) Equity Lodging / Resorts - N/A by property subsector Operational
IF-RE-410a.2(i) Percentage of tenants that are Percentage (%) Equity Lodging / Resorts - 55% separately metered or by floor area Operational submetered for grid electricity consumption, by property subsector
IF-RE-410a.2(ii) Percentage of tenants that are Percentage (%) Equity Lodging / Resorts - 38% separately metered or by floor area Operational submetered for water withdrawals, by property subsector
IF-RE-410a.3
Discussion of approach to N/A
Rockbridge designs hotel properties and works measuring, incentivizing, and with hotel operators and utility consultants to improving sustainability impacts ensure submetering plans for 3rd-party tenants of tenants are effective. Rockbridge will explore opportunities to further engage and incentivize tenants on sustainability impacts in the future.
CLIMATE CHANGE ADAPTATION
IF-RE-450a.2
Description of climate change risk N/A
Rockbridge has added climate-specific metrics exposure analysis, degree of to its portfolio management strategy and is systematic portfolio exposure, exploring further opportunities to assess, and strategies for mitigating risks mitigate, and adapt to relevant physical climate hazards and climate transition risks. Rockbridge’s cross-functional ESG team, formed in 2021, will continue to review and implement climate risk mitigation strategies.
2022 ESG REPORT | 87
SASB CODE ACCOUNTING METRIC UNIT OF MEASURE PROPERTY SUBSECTOR RESPONSE
APPLICABLE)
(IF
SASB CODE ACCOUNTING METRIC UNIT OF MEASURE PROPERTY SUBSECTOR RESPONSE (IF APPLICABLE) IF-RE-450a.1 Area of properties
Equity Lodging / Resorts 970,238 100-year
zones, Operational 879,238 by property subsector New Construction 91,000 Major RedevelopmentEquity ResidentialMortgage Commercial Financing 901,301 Total 1,871,539
located in Gross square feet (ft²)
flood
APPENDIX C - PILLARS OF ROCKBRIDGE CORPORATE GOVERNANCE
TRANSPARENT & TIMELY REPORTING
Investment Reporting
Investment reporting published on quarterly and annual basis, including fund progress, financial return profile, and narrative commentary; unaudited financial statements issued quarterly, which includes review and approval of fair asset values by Valuation Committee.
Investor Relations
Financial Audits
Tax Compliance
ESG Reporting
ETHICS & COMPLIANCE
Compliance Leadership
Required Disclosures & Training
Formal investor meeting held annually; timely responses to investor questions and DDQs.
All client investment vehicles undergo annual financial statement audit by a PCAOB-certified audit firm, including audit of fair asset values; 100% unqualified opinions in 2021.
Regular tax filings for corporate and investment entities; investor tax data provided via secure system; corporate and project-level tax incentives undergo initial review and ongoing compliance review.
Rockbridge ESG report aligns with international accounting standards and industry goals; ESG report to be updated on an regular basis.
Documented Protocol
Whistleblower Policy
Full-time Chief Compliance Officer (CCO) is a member of Rockbridge’s Risk Management team and serves on Rockbridge’s Leadership Team.
All corporate employees are subject to quarterly and annual compliance disclosures and affirmations; annual compliance training is supplemented by regular, focused compliance reminders; thorough new hire compliance intake process established.
Rockbridge Code of Ethics, Compliance Manual, and Restricted Securities List are reviewed and updated regularly, and apply to all corporate employees.
Rockbridge maintains a whistleblower policy. Employees can discuss perceived Federal Securities Laws issues orally or via written disclosure with the CCO, or anonymously through a compliance monitoring platform. Employees may also file a complaint with the SEC.
Management of Conflicts of Interest
Extensive oversight for outside business activities, political contributions, personal trading, gifts and entertainment, third party documentation, fund expense management, and investment allocation procedures, among others.
RISK MANAGEMENT & INVESTMENT OVERSIGHT
SEC-Registered Firm
Fundraising Oversight
Rockbridge is a Registered Investment Advisor with Securities & Exchange Commission.
Fundraising materials and/or securities offerings undergo additional third-party compliance audits and legal review.
Investment Screening Fund investments require presentation to and formal approval by Rockbridge’s investment committee.
Risk Management
Legal Diligence
Significant in-house expertise across risk management and legal functions is integrated with Rockbridge’s investment structuring, transaction execution, fundraising, and corporate finance functions.
Thorough review of legal risks (pre-acquisition and ongoing), including environmental factors, insurance requirements, business licensing, intellectual property, and key personnel background checks.
88 | ROCKBRIDGE
APPENDIX C - PILLARS OF ROCKBRIDGE CORPORATE GOVERNANCE (CONTINUED)
DATA PROTECTION & SECURE BUSINESS OPERATIONS
Fraud Prevention Dedicated corporate treasury team follows fraud prevention policies and financial controls, including verbal verification procedures; alert process in place for phishing or fraud attempts.
Document Management
Digital Data Security
Business Continuity
Litigation Management
Firm-wide record retention policy in place (physical + digital), supplemented by use of secure electronic signatures, secure paper shredding, systematic file organization, and internal file access controls.
Cybersecurity policy includes ongoing risk audits, cloud storage use, vendor review, standard hardware and network security protocol, and protection of personally identifiable or private information.
Significant business disruptions (internal and external) are mitigated by testing, off-site storage, system backups, IT disaster recovery plans, emergency communication protocol, etc.
Notices on outstanding litigation matters provided with in-house counsel oversight, record retention policy accommodates litigation holds; secure digital platform acts as book of record.
STRONG ASSET-LEVEL GOVERNANCE
Utility Benchmarking
Secure Payments
Environmental Management
Anti-Harassment
Anti-Human Trafficking
All properties adhere to data reporting requirements for any and all jurisdiction utility benchmarking ordinances or building efficiency mandates.
Rockbridge requires all hotel operators to comply with payment card industry (PCI) data security standards.
Asset-level Operations and Maintenance (O&M) plans for environmental management and remediation are enacted at acquisition, where applicable.
100% of properties in Rockbridge’s portfolio have a documented anti-harassment policy.
98% of properties in Rockbridge’s portfolio provide human trafficking awareness and prevention training to employees.
2022 ESG REPORT | 89
APPENDIX D - SCHEDULE OF ACTIVE INVESTMENTS AS OF DECEMBER 31, 2021
90 | ROCKBRIDGE DATA AVAILABILITY INVESTMENT DATA SCOPE UTILITY ESG NO. PROPERTY ROOMS GSF TYPE ELIGIBILITY DATA SURVEY 1 Independent - South Atlantic Region 102 71,873 Debt - -2 Independent - South Atlantic Region 156 140,281 Debt - -3 Branded - South Atlantic Region 89 70,570 Equity E A A 4 Branded - Pacific West Region 229 185,492 Equity E A A 5 Independent - Mountain West Region 63 89,181 Debt - -6 Branded - Pacific West Region 153 73,038 Debt - -7 Branded - East North Central Region 153 101,458 Debt - -8 Branded - Middle Atlantic Region 333 178,738 Equity E A A 9 Branded - Middle Atlantic Region 139 88,890 Debt - -10 Branded - East South Central Region 155 171,191 Equity E A A 11 Branded - New England Region 230 203,282 Equity E A A 12 Branded - Mountain West Region 242 190,384 Debt - -13 Branded - South Atlantic Region 180 260,636 Debt - -14 Branded - East North Central Region 251 284,447 Equity E A A 15 Branded - West South Central Region 247 165,060 Equity E A A 16 Independent - South Atlantic Region 212 228,000 Equity E A A 17 Branded - West South Central Region 103 61,719 Debt - -18 Independent - Mountain West Region 154 153,601 Equity E A A 19 Branded - East North Central Region 129 60,184 Debt - -20 Branded - Middle Atlantic Region 146 51,000 Equity E A A 21 Branded - South Atlantic Region 119 51,450 Equity E A22 Branded - East South Central Region 168 116,405 Equity E A A 23 Branded - West South Central Region 291 350,797 Equity E A A 24 Branded - East North Central Region 254 225,043 Equity E A A 25 Branded - East South Central Region 320 182,974 Equity E A A 26 Branded - South Atlantic Region 250 284,068 Equity E A A 27 Branded - West North Central Region 195 108,165 Equity E A A 28 Branded - West South Central Region 171 282,728 Equity E A A 29 Branded - East South Central Region 162 177,032 Equity E A A 30 Branded - Mountain West Region 120 76,294 Equity E A31 Branded - East South Central Region 321 275,000 Equity E A A 32 Branded - East South Central Region 100 62,003 Equity E A A 33 Branded - South Atlantic Region 125 74,017 Debt - -34 Branded - Mountain West Region 108 67,657 Equity E A35 Branded - West South Central Region 207 156,945 Equity E A A 36 Branded - West North Central Region 158 124,472 Equity E A A 37 Independent - Mountain West Region 128 70,345 Non-Operational - -38 Branded - Pacific West Region 122 82,638 Debt - -39 Branded - Pacific West Region 197 98,500 Equity E A A 40 Branded - Middle Atlantic Region 258 124,127 Equity E A A
APPENDIX D - SCHEDULE OF ACTIVE INVESTMENTS AS OF DECEMBER 31, 2021 (CONTINUED)
2022 ESG REPORT | 91
DATA AVAILABILITY INVESTMENT DATA SCOPE UTILITY ESG NO. PROPERTY ROOMS GSF TYPE ELIGIBILITY DATA SURVEY 41 Branded - East North Central Region 316 208,939 Equity E A A 42 Branded - East North Central Region 142 87,808 Equity E A A 43 Branded - South Atlantic Region 177 101,760 Debt - -44 Branded - East North Central Region 172 127,554 Equity E A A 45 Non-Hotel - West South Central Region 186 210,052 Non-Hotel - -46 Branded - South Atlantic Region 294 212,915 Debt - -47 Branded - New England Region 418 265,827 Equity E A A 48 Branded - East South Central Region 302 175,427 Non-Operational - -49 Branded - South Atlantic Region 307 205,240 Equity E A A 50 Branded - South Atlantic Region 279 146,825 Equity E A A 51 Branded - South Atlantic Region 379 227,080 Equity E A A 52 Branded - South Atlantic Region 319 220,626 Debt - -53 Non-Hotel - South Atlantic Region 111 180,740 Non-Hotel - -54 Branded - Pacific West Region 197 78,943 Debt - -55 Branded - East South Central Region 224 168,000 Equity E A A 56 Branded - East North Central Region 175 117,900 Equity E A A 57 Branded - East South Central Region 110 84,952 Equity E A A 58 Branded - South Atlantic Region 159 104,693 Equity E A A 59 Branded - West North Central Region 210 160,216 Development - -60 Branded - West South Central Region 407 465,846 Equity E A A 61 Independent - South Atlantic Region 180 91,000 Development - -62 Branded - East South Central Region 250 215,500 Equity E A A 63 Independent - New England Region 226 262,532 Equity E A A 64 Branded - West South Central Region 196 126,397 Equity E A A 65 Independent - South Atlantic Region 333 265,827 Equity E A A 66 Independent - East North Central Region 198 147,906 Development - -67 Branded - Pacific West Region 251 176,332 Equity E A A 68 Branded - Pacific West Region 92 73,581 Debt - -69 Branded - East South Central Region 300 327,700 Equity E A A 70 Independent - Pacific West Region 161 132,958 Debt - -71 Independent - East South Central Region 82 112,436 Equity E A A 72 Branded - East South Central Region 329 292,958 Equity E A A 73 Branded - West North Central Region 128 75,856 Equity E A A 74 Branded - Pacific West Region 100 58,263 Debt - -75 Branded - New England Region 289 254,268 Equity E A A TOTAL 15,239 11,984,542 49 49 46
APPENDIX E - PROPERTY-LEVEL DATA REPORTING SCOPE DETAIL
DATA INCLUSION SCOPE FOR PROPERTY-LEVEL ESG REPORTING
92 | ROCKBRIDGE DATA CAPTURE RATE (BY GSF) ROCKBRIDGE PORTFOLIO DATA SUBGROUP COUNT UNITS GROSS SQ. FT. % OF TOTAL % OF ELIGIBLE Total Active Investments as of 2021.12.31 75 15,239 11,984,542 100.0% exclude: high-yield debt (19) (3,007) (2,173,345) -18.1% exclude: development (3) (588) (399,122) -3.3% exclude: non-hotel (2) (297) (390,792) -3.3% exclude: non-operational (2) (430) (245,772) -2.1% Eligible Report Scope of Property-Level Data 49 10,917 8,775,511 73.2% 100.0% exclude: no utility data available - - - 0.0% 0.0% Utility Data Available 49 10,917 8,775,511 73.2% 100.0% exclude: non-surveyable assets / no response recorded (3) (347) (195,401) -1.6% -2.2% ESG Survey Results Available 46 10,570 8,580,110 71.6% 97.8%


94 | ROCKBRIDGE

2022 ESG REPORT | 95
Watch what we do next.
96 | ROCKBRIDGE
