15-74
Diagnostics
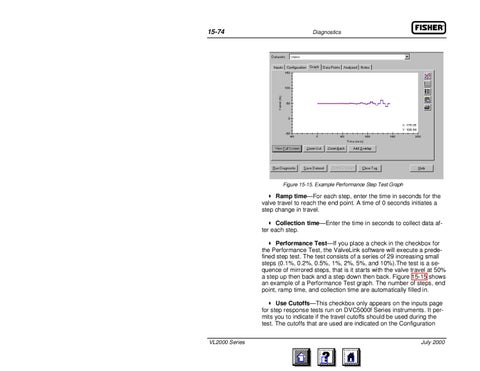
Figure 15-15. Example Performance Step Test Graph
Ramp time—For each step, enter the time in seconds for the valve travel to reach the end point. A time of 0 seconds initiates a step change in travel. Collection time—Enter the time in seconds to collect data after each step. Performance Test—If you place a check in the checkbox for the Performance Test, the ValveLink software will execute a predefined step test. The test consists of a series of 29 increasing small steps (0.1%, 0.2%, 0.5%, 1%, 2%, 5%, and 10%).The test is a sequence of mirrored steps, that is it starts with the valve travel at 50% a step up then back and a step down then back. Figure 15-15 shows an example of a Performance Test graph. The number of steps, end point, ramp time, and collection time are automatically filled in. Use Cutoffs—This checkbox only appears on the inputs page for step response tests run on DVC5000f Series instruments. It permits you to indicate if the travel cutoffs should be used during the test. The cutoffs that are used are indicated on the Configuration VL2000 Series
July 2000