15-65
Diagnostics
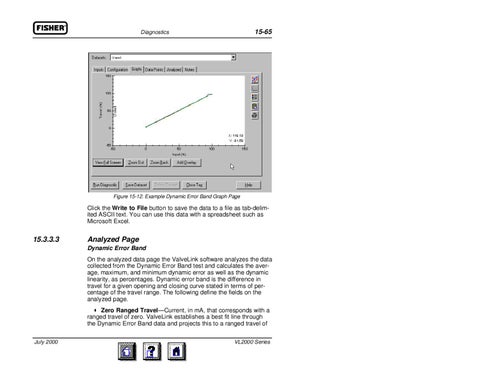
Figure 15-12. Example Dynamic Error Band Graph Page
Click the Write to File button to save the data to a file as tab-delimited ASCII text. You can use this data with a spreadsheet such as Microsoft Excel.
15.3.3.3
Analyzed Page Dynamic Error Band On the analyzed data page the ValveLink software analyzes the data collected from the Dynamic Error Band test and calculates the average, maximum, and minimum dynamic error as well as the dynamic linearity, as percentages. Dynamic error band is the difference in travel for a given opening and closing curve stated in terms of percentage of the travel range. The following define the fields on the analyzed page. Zero Ranged Travel—Current, in mA, that corresponds with a ranged travel of zero. ValveLink establishes a best fit line through the Dynamic Error Band data and projects this to a ranged travel of
July 2000
VL2000 Series