Daylight Studies Concept Studies
Professional Work
- Smithsonian, Washington D.C. - University of Maryland Baltimore County
- UTSW Cancer Center, Dallas TX
Professional Work
- DGS, Richmond, VA - Schematic Design Phase
- DGS, Richmond, VA - Design Development Phase
EUI vs Cost Media Modeling
Professional Work
- Vida & Retama, San Antonio, TX
- Cushing Academy, Ashburnham, MA
Studio Work
- Parametric Variability for Hearst Headquarters, NY
Ecovillage Wellness Retreat
Studio Work
- Chastain Ecovillage
- Living Street Neighborhood - Cabin over Cave
Chastain Golf Course, Atlanta, GA
Studio Work
- Wellness Retreat in the Landscape
Manchester Mill Ruins, Sweetwater Creek Park
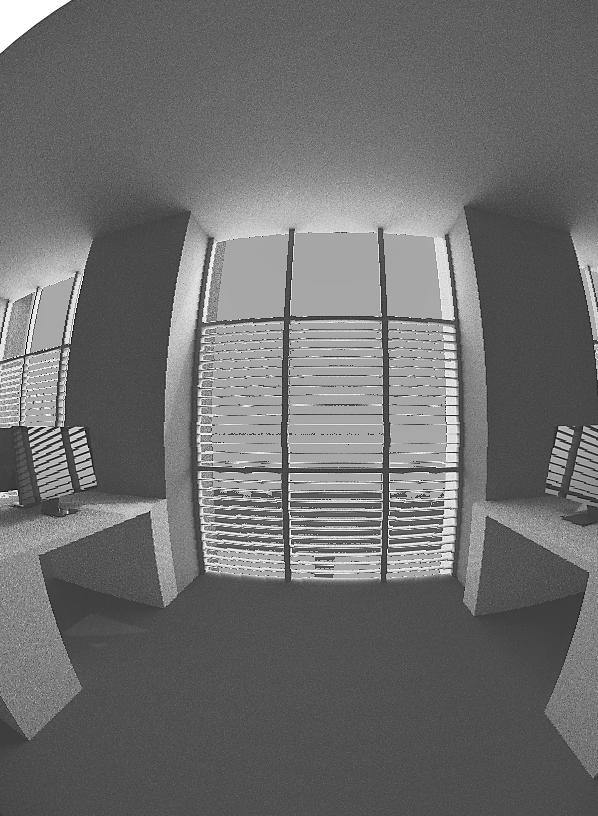
Daylight Studies

Professional Work
Smithsonian, Washington D.C. University of Maryland Baltimore County UTSW Cancer Center, Dallas TX
Mentor: Justin Shultz
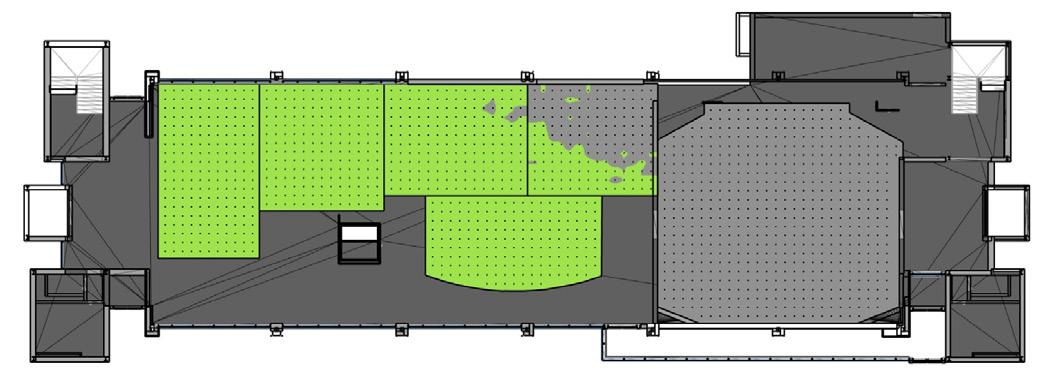
Smithsonian, Washington, D.C.
Work Term & Involvement: Led the sDA Analysis at Green Lab, EYP/A Page Company Phase: Renovation / Existing Building Tools: Climate Studio, Rhino 7
B0 Level


First Level

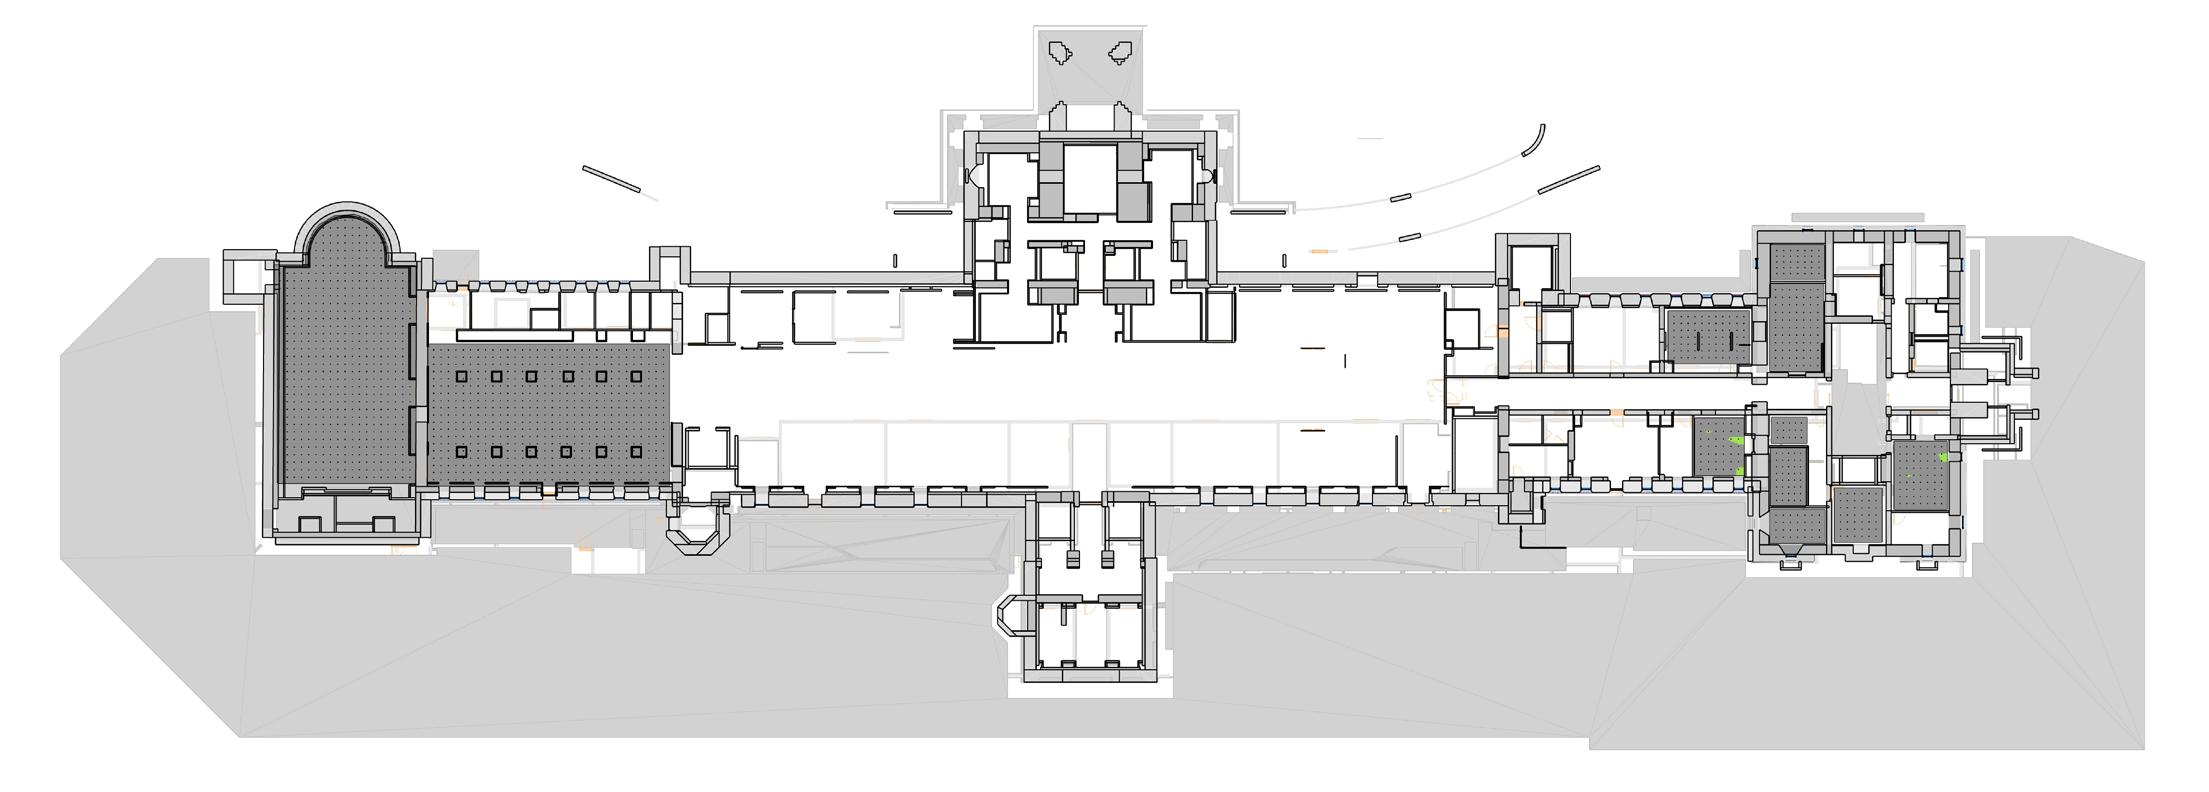
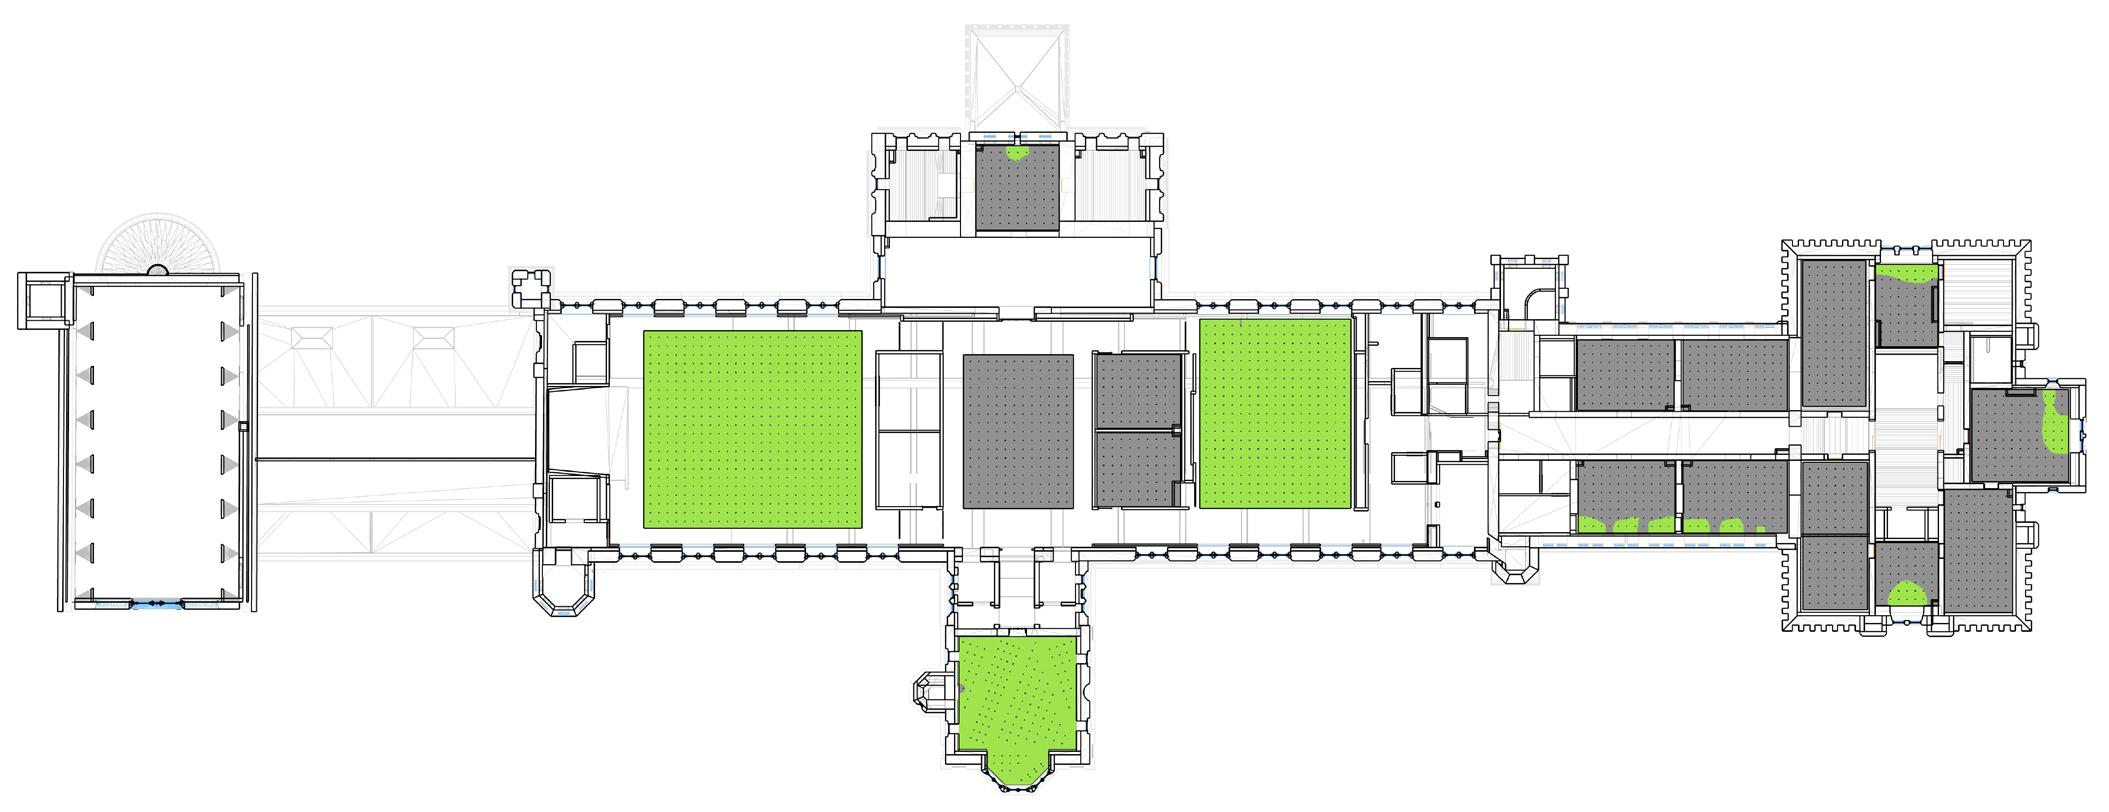
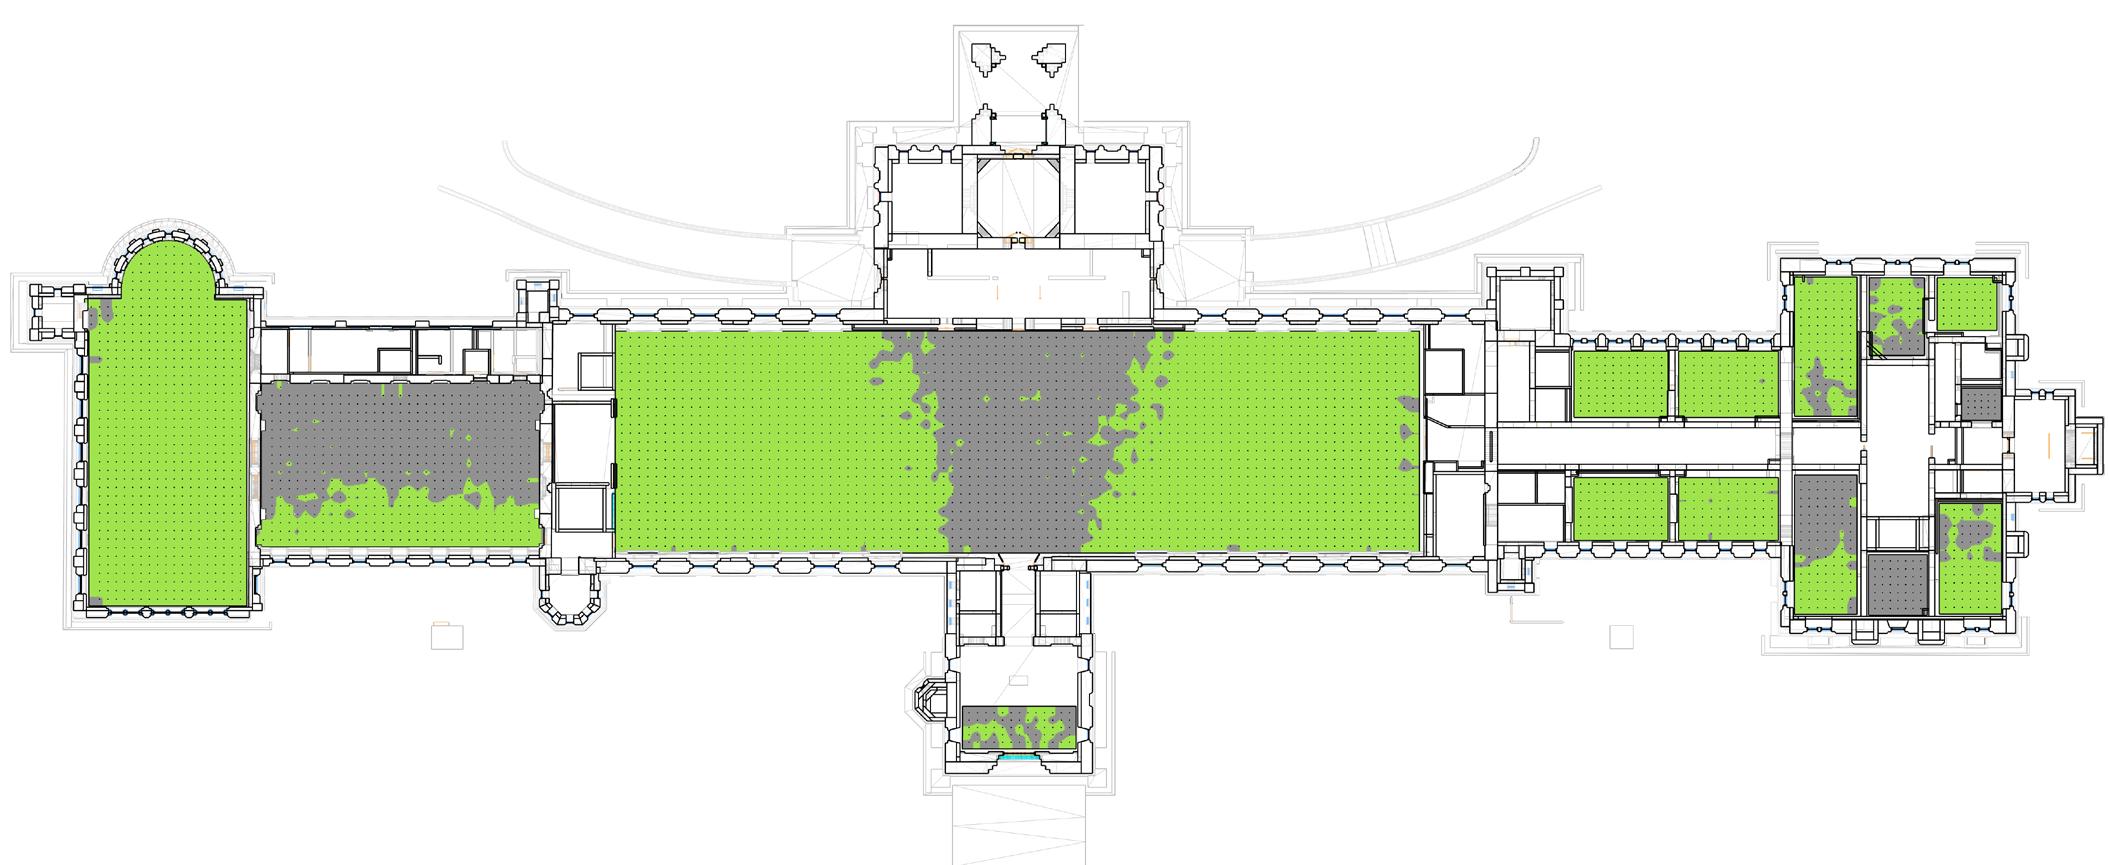
Fourth Level Program: Museum - Gallery, Meeting, & Office Spaces
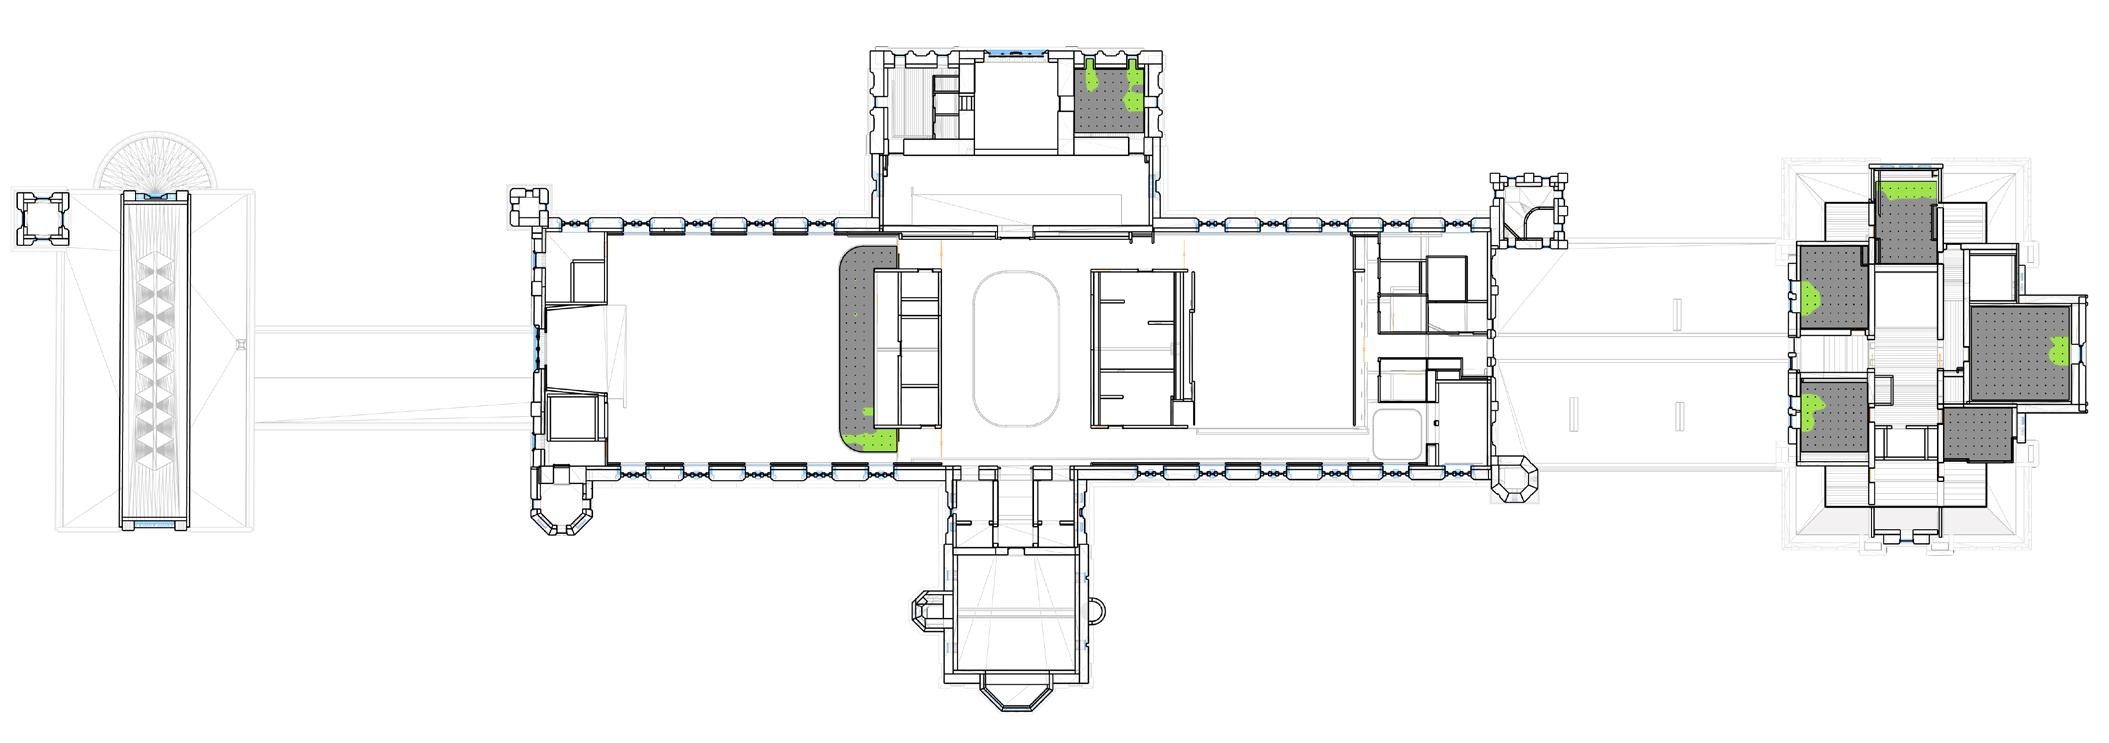
Goal: Calculation Spatial Daylight Autonomy (sDA) for all levels in existing (existing window types) & modified (replacement window types) conditions to evaluate if the project can target for ‘Daylight & Views’ credits in LEED Documentation.
Assumptions:
• Climate Data file of Washington DC is used.
• Floor Levels B1 to 4 are considered.
• Daylight Analysis for regularly occupied areas.
• Existing window types are considered.
• Transmittance value for double glazing: 71% with SHGC: 0.38.
• Information for properties of all materials has been taken from ‘Energy Model Report’ by ‘Loring Consulting Engineers’.
Results & Conclusions:
• Level B1 is not simulated due to the absence of windows.
• Total Spatial Daylight Autonomy (sDA) for Levels B0, B1, 1, 2, 3, and 4: 45.0% with 0 LEED Credits.
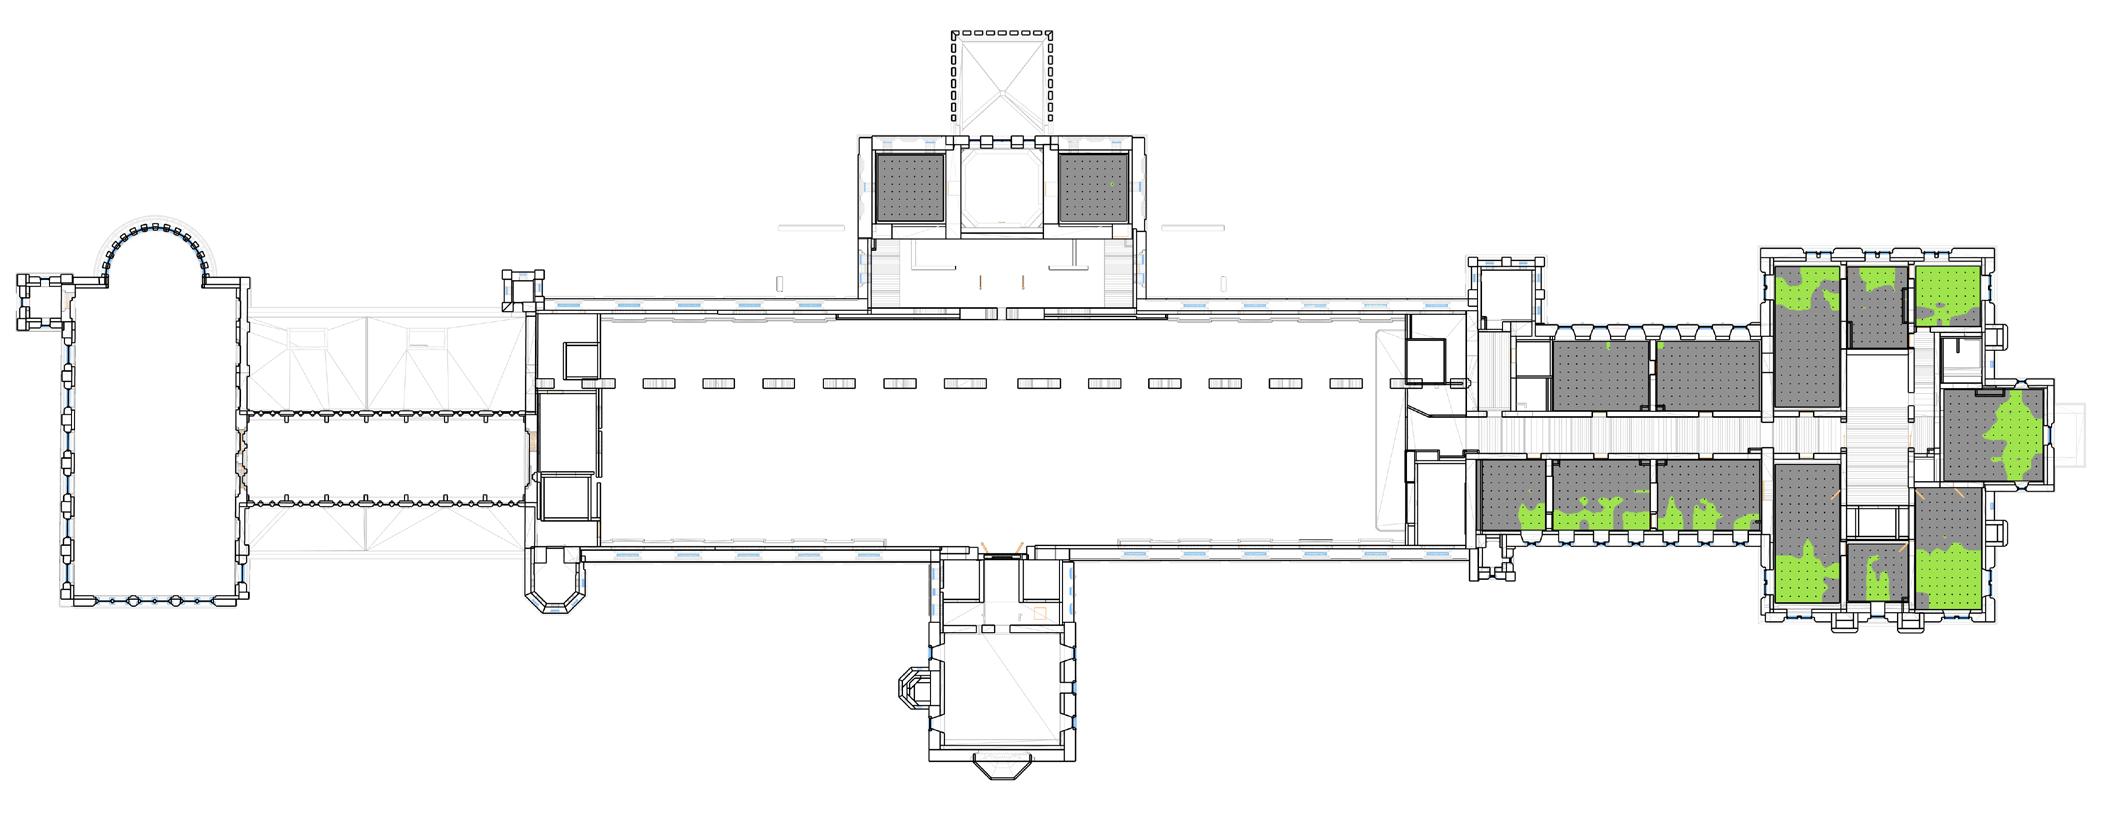
• Level 1 and Level 3 result in the majority of the daylit spaces.
• The sDA will drop further when replacement window types (Divided Lite Windows) substitute the existing window types.
• Under Process: Replacement Window Types are currently being modelled.
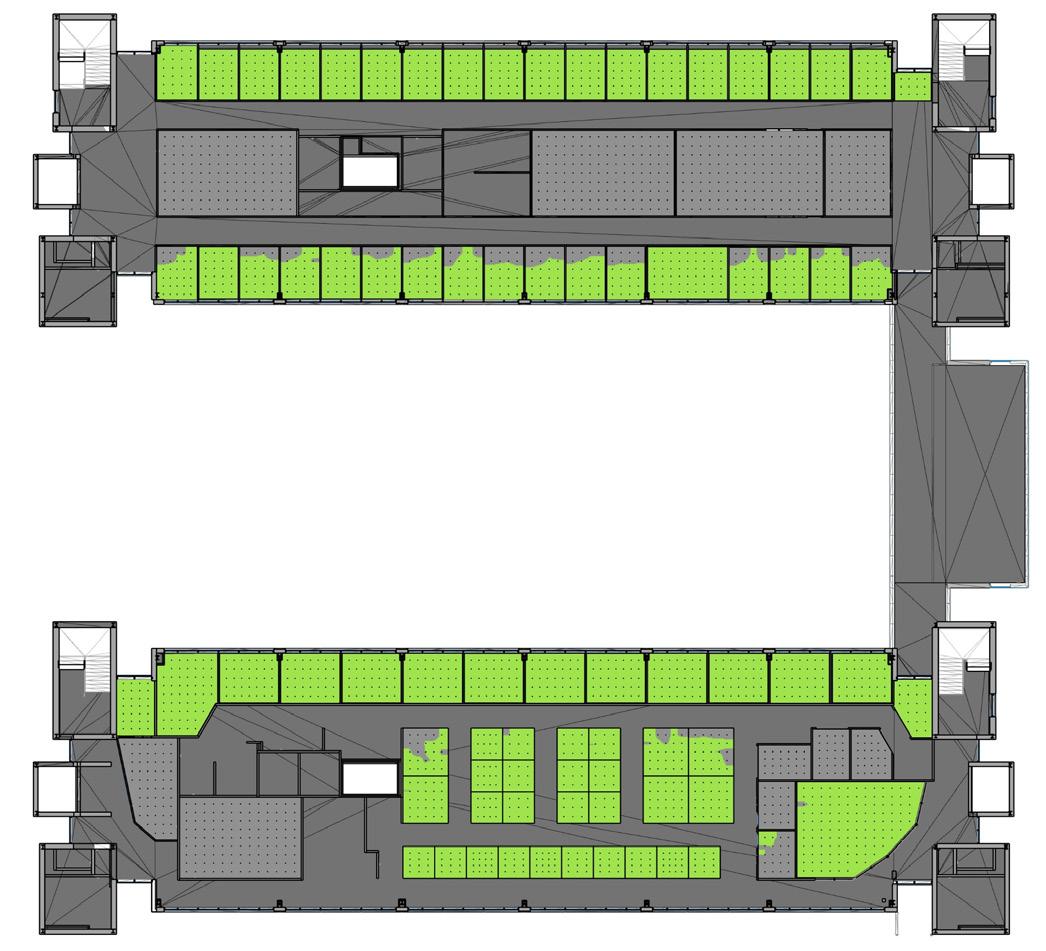
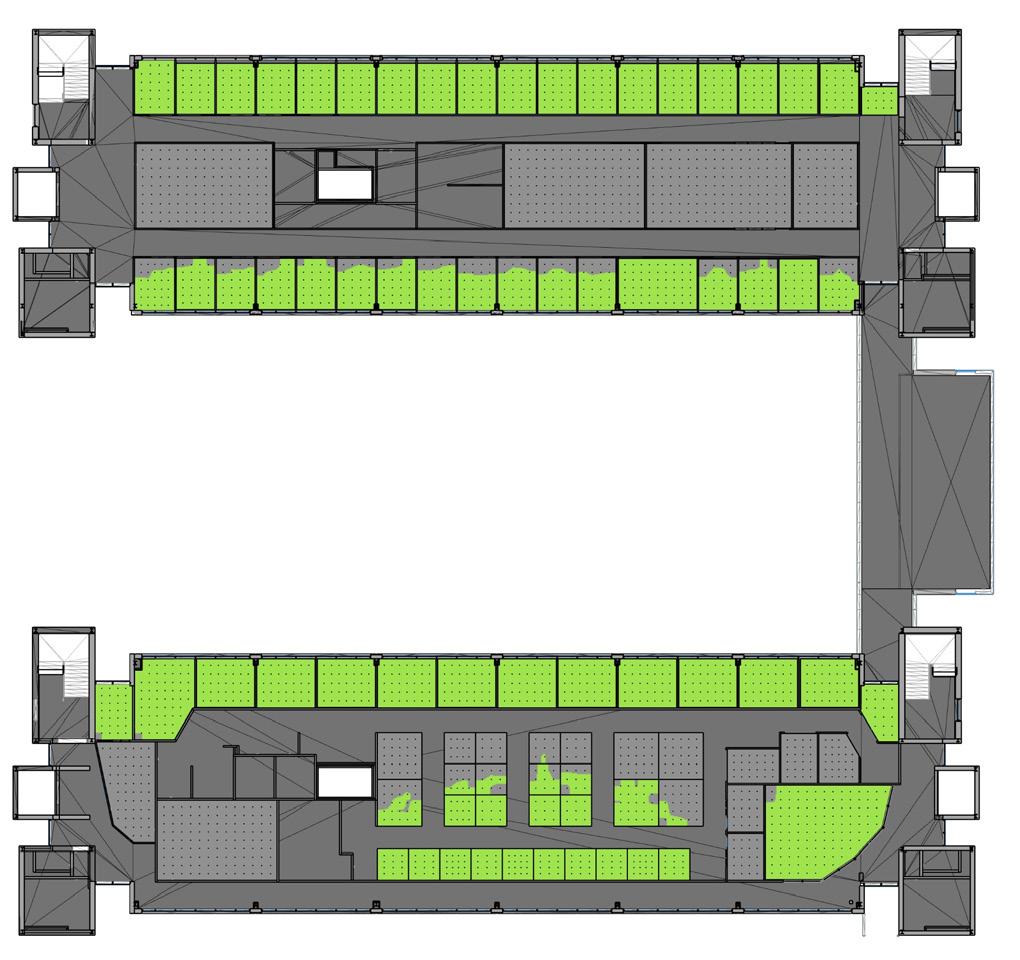
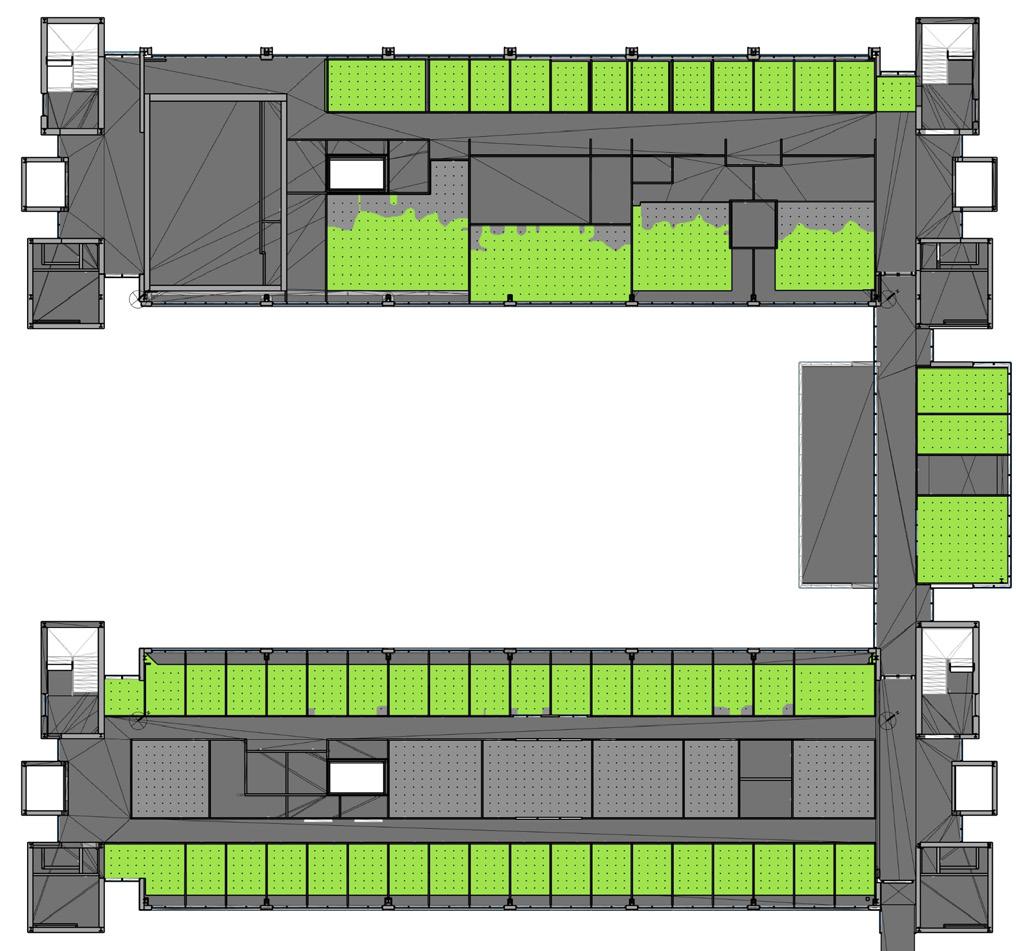
University of Maryland Baltimore County
Work Term & Involvement: Led the sDA Analysis at Green Lab, EYP/A Page Company Phase: Renovation / Existing Building Tools: Climate Studio, Rhino 7
Existing Ground Level: sDA - 49.3%
Ground Level w Proposed Design Changes: sDA - 67.4%

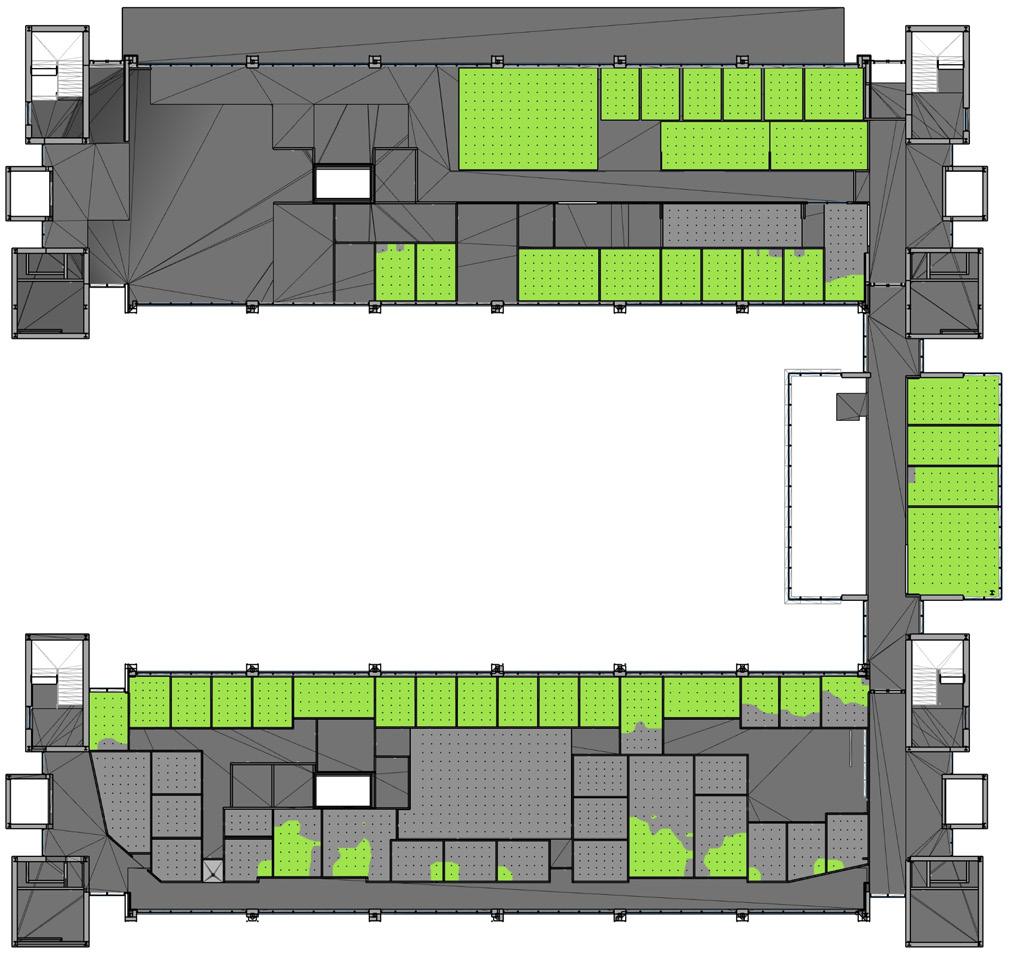
Ground Level Problem: The lecture hall cannot borrow daylight from the corridor due to the presence of opaque walls.

Ground Level Proposed Solution: The opaque walls could be replaced by single glazing to increase the sDA.
0 300 lux >

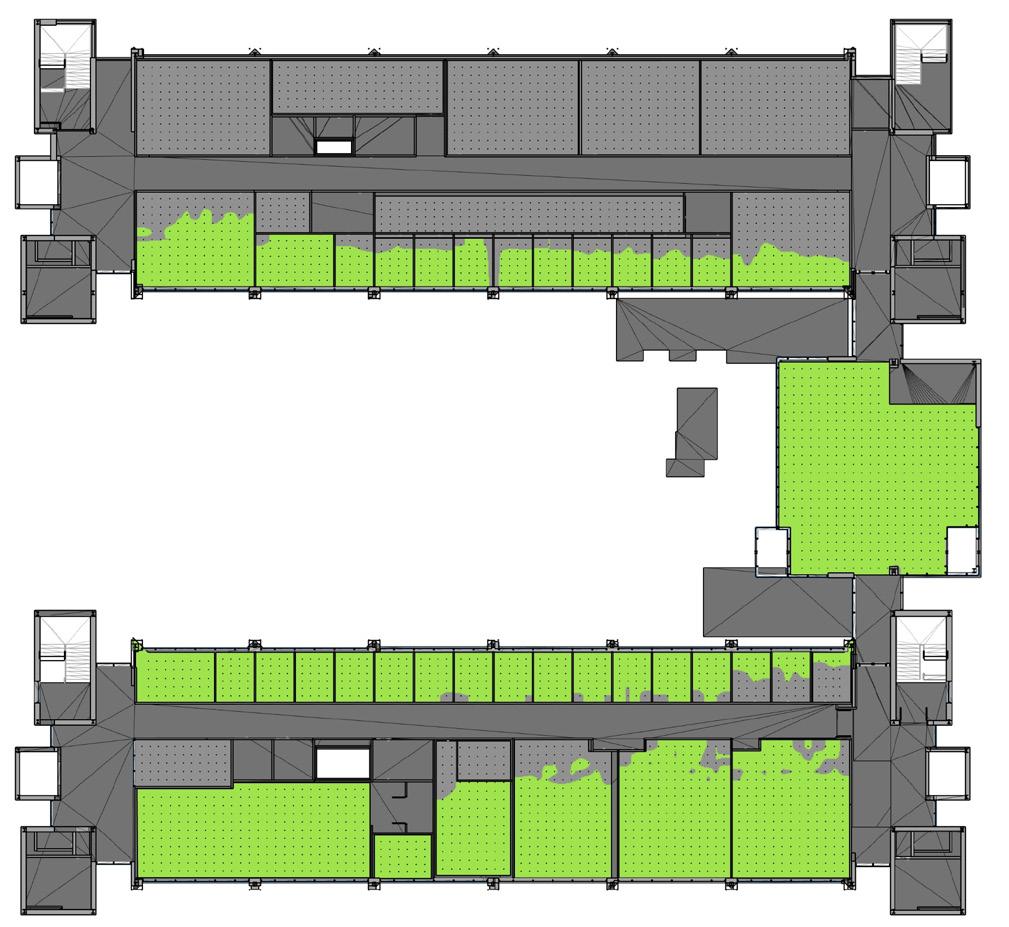
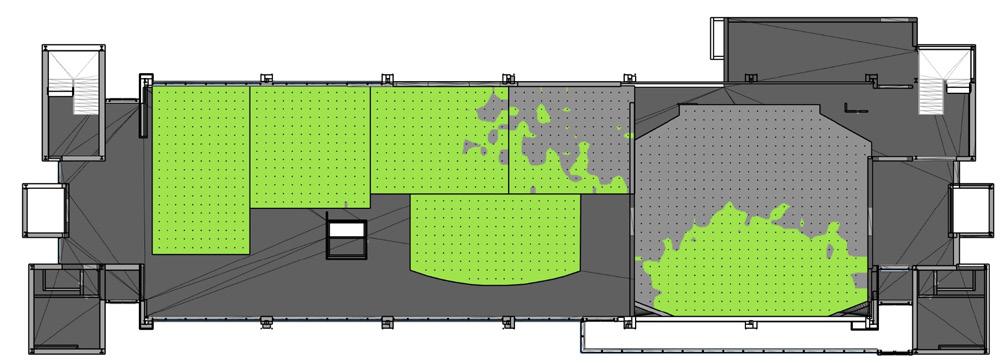
Existing First Level: sDA - 60.8%
Existing Second Level: sDA - 60.2%
Second Level w Proposed Design Changes: sDA - 73.7%
Second Level Problem: The opaque walls do not allow the offices to borrow light from the corridor.
Second Level Proposed Solution: The opaque walls could be replaced by single glazing to increase the sDA.
Assumptions:
• Climate Data file of Baltimore, MD is used.
• Transmittance value for double pane curtain panel glazing: 53.8%.
• Transmittance value for single pane door glazing: 87.3%.
• Materiality for the Floor: Porcelain w Reflectance Value: 20.0%.
Results & Conclusions:
• Total sDA for all levels increases from 59.7% with 2 LEED credits to 69.4% with 2 LEED credits.
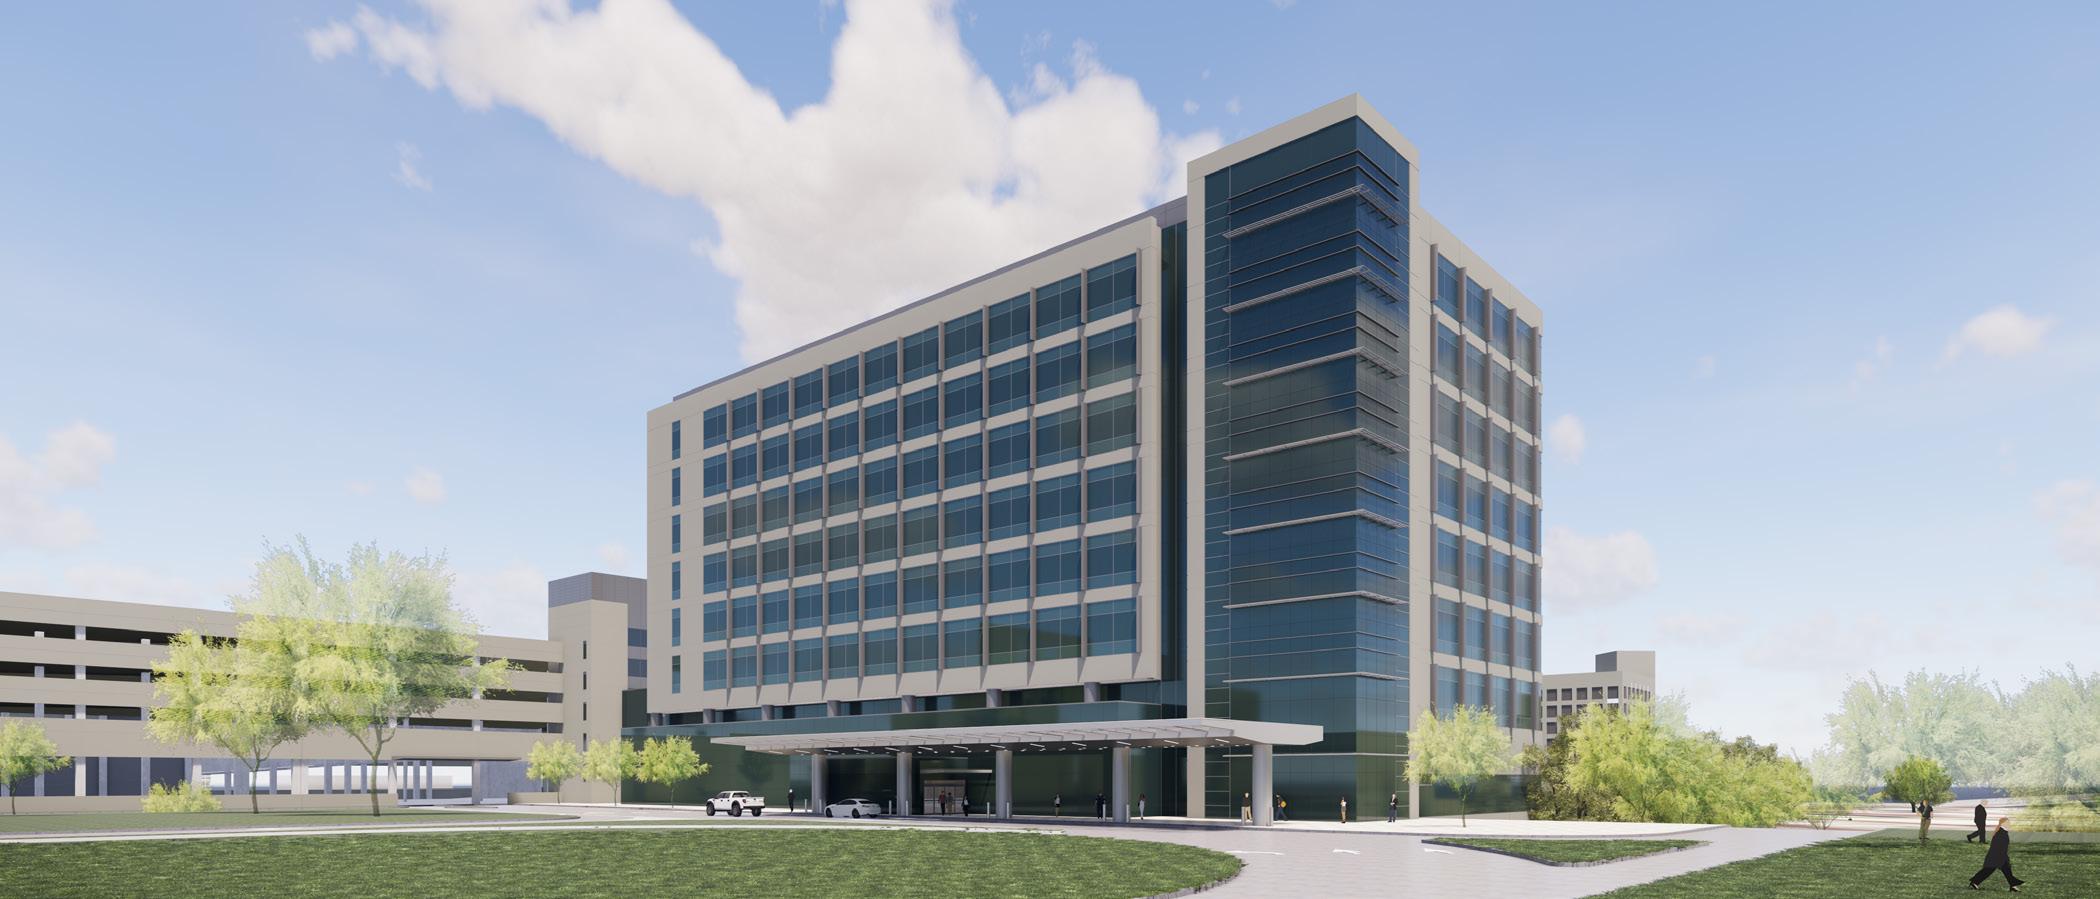
UTSW Cancer Center Elevator Lobby, Dallas, TX
Work Term & Involvement: Led the Analysis at Green Lab, EYP/A Page Company
Phase: New Construction / Schematic Design - sDA, Annual Glare, & Shading Analysis
Tools: Climate Studio, Rhino 7
UTSW Cancer Center Elevator Lobby
Program: Hospital / Medical Center
Goal: Evaluate the Spatial Daylight Autonomy (sDA) and Annual Glare for the elevator lobby. Determine shading systems that can be used to maximize sDA and minimize Annual Glare.

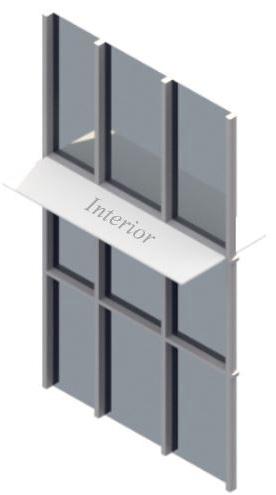
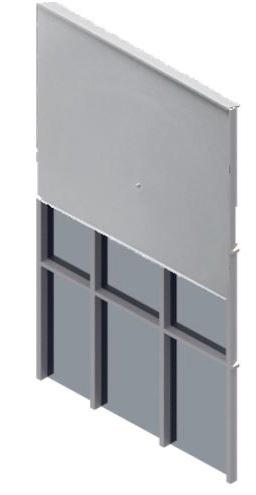
Iteration 1Automated Blinds by Climate Studio
Iteration 25” Overhang at 7’: Interior & Exterior
Iteration 35” Overhang at 7’ and 3” Horizontal Lou-
Iteration 1: sDA - 85.0%
Iteration 2: sDA - 85.0%
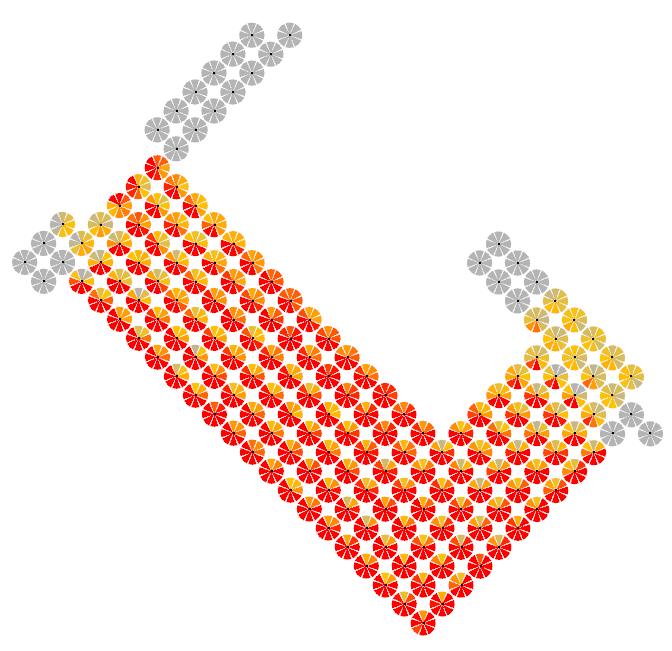
Iteration 3: sDA - 85.0%
Iteration 1: Glare - 40.10%
Assumptions:
• Climate file of Dallax, TX is used.
• Glazing has a southwest orientation.

Iteration 2: Glare - 31.30%
Iteration 3: Glare - 14.80% 0 300 lux <
• IES LM-83 Reflectance values taken into consideration.
• Transmittance value for glazing is 0.48.
Results & Conclusions:
• sDA remains at 85.0% for all three iterations.
• Use of iteration 2 decreases glare by 8.8% when compared to iteration 1.


45.00%
40.00%
35.00%
30.00%

25.00%
20.00%
15.00%
10.00%
5.00%
Iteration 1
Annual Glare: 8.8% 16.5%
25.3%
• Use of iteration 3 decreases glare by 25.3% when compared to iteration 1. 40.10% 31.30% 14.80% 0.00%

Iteration 2 Iteration 3

Concept Studies
Professional Work
Department of General Services, Richmond, VA: 2021 - Schematic Design Phase
Department of General Services, Richmond, VA: 2022 - Design Development Phase
Mentor: Justin Shultz

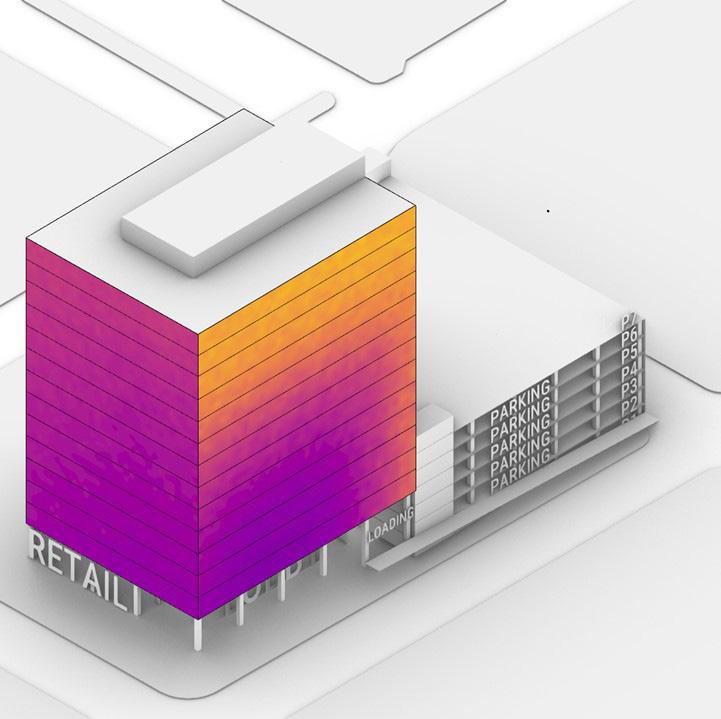
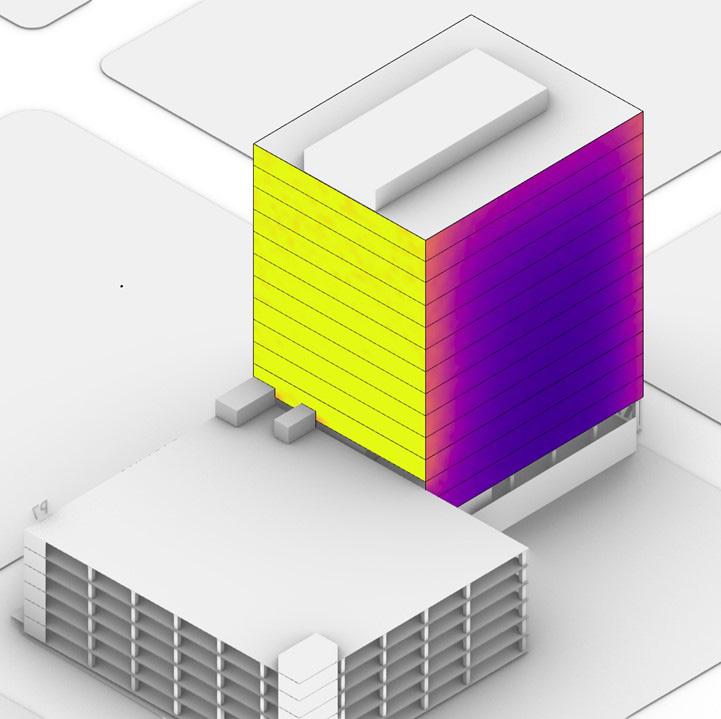

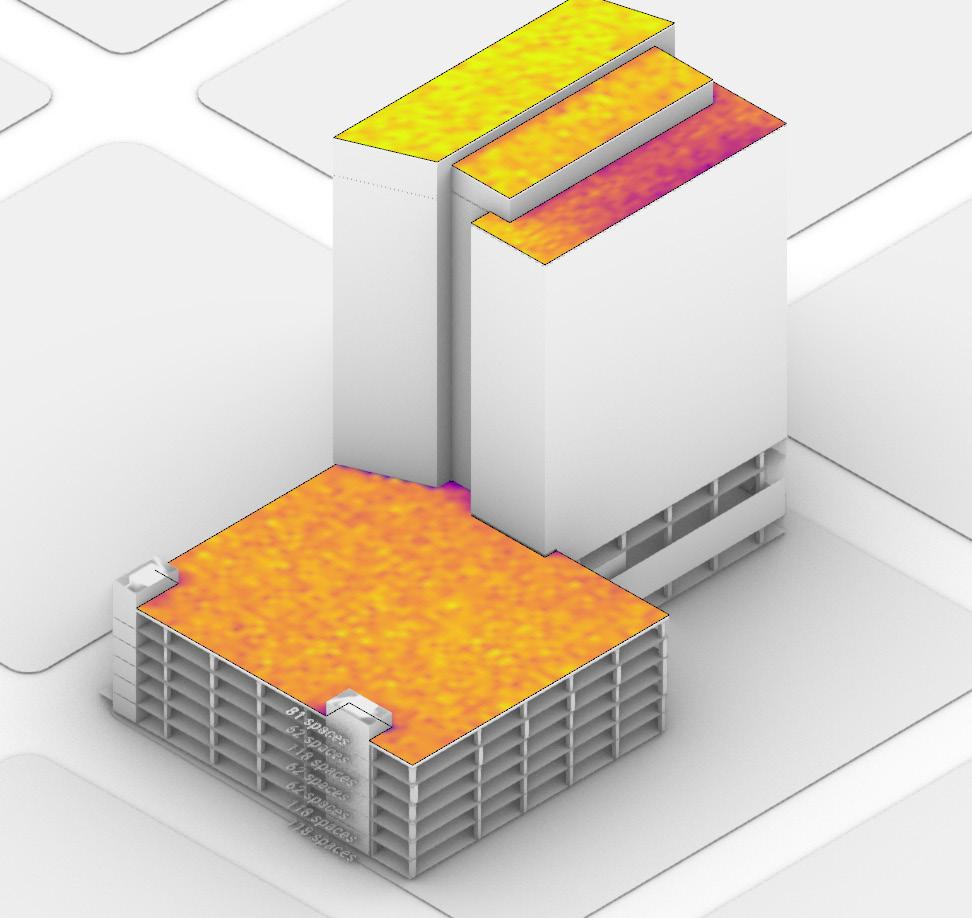
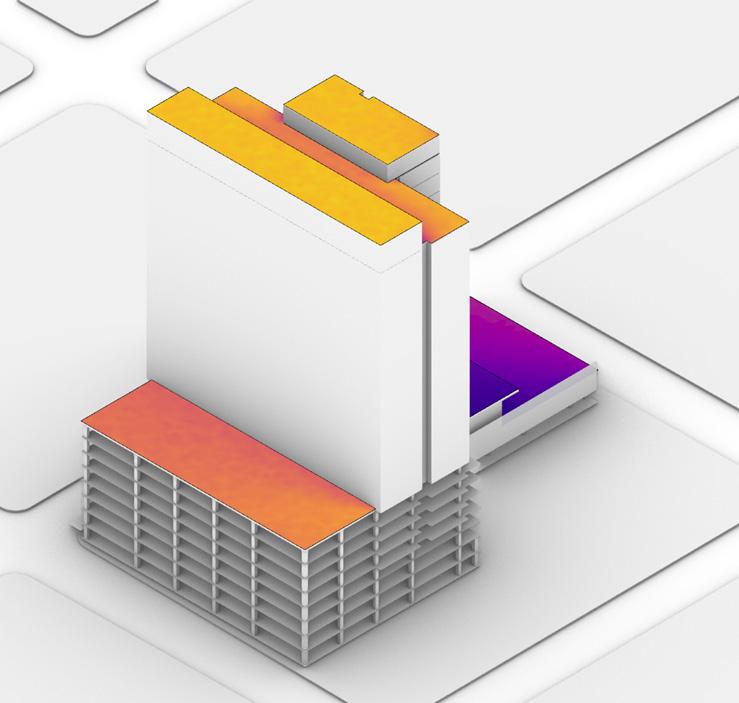
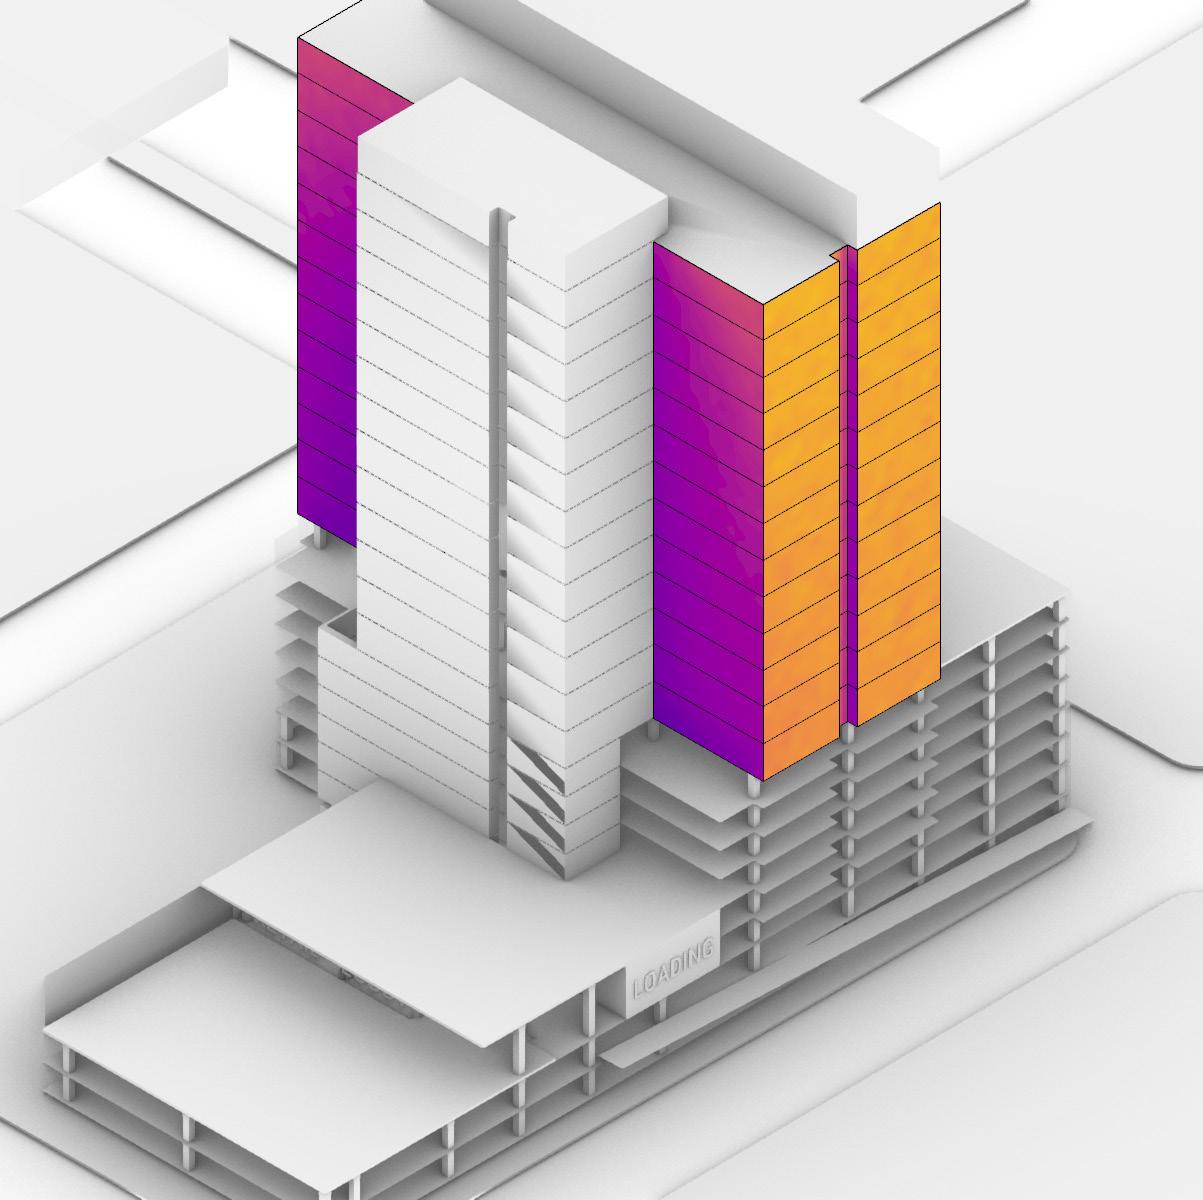
Concept 2: Solar Exposure for all facades - 165 kWh/m2/yr.
NW NE SE SW
Concept 3: Solar Exposure for all facades - 251 kWh/m2/yr.
Program: Office
0 350 kWh/m2/yr
Goal: Evaluate the Spatial Daylight Autonomy (sDA) & Direct Solar Exposure for all facades and roofs to inform better design and shading strategies and to determine PV generation potential for roofs.



Assumptions:
• Climate file of Richmond, VA is used.
• Window to Wall Ratio (WWR) is 40%.
• Solar Heat Gain Coefficient (SHGC) for glazing is 0.25.
• IES LM-83 Reflectance values taken into consideration.
Results & Conclusions
• Concept 2 has the highest PV generation potential due to highest amount of direct solar exposure.
• Concept 3 achieves the highest Spatial Daylight Autonomy (sDA) at 51.7%.
• Concept 1 & 2: SW & NW facades need to be shaded in the summer.
• Concept 3: SW, NW, & SE facades need to be shaded in the summer.
Department of General Services, Richmond, VA
Work Term & Involvement: Led the Analysis at Green Lab, EYP/A Page Company

Phase: New Construction / Schematic Design - sDA, Glare, Shading & EUI Analysis Tools: Ladybug, Honeybee, Grasshopper, Rhino 7
Site & Context
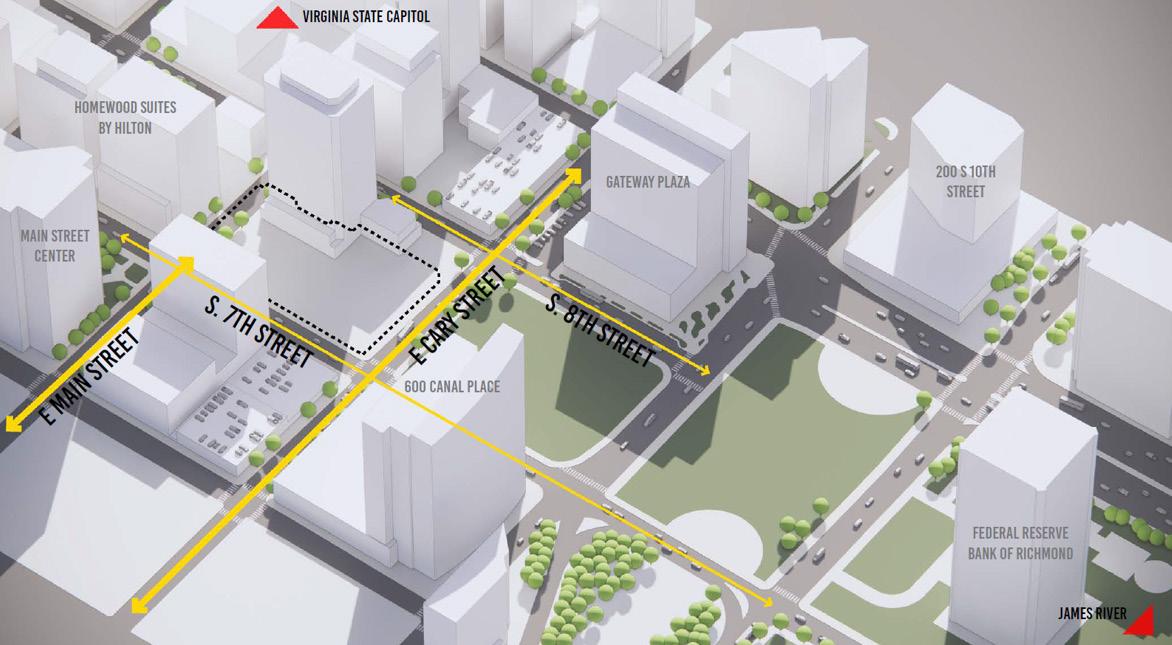
Sky
Sky
June 21st - 9:00 am
Program: Office
September 22nd - 9:00 am
December 23rd - 9:00 am
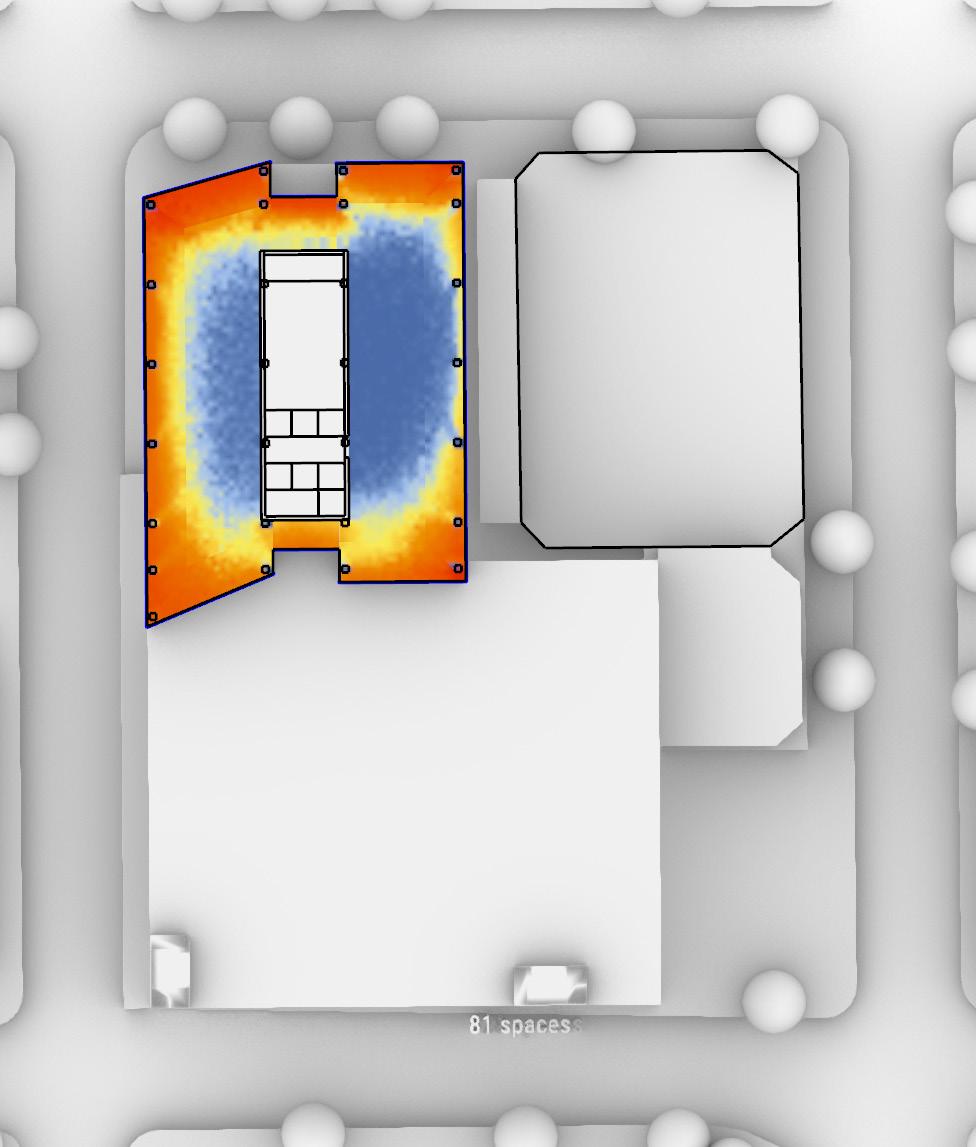
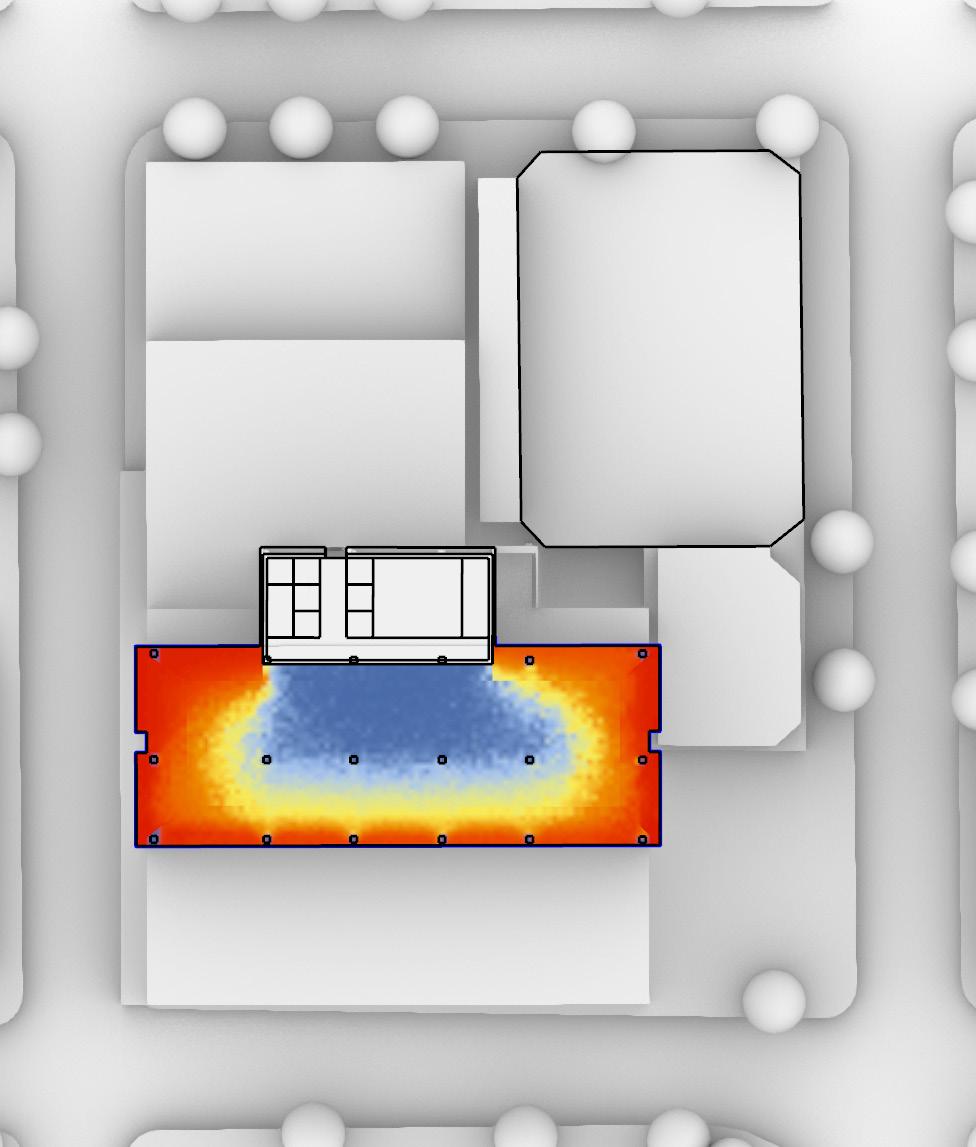
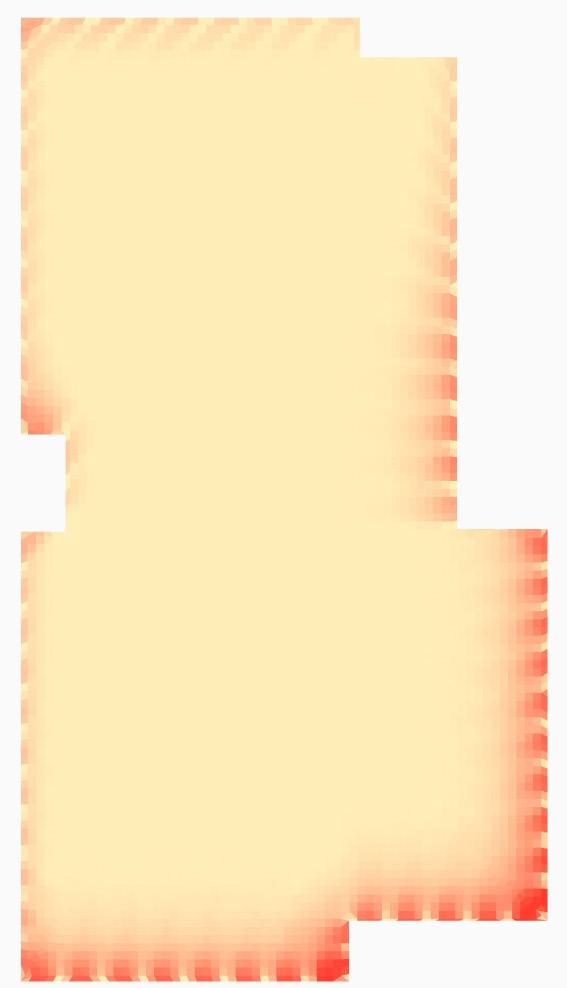
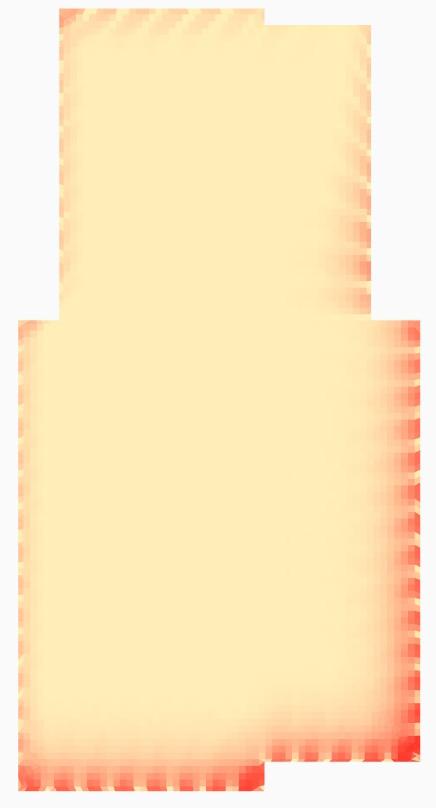
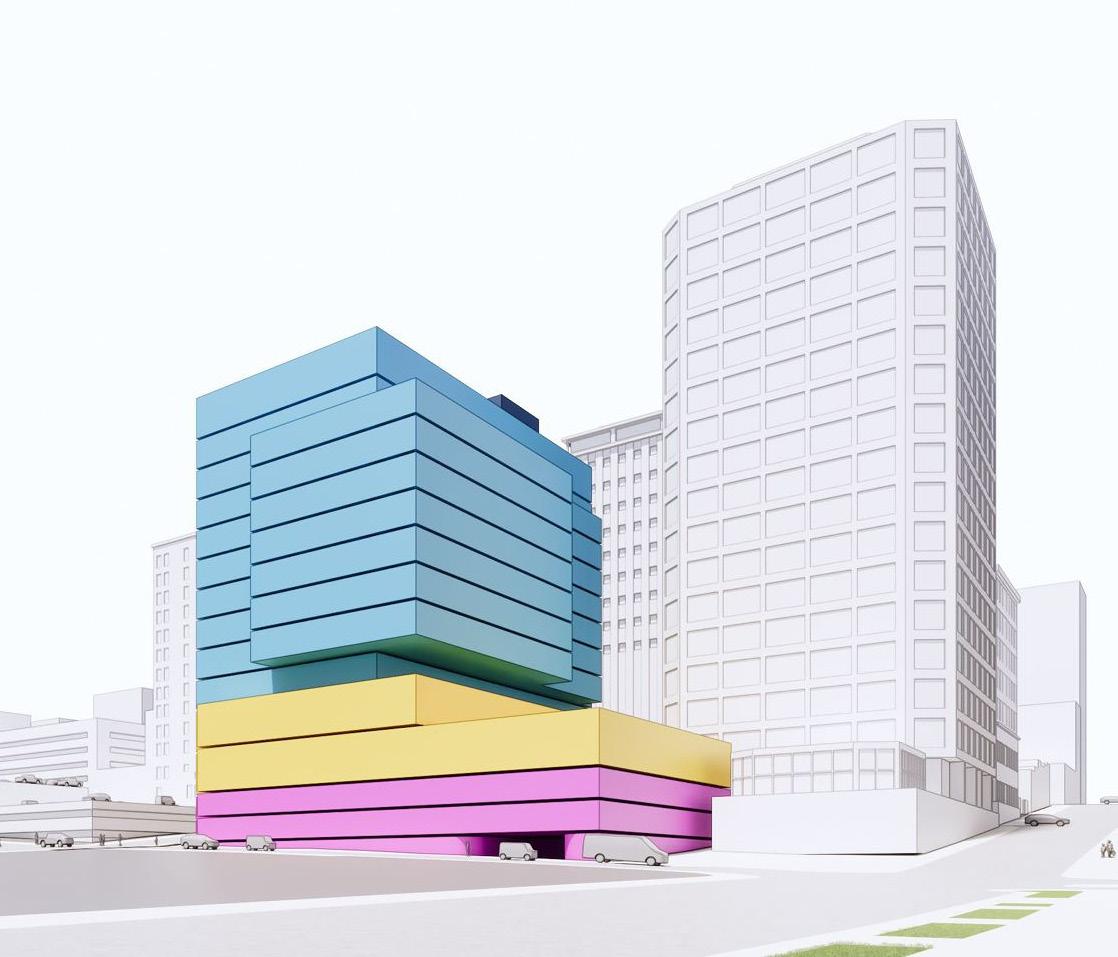
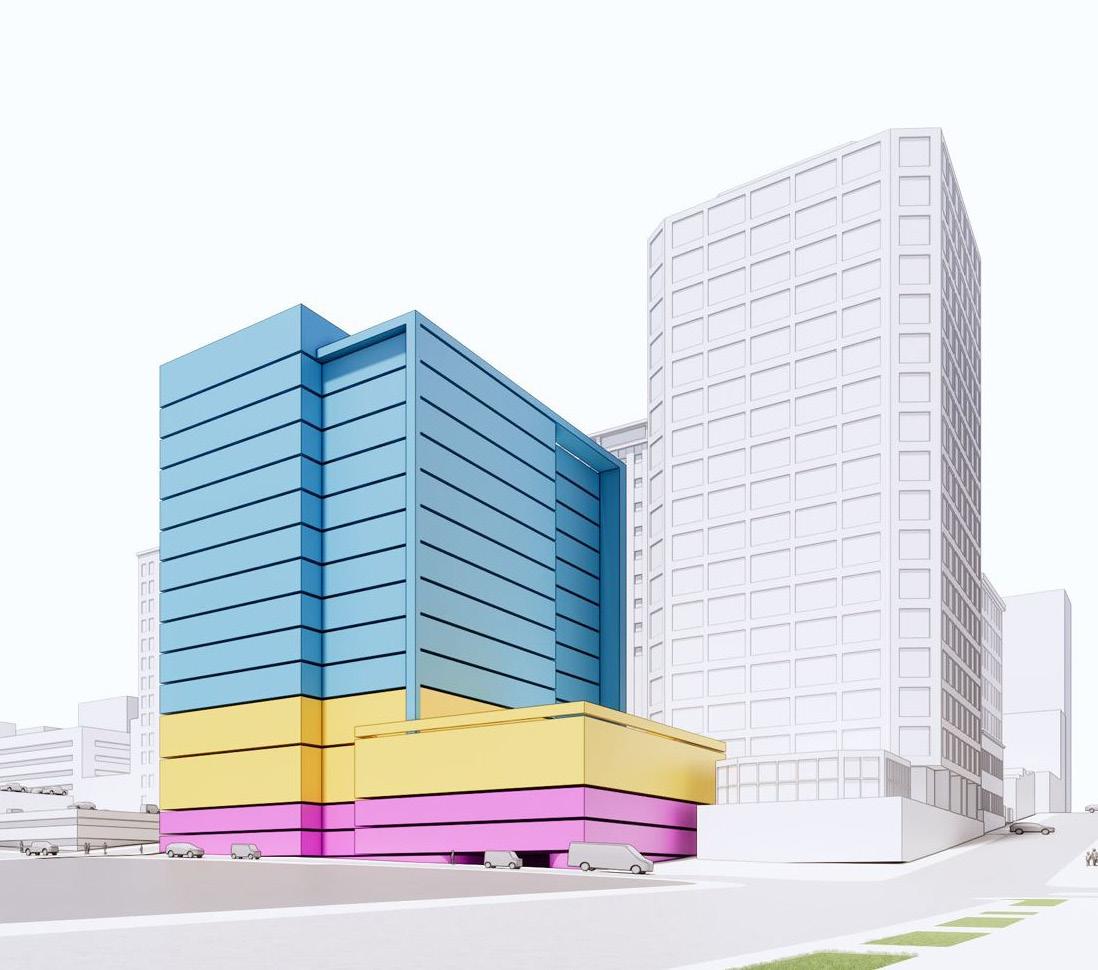
Goal: Evaluate Spatial Daylight Autonomy (sDA), Annual Glare, and EUI for four different massings to comply with a massing option that maximizes the sDA and minimizes the Annual Glare and EUI.


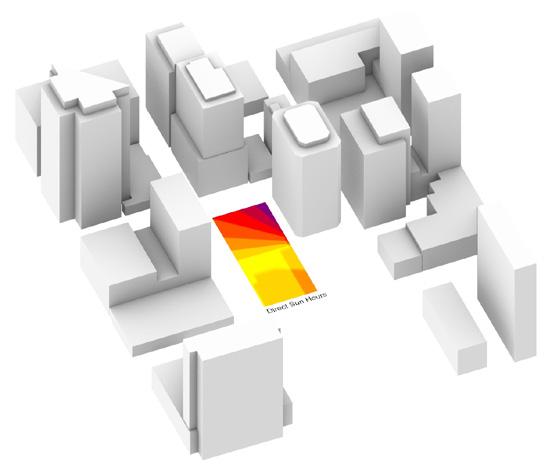


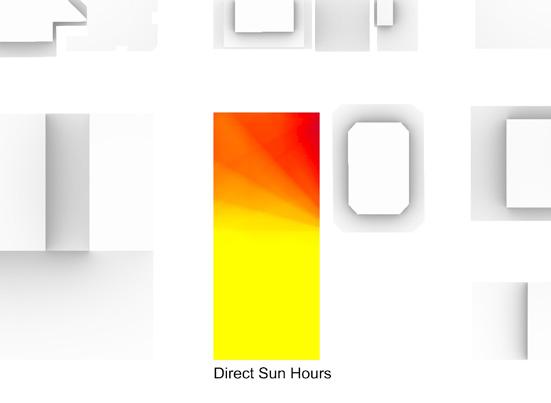

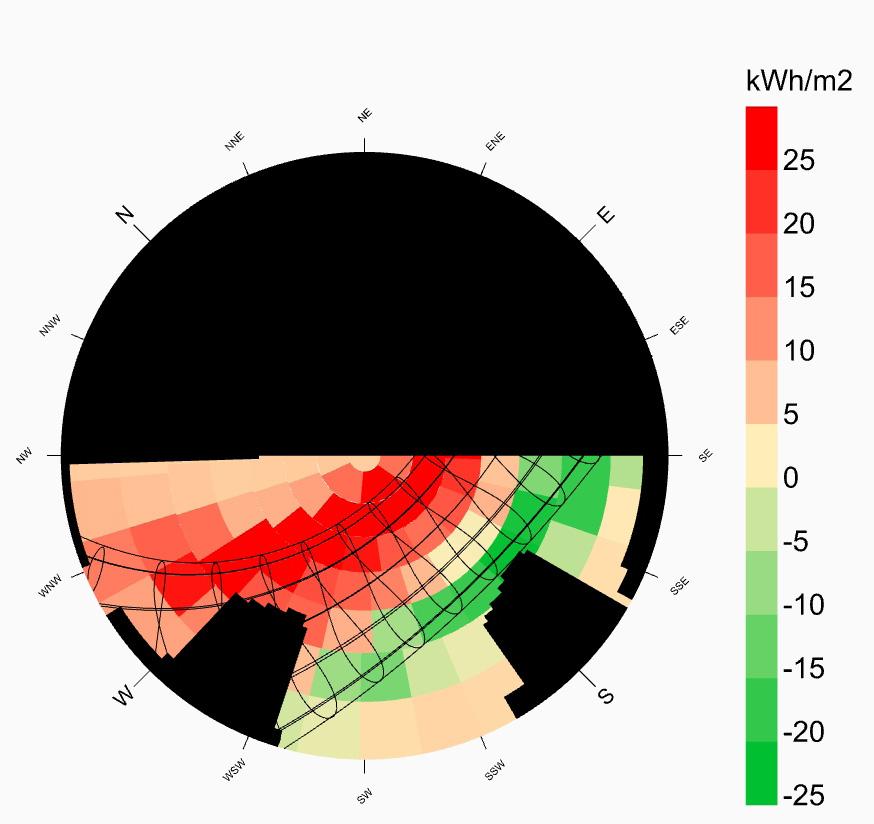
Initial Considerations:

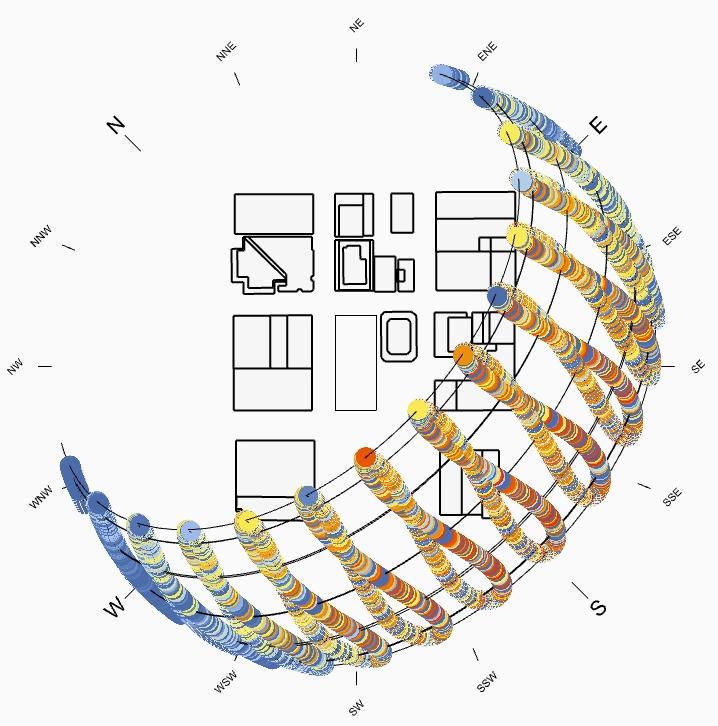
• Sun Path for the site with existing context buildings.
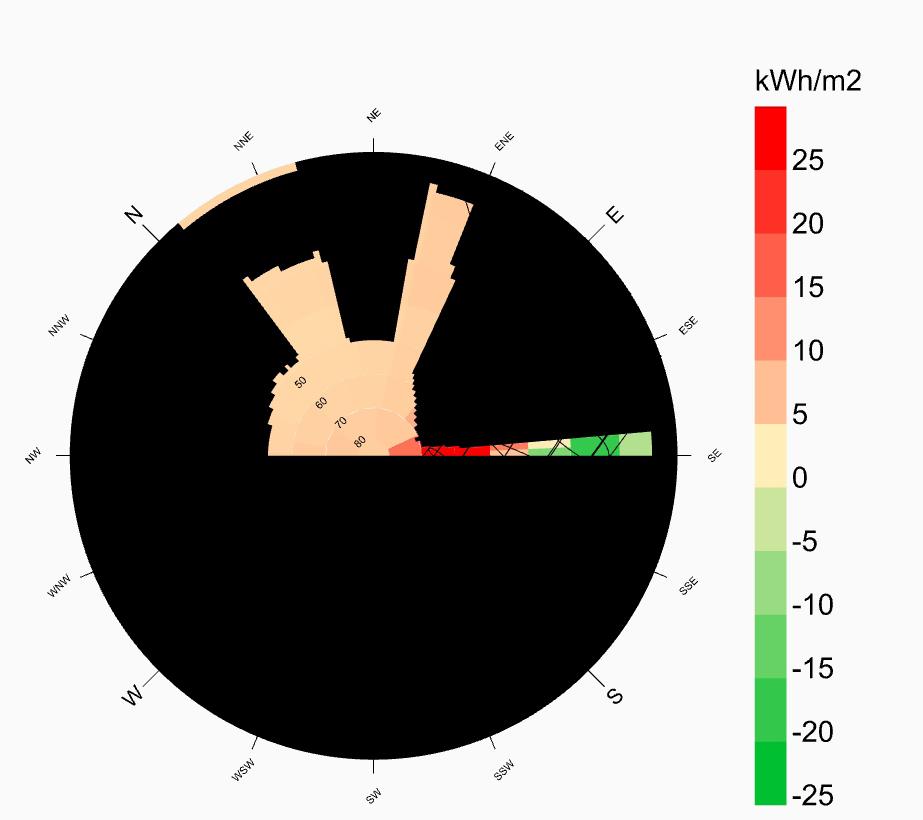
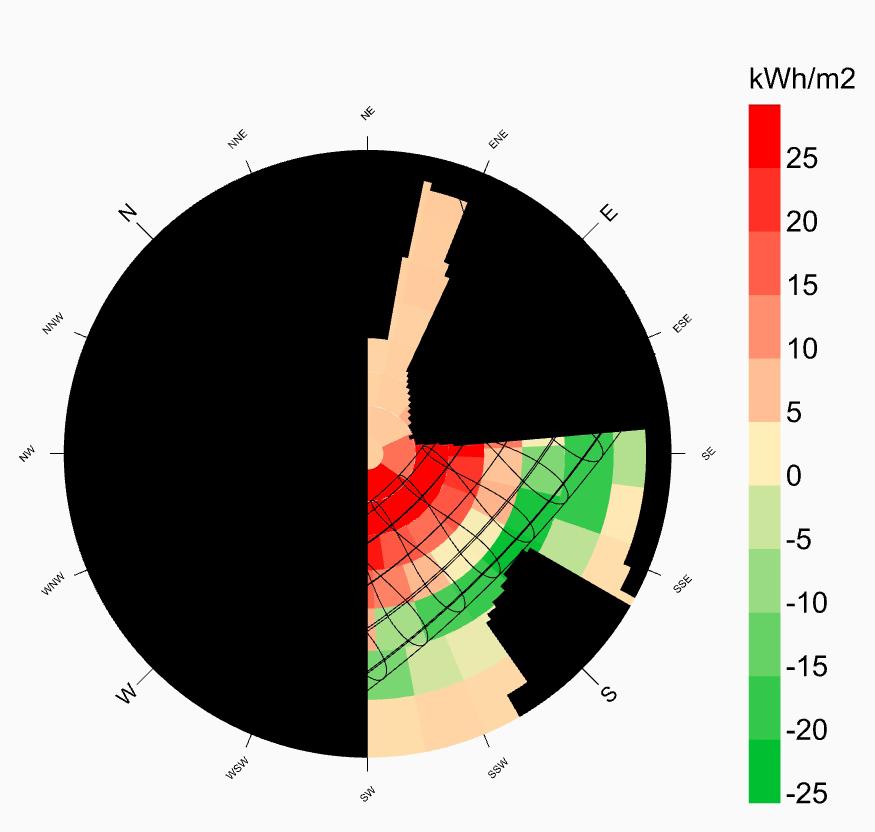
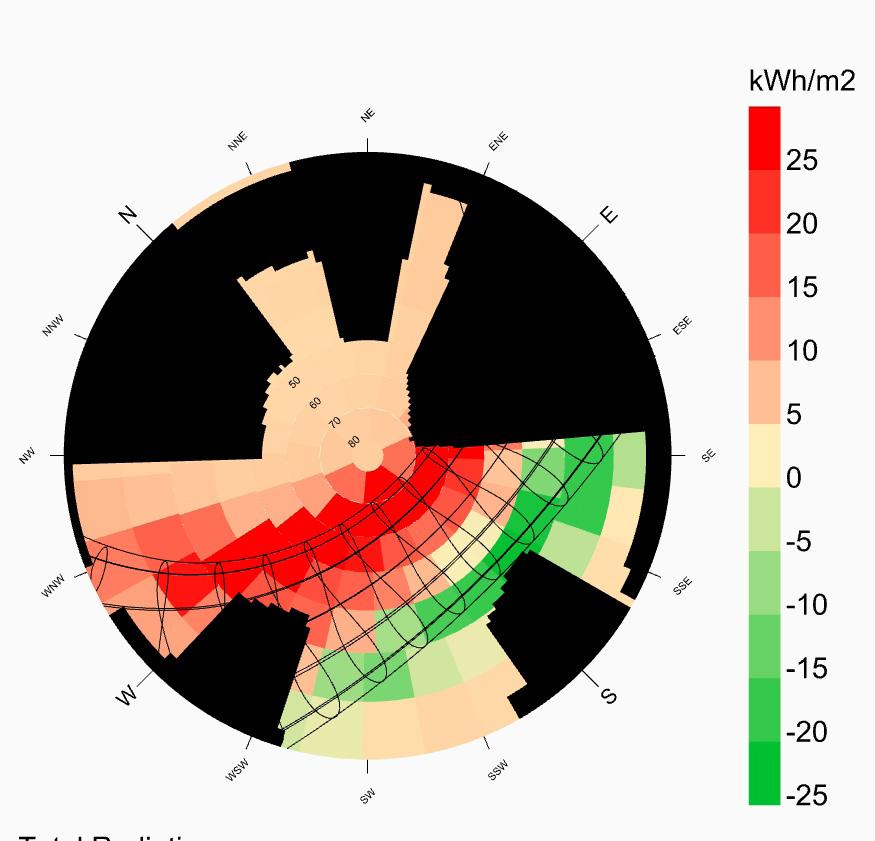
• Sky Masks with context for North, West, East, and South orientations.

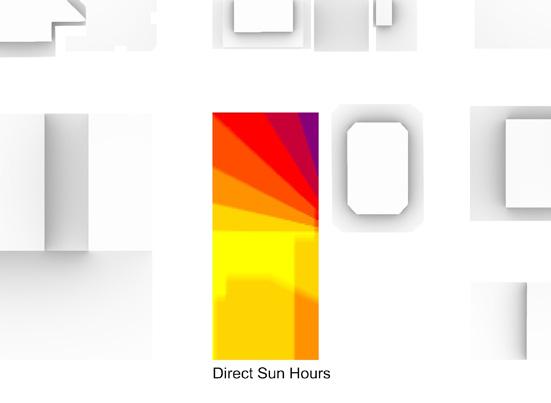
• Direct Sun Hours for June 21st, September 22nd, and December 23rd on 9:00 am
 Sky Dome w Sun Path
Sky Dome w Context
Sky Mask - North Orientation
Sky Mask - West Orientation
Mask - South Orientation
Mask - East Orientation
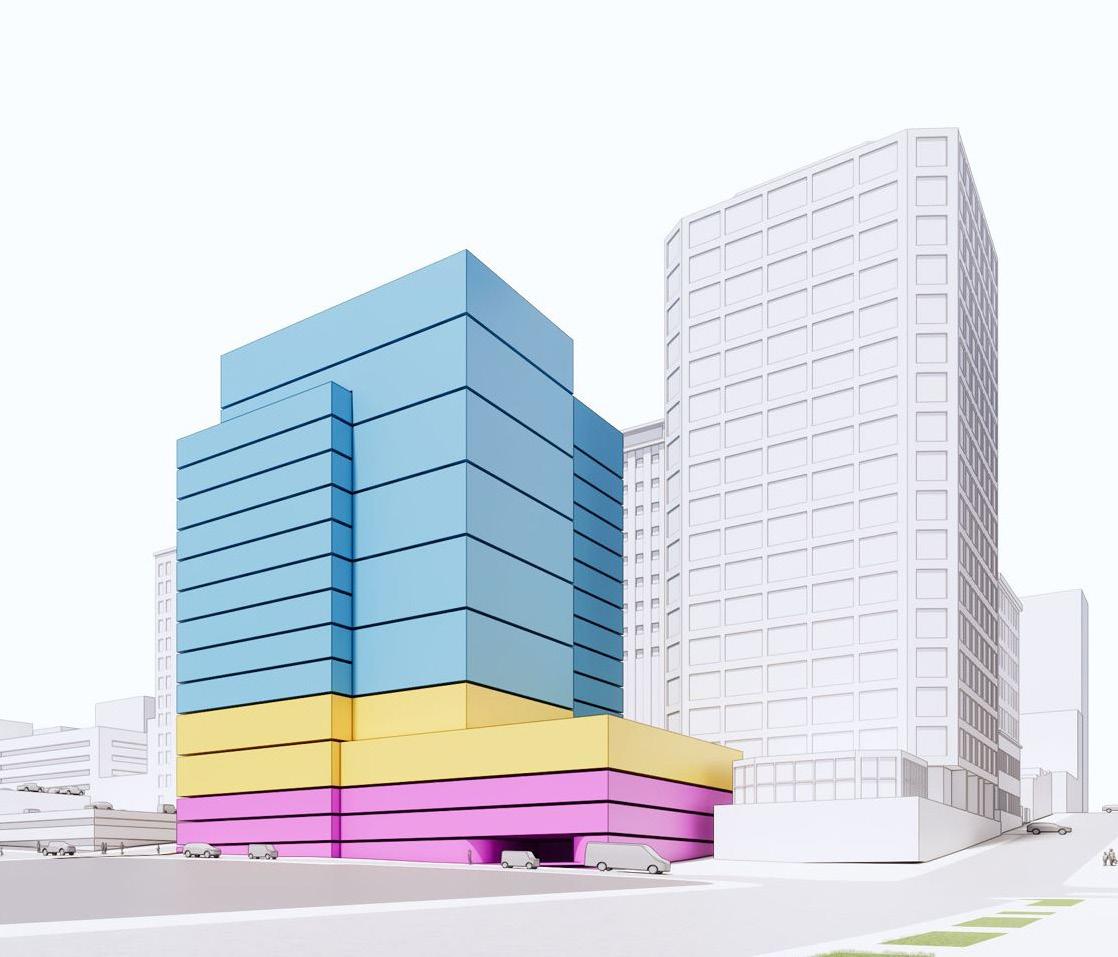


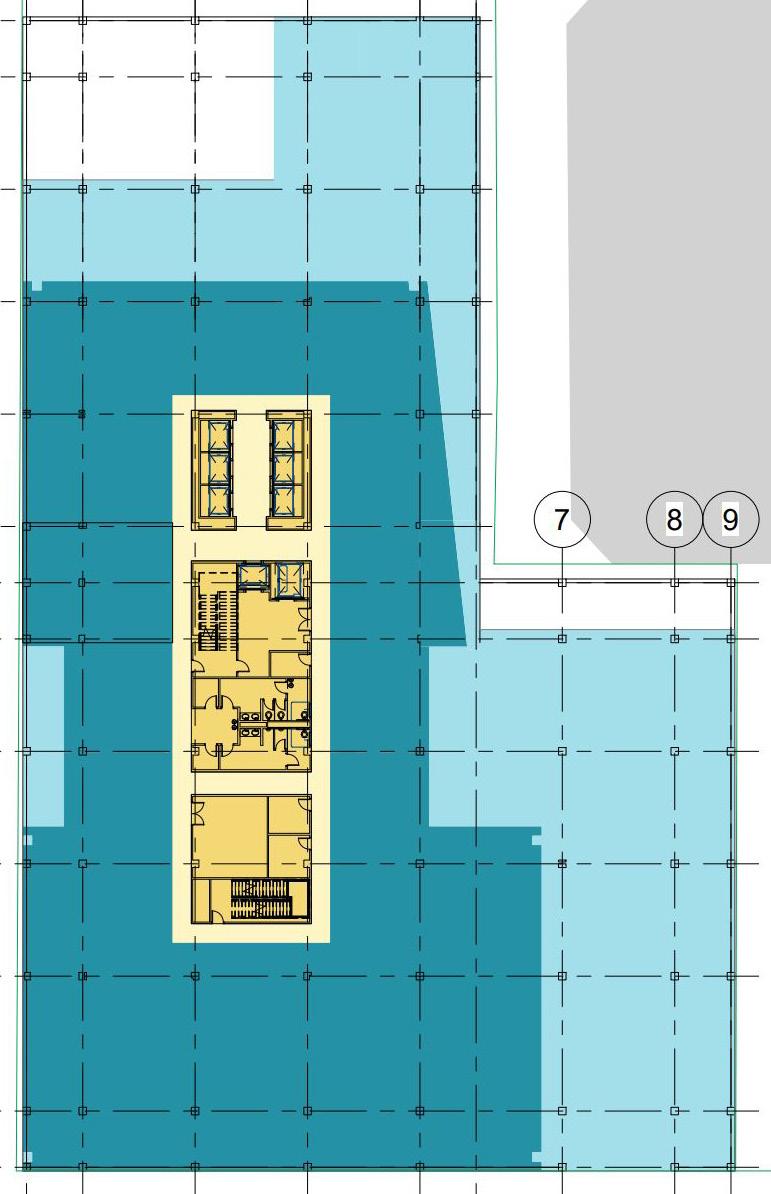
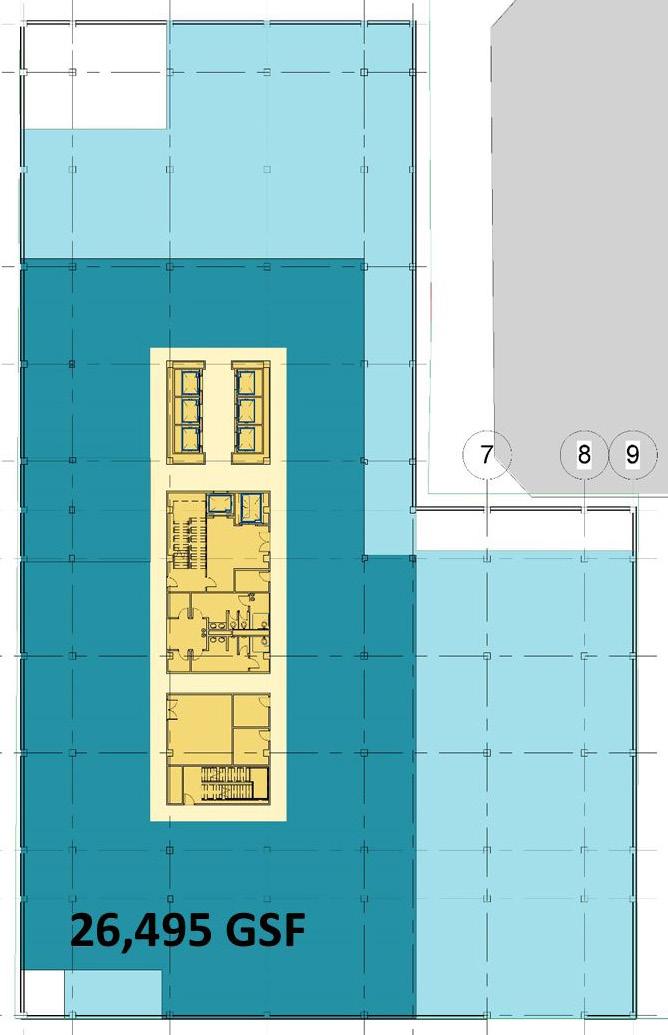

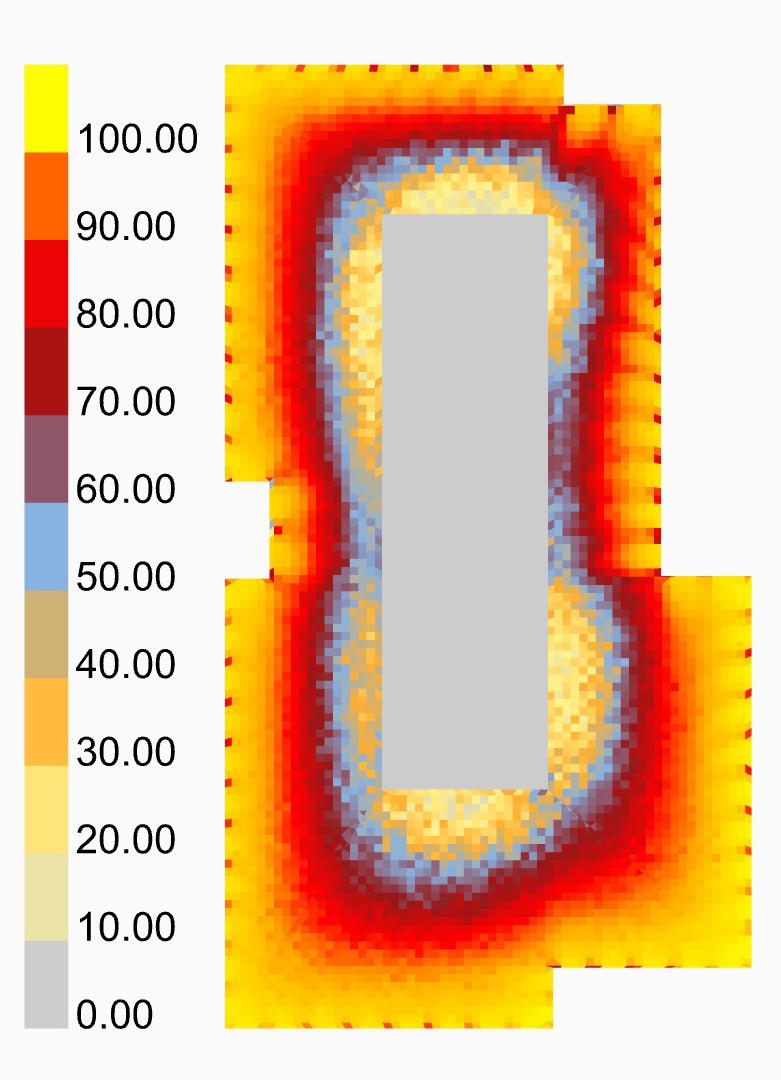

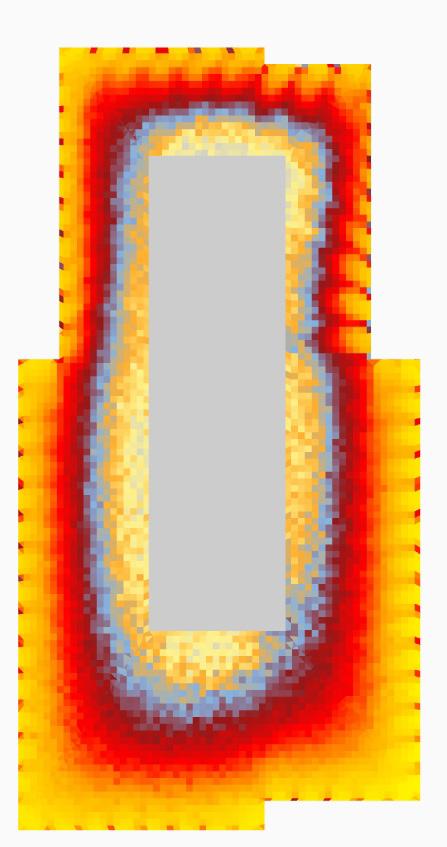
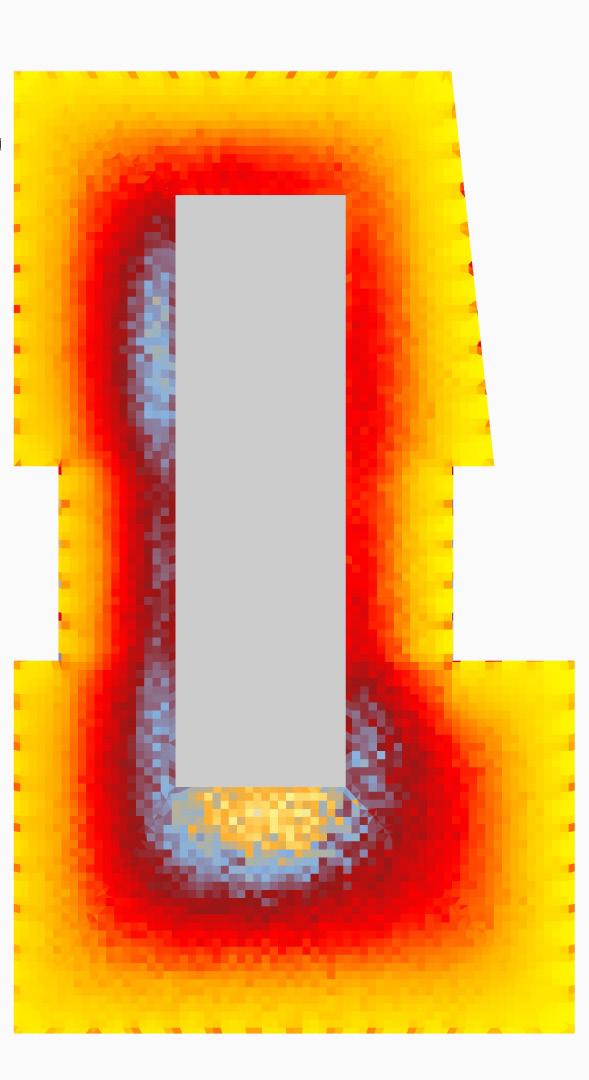


A: Glare - 26.2%
Assumptions:
• True North at 45 degrees.
B: Glare - 36.5%


C: Glare - 26.7%
D: Glare - 26.5%
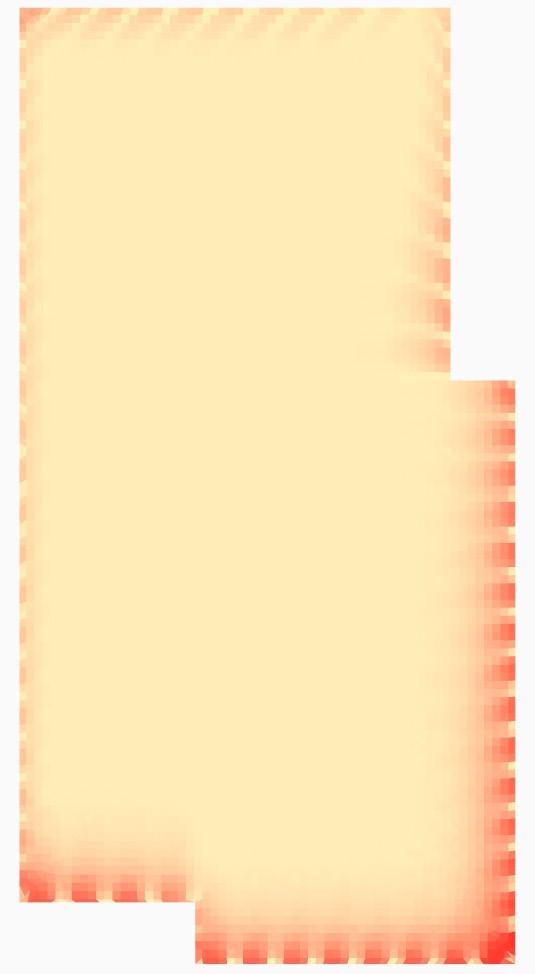


• Daylight & Glare Analysis at fourth / fifth level with respect to the ground level.
• Window to Wall Ratio (WWR) is assumed to be 40%.
• Transmittance value for Glazing: 0.45.
• Window height and sill height are considered to be 9 ft and 2.5 ft, respectively.
Results & Conclusions for sDA & Glare Analysis:
• Scheme B achieves the highest sDA value at 95.8%.
• Scheme A achieves the lowest Annual Glare at 26.2%.
• Scheme B is considered as a potential option with shading devices to limit the Annual Glare.
Assumptions:
• ASHRAE 90.1 2016 Building Envelope taken into consideration.

Results & Conclusions for EUI Analysis:

• Similar EUI values achieved for all options.
Scheme A: EUI - 66.2 kBtu/ft2/yr
Scheme B: EUI - 65.8 kBtu/ft2/yr
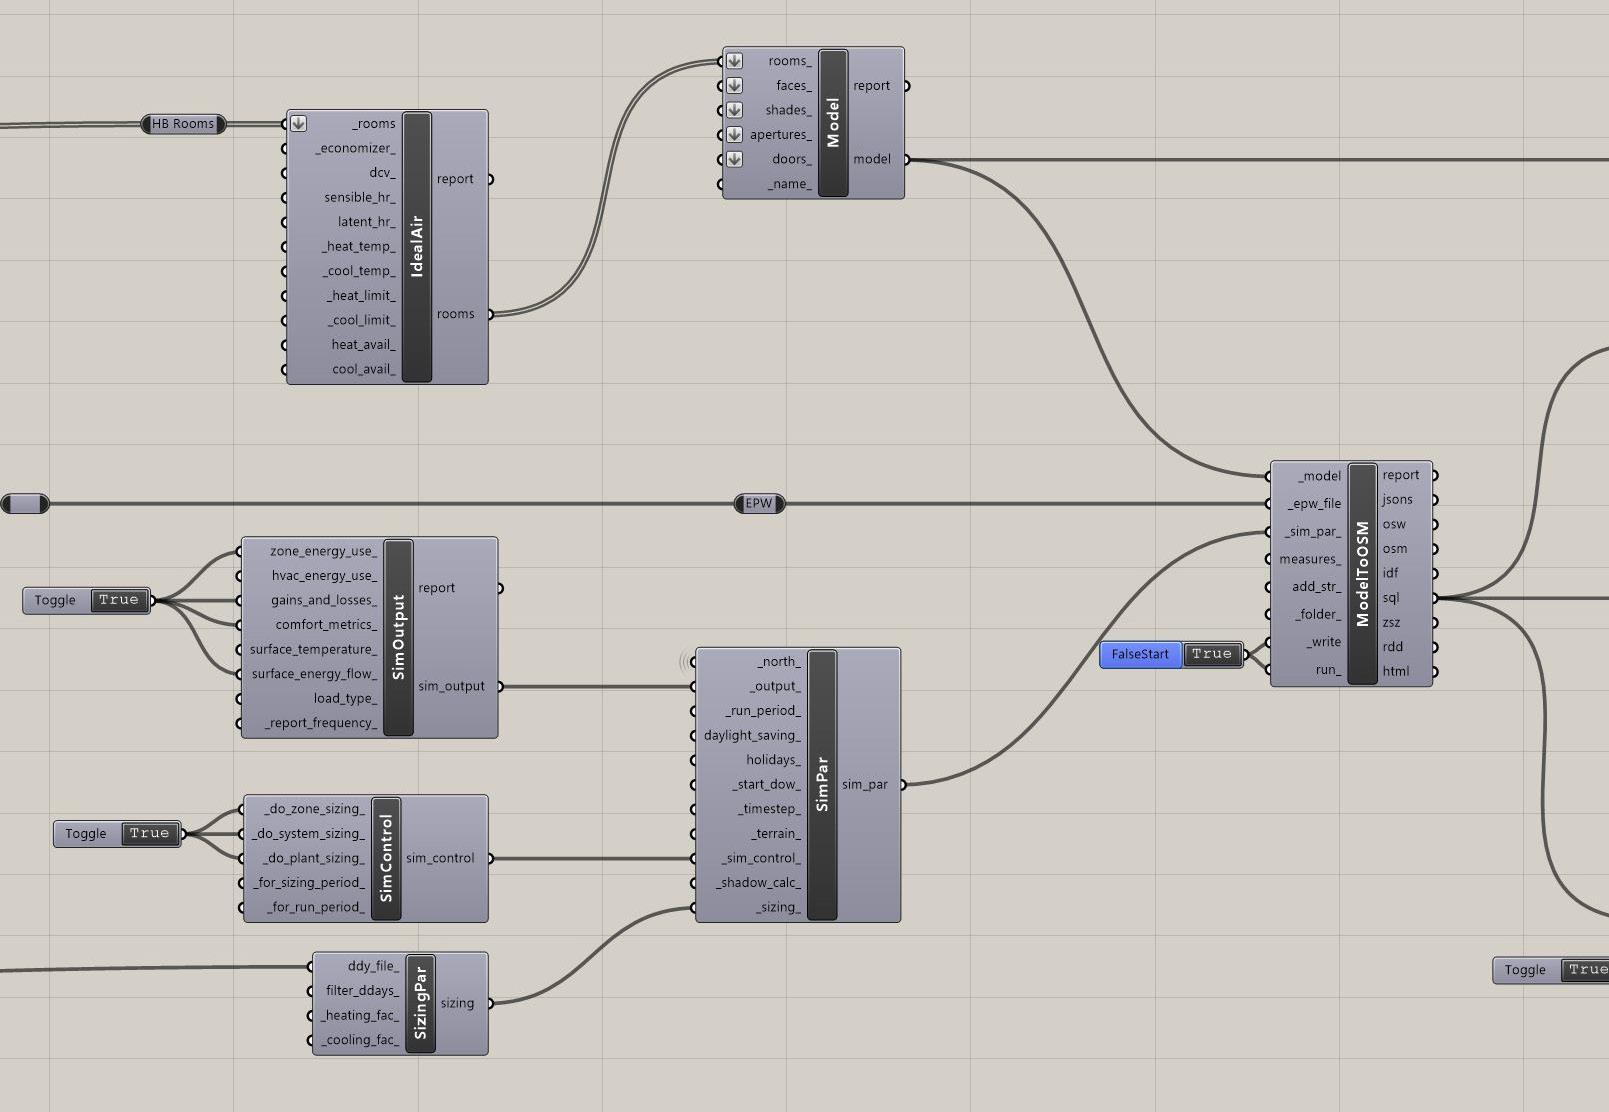
Takeaway for the Design Team: • Primary driver for energy consumption: Cooling & Mechanical Ventilation


Scheme C: EUI - 66.0 kBtu/ft2/yr
Scheme D: EUI - 66.2 kBtu/ft2/yr

Cost Savings / yr Results for
Building Performance Analysis
Marketing Strategy
Vida & Retama, San Antonio, TX
Work Term & Involvement: Led the Analysis at Green Lab, EYP/A Page Company
Phase: New Construction / Preliminary Design - Solar Radiation Analysis Tools: Climate Studio, Rhino 7

Scheme: Vida - East to West Orientation
Program: Office
Scheme: Retama - North to South Orientation
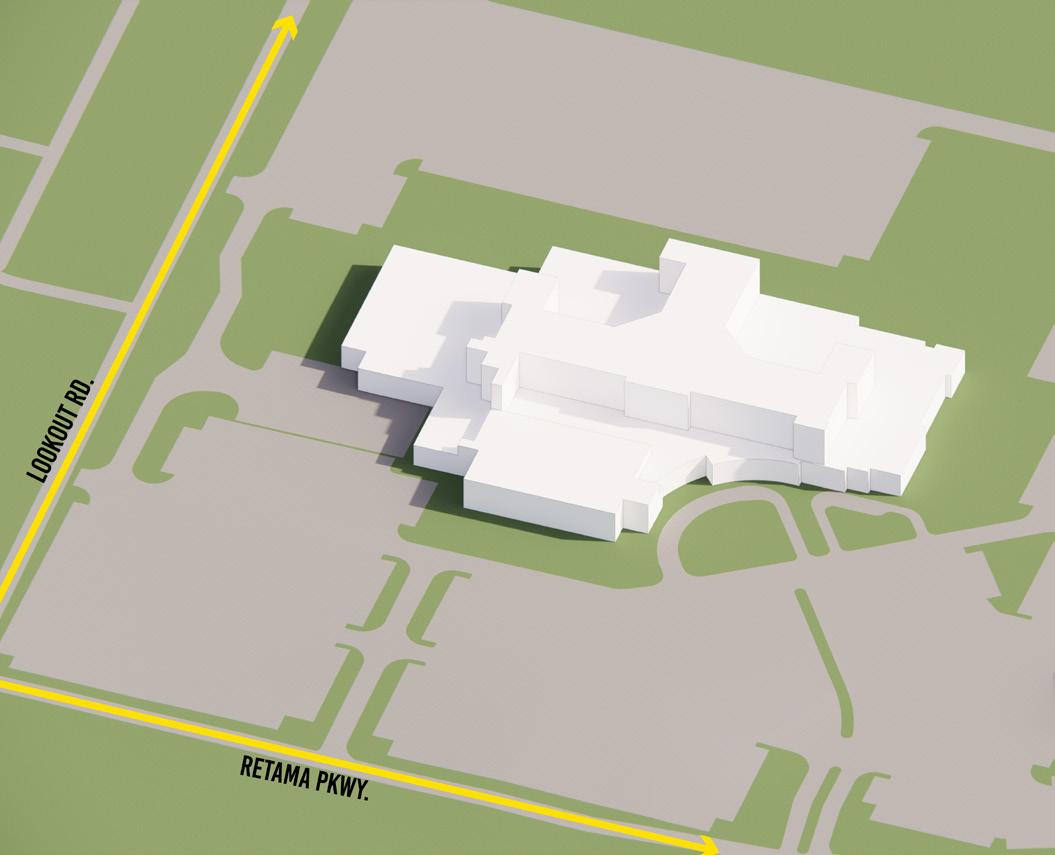
Goal: Evaluate the average direct solar exposure for all area-weighted facade and roof surfaces for two different schemes named as Vida and Retama to inform improved solar orientation.
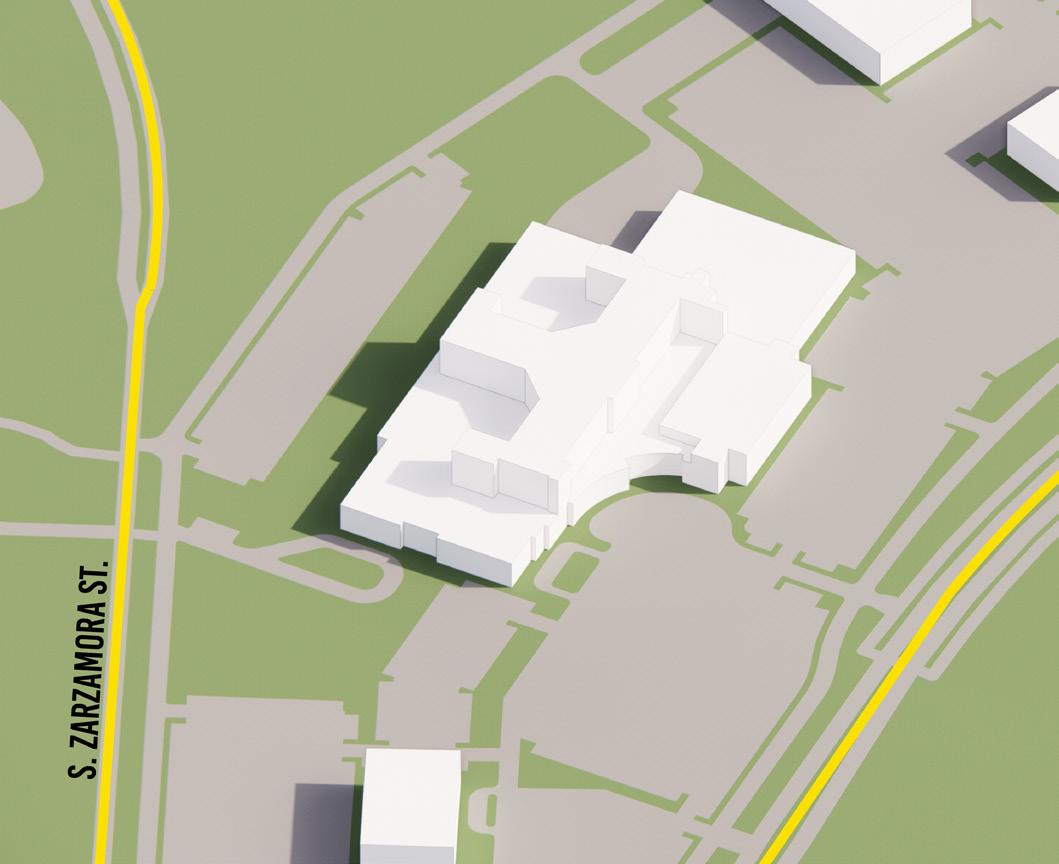
Assumptions:
• Climate file of San Antonio, TX is used.
• Window to Wall Ratio (WWR) is 40%.
• Solar Heat Gain Coefficient (SHGC) for glazing is 0.25.
Solar Radiation Analysis for VidaSolar Radiation Analysis for Retama
SIMULATION ANALYSIS VIDA RETAMA SOLAR EXPOSURE/m^2 ( kWh/m^2-yr) All Hours & Surfaces 895 907 WWR 40% 40% SOLAR RADIATION THROUGH GLAZING/m^2 ( kWh/m^2-yr) 358 362.8 SHGC SOLAR RADIATION RECEIVED/m^2 ( kWh/m^2-yr) 89.5 90.7
0.25 0.25
TOTAL AREA OF ALL SURFACES (m^2) 17757.98 19593.08 TOTAL SOLAR RADIATION RECEIVED (kWh/yr) 1589339.19 1777092.43
DIFFERENCE BETWEEN TOTAL SOLAR RADIATION RECEIVED (kWh/yr) = 187753.24 DIFFERENCE BETWEEN TOTAL SOLAR RADIATION RECEIVED (%)= 10.57%
HVAC ASSUMPTION - Water Cooled, Electrically Operated Centrifugal COP (ASHRAE 2016 REQUIREMENTS) 4 4 ELECTRICITY NEEDED ( kWh/yr) 397334.798 444273.1071
DIFFERENCE BETWEEN ENERGY CONSUMPTION (kWh/yr)= 46938.30912 DIFFERENCE BETWEEN % ENERGY CONSUMPTION = 10.57%
RATE OF ELECTRICITY ($/kWh) 0.09 $ 0.09 $ TOTAL COST OF ELECTRICITY ($) 37,270.00 $ 41,672.82 $
DIFFERENCE BETWEEN COST OF ELECTRICITY ($)= $ 4,402.81
• HVAC System taken into consideration is Water Cooled, Electrically Operated Centrifugal.
• Coefficient of Performance (COP) for HVAC system is 4 as per 2016 ASHRAE requirements.
• Rate of Electricity ($/kWh) in San Antonio, TX is $0.09.
Results & Conclusions:
The solar radiation analysis for ‘Vida’ and ‘Retama’ indicate that ‘Retama’ receives 9.6% more solar radiation than ‘Vida’ due to greater exposure on the western façade. An increased amount of solar radiation results in higher cooling loads and system costs, occupant visual discomfort, and energy consumption. By analyzing and further optimizing the building’s solar orientation we can reduce solar heat gain, energy consumption, utility costs, urban heat island, while improving occupant comfort and wellness. Therefore, ‘Vida’ is a more energy efficient mass, as it reduces solar heat gain by 10.6% and saves $4,400 annually.


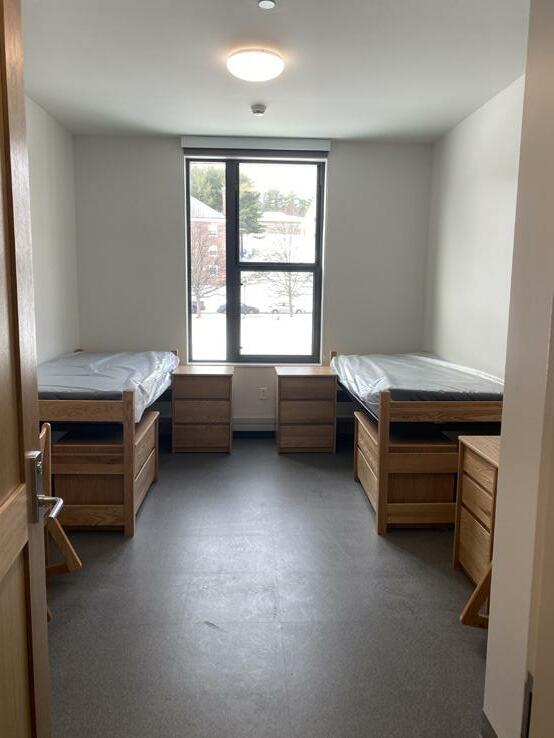
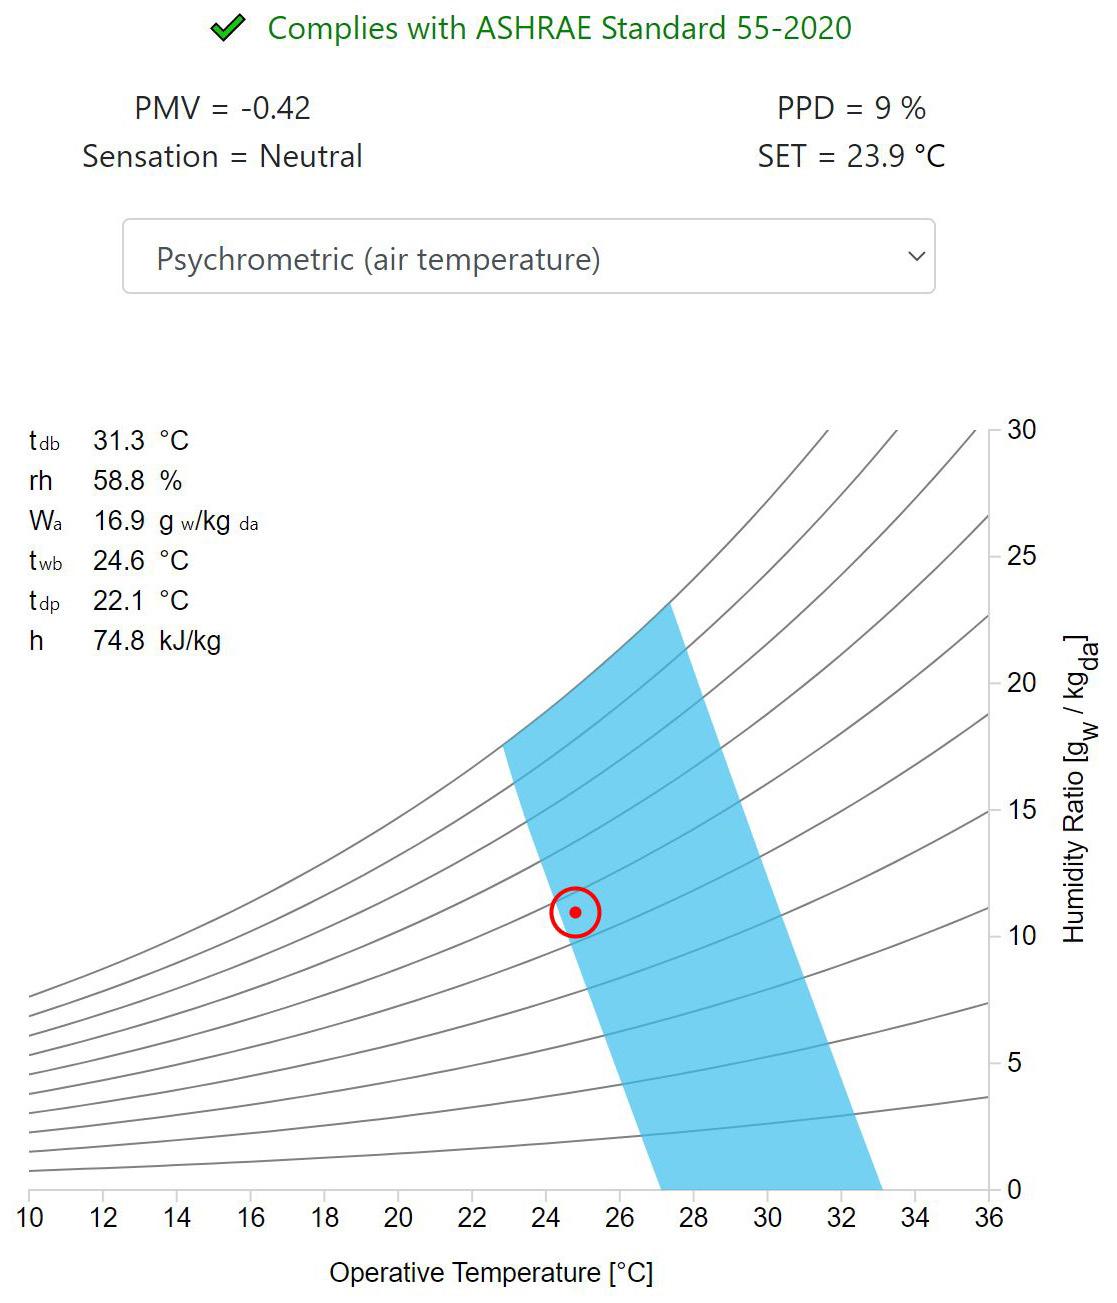
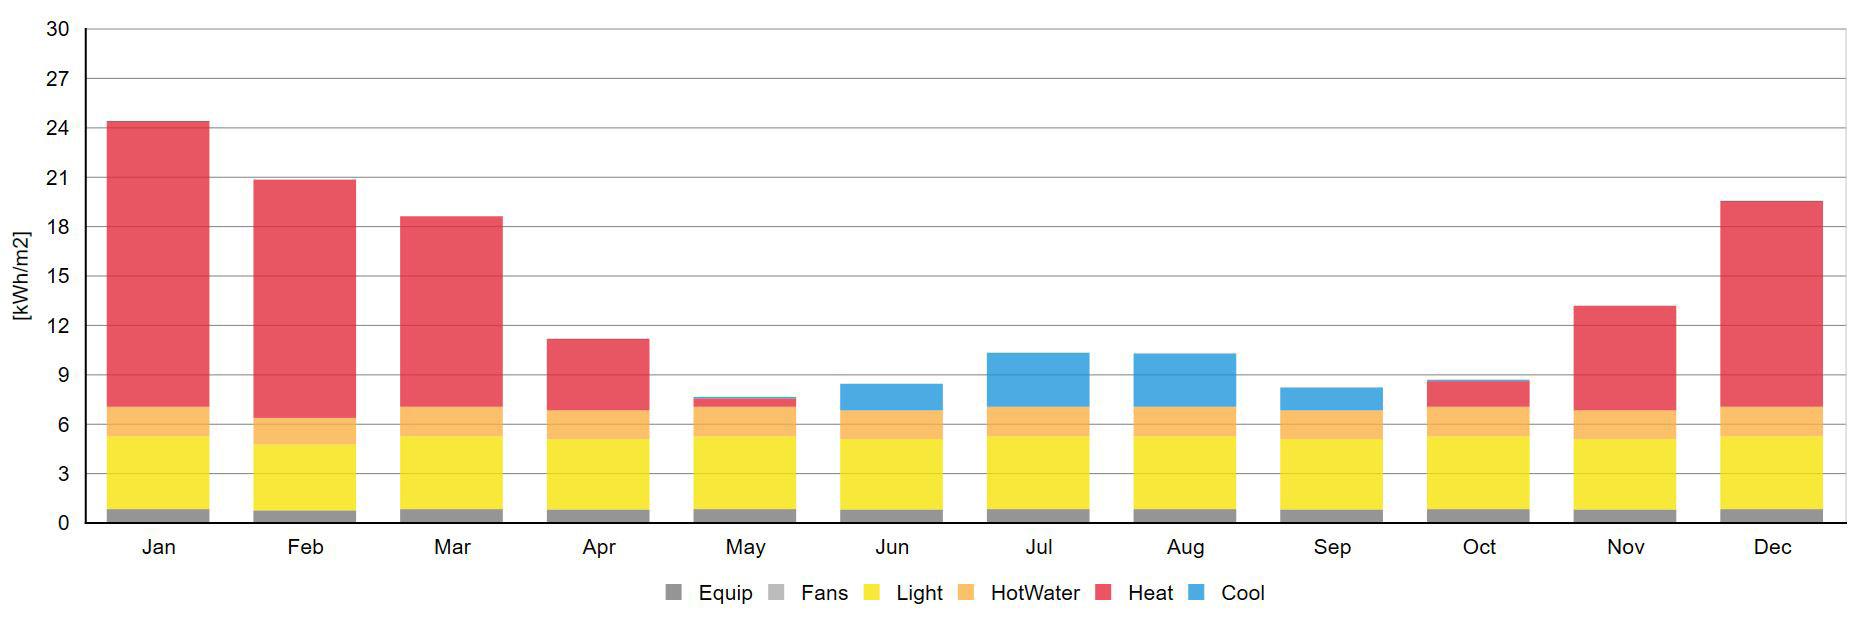
• Glazing has an east orientation.
• Wall R-Value is 17.88 (h ft2 K)/Btu with Adiabatic Boundary Condition.
• Glass Types: Solar Heat Gain Coefficients (SHGCs) of 0.27 & 0.38, while U-Value remains constant.
• Cost Savings/Year: -$3.59 with Energy Savings/Year: +2.0%.
• Heating Load/Capacity: 0.39 & Cooling Load/Capacity: 0.43.
• % of People Dissatisfied (PPD) for 0.38 when compared to 0.27: Heating Loads (August 15th): 2.0% Less & Cooling Loads (January 15th): No Difference.

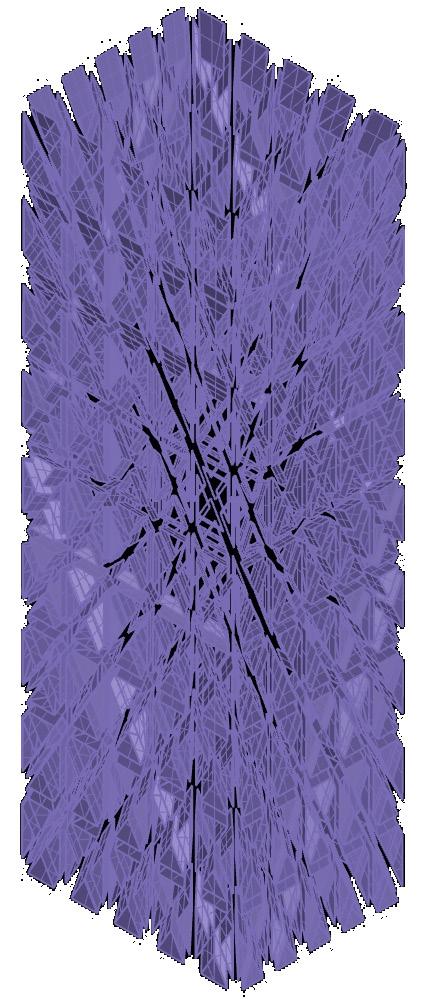
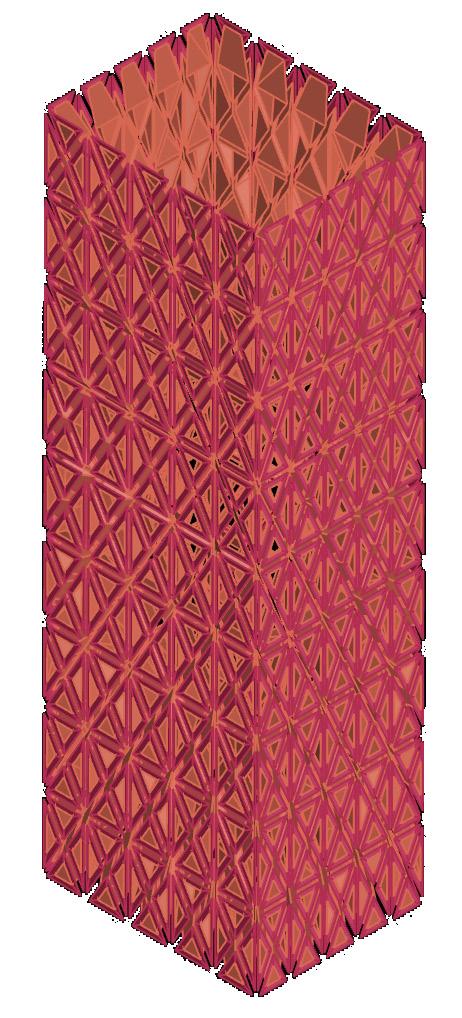
The goal was to use the relationship between the elements such as core, floors, facade patterning, and structure to understand the design of complex geometries and test the extent of parametric variability of Hearst Headquarters. This study was conducted in Grasshopper. Paramteric Variability of two-dimensional geometric analysis was tested. A three-dimensional parti diagram was developed after research and an in-depth analysis of different components of the precedent.
The extent of parametric variability of three-dimensional parti diagram was tested. Significant explorations were made: The concavity and the octagonal curve of the floor slabs were modified by changing the parameters of 'Region Intersection'. The variability of trapezoidal surfaces was determined by 'Surface Four Points'.
Lunchbox, sub-division, evaluate surface, and loft surface patterning strategies were used to test the parametric variability of the facade system. Its response to macro parametric variation has been demonstrated.
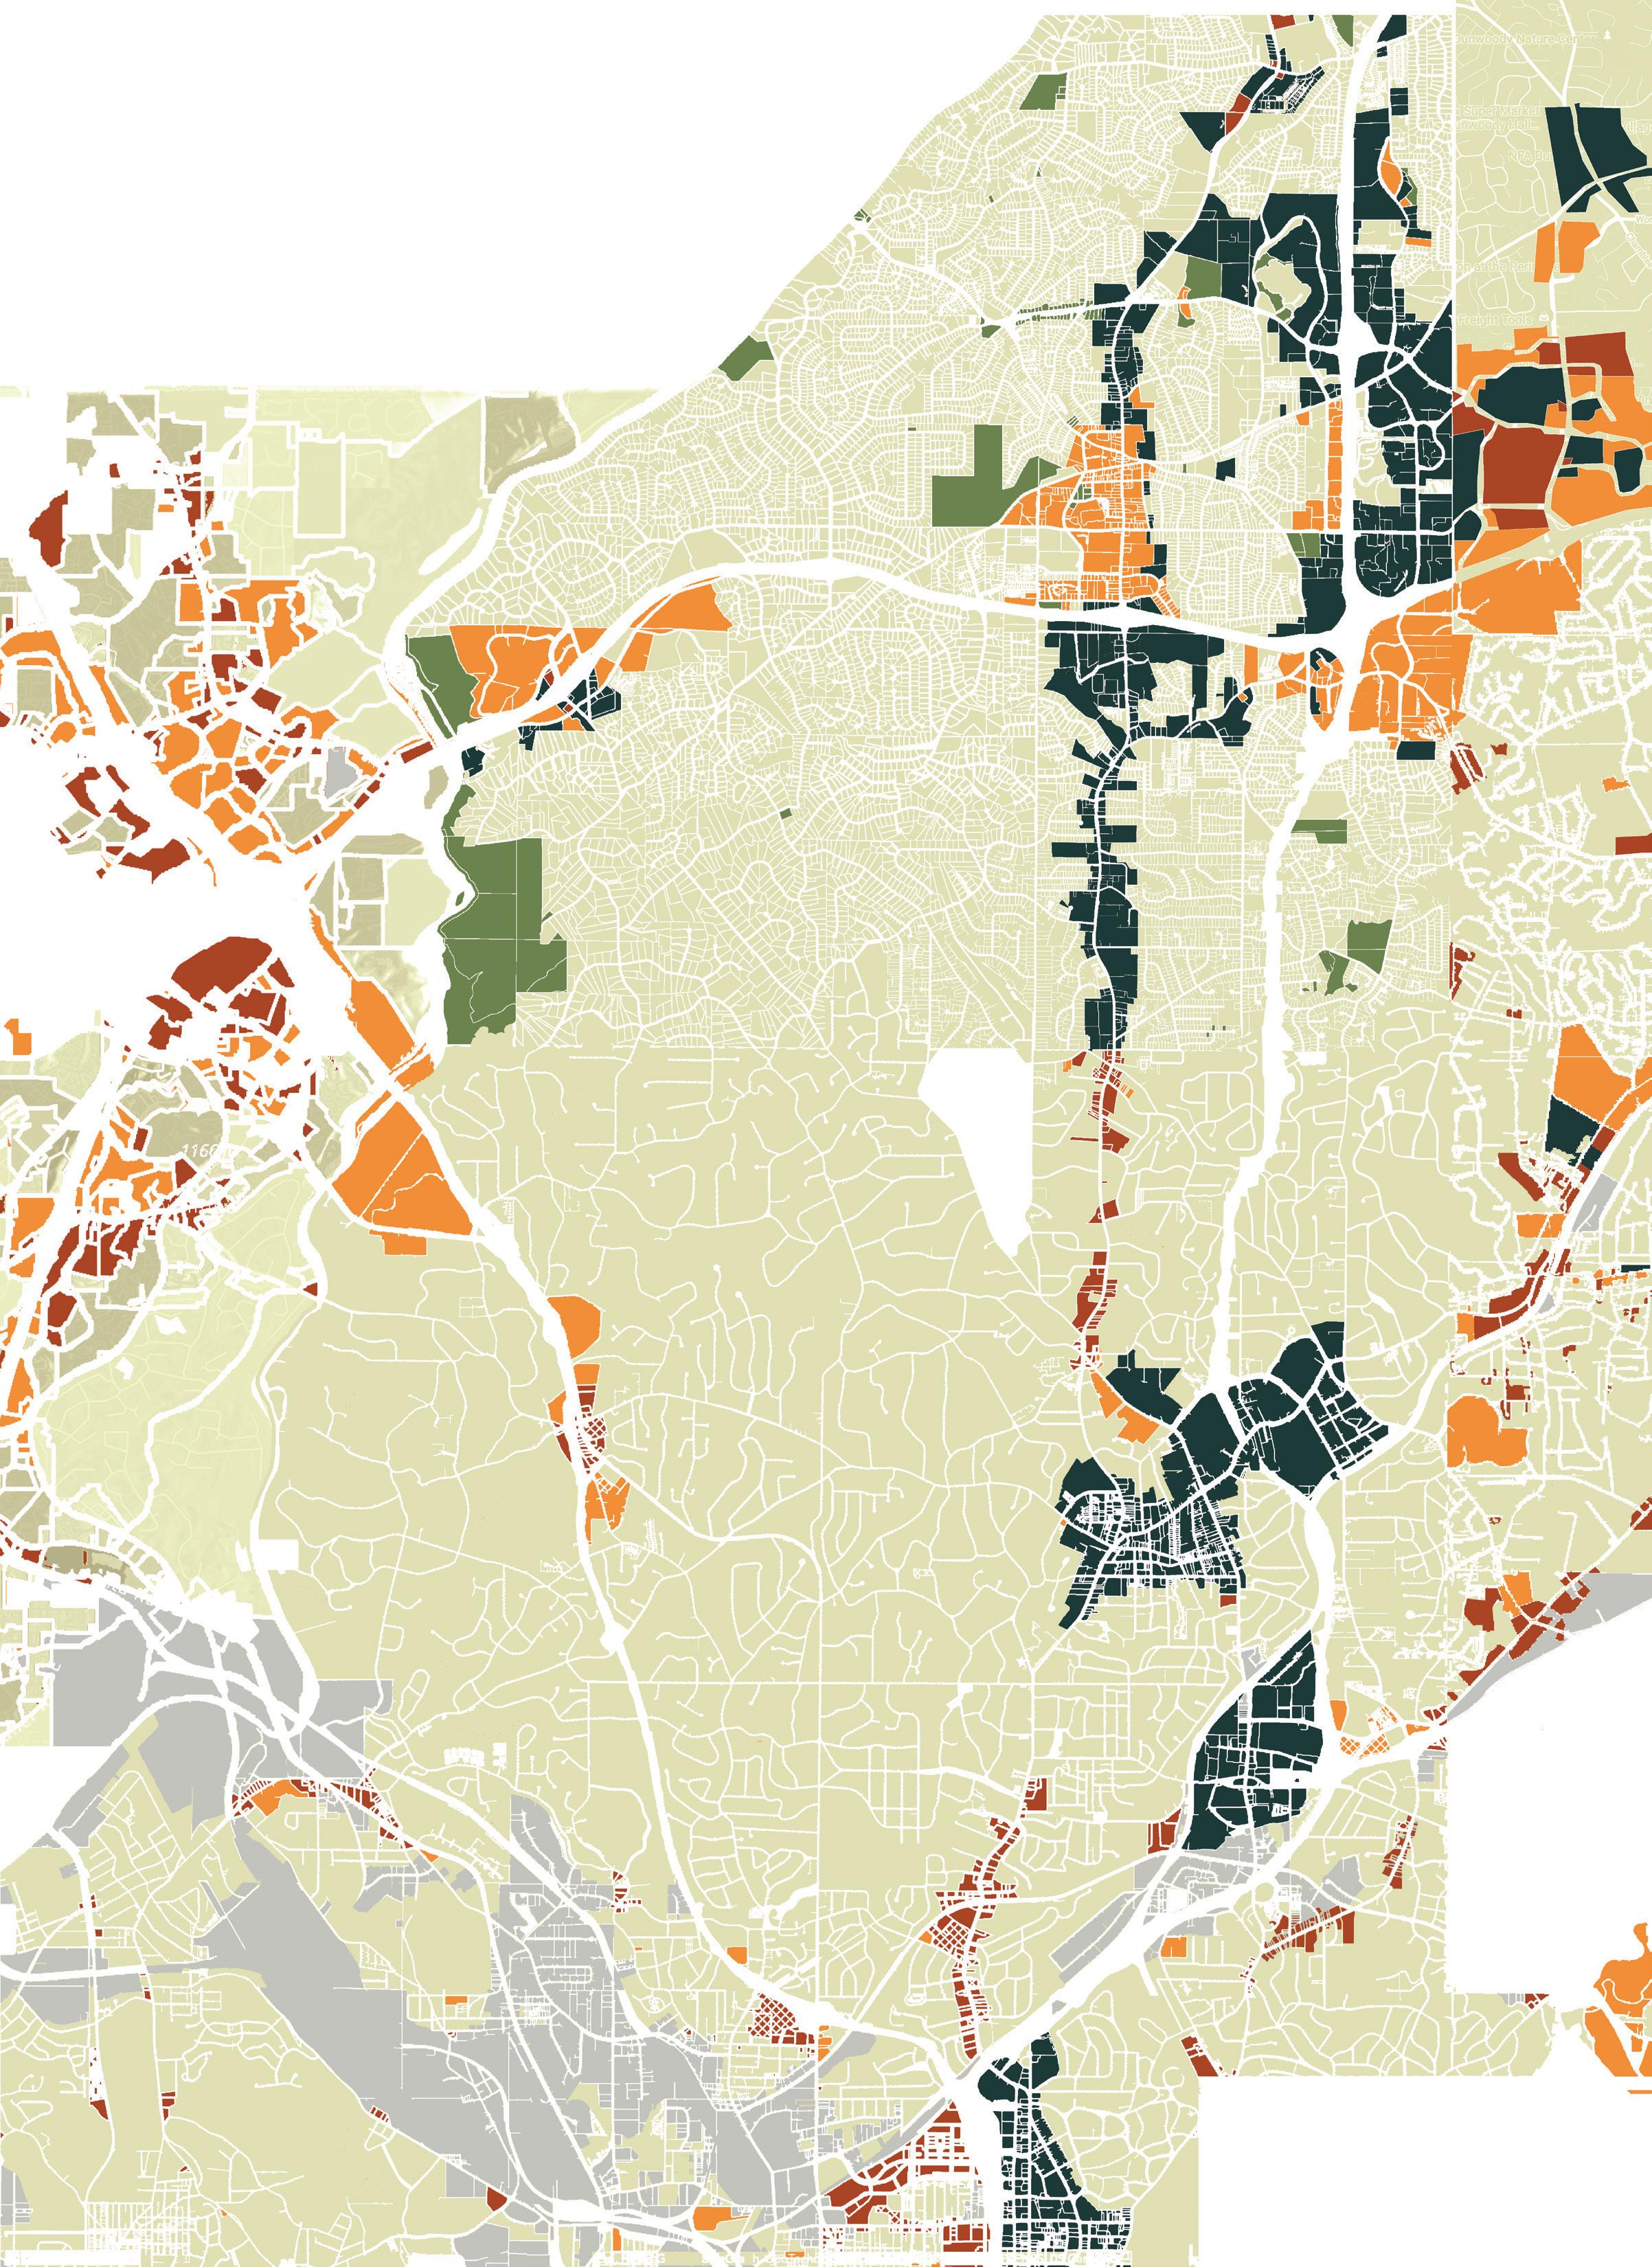
The goal of the studio for fall 2022 semester was to design an ecovillage. A group of 12 students were told to study and present different precedents of exisiting ecovillages to understand the concept and take inspiration for different policies and design strategies deployed in each. As a group, we decided to proceed with Chastain Golf Course in Atlanta, Georgia as our site. We were initially divided into four different groups as ‘Zoning & Policy’, ‘Transportation & Infrastructure’, ‘Urban Design & Public Space’, and ‘Social Services & Community Development’. I was a part of the ‘Transportation & Infrastructure’ team and took responsibility for infrastrature for the entire community.
The entire project was presented on three different scales as ecovillage, neighborhood, and individual housing projects. The ecovillage policies and strategies were introduced in the following manner: precedents, demographics, program & goals, site & context, transportation & master plan, zoning & policy, and urban design & infrastructure.
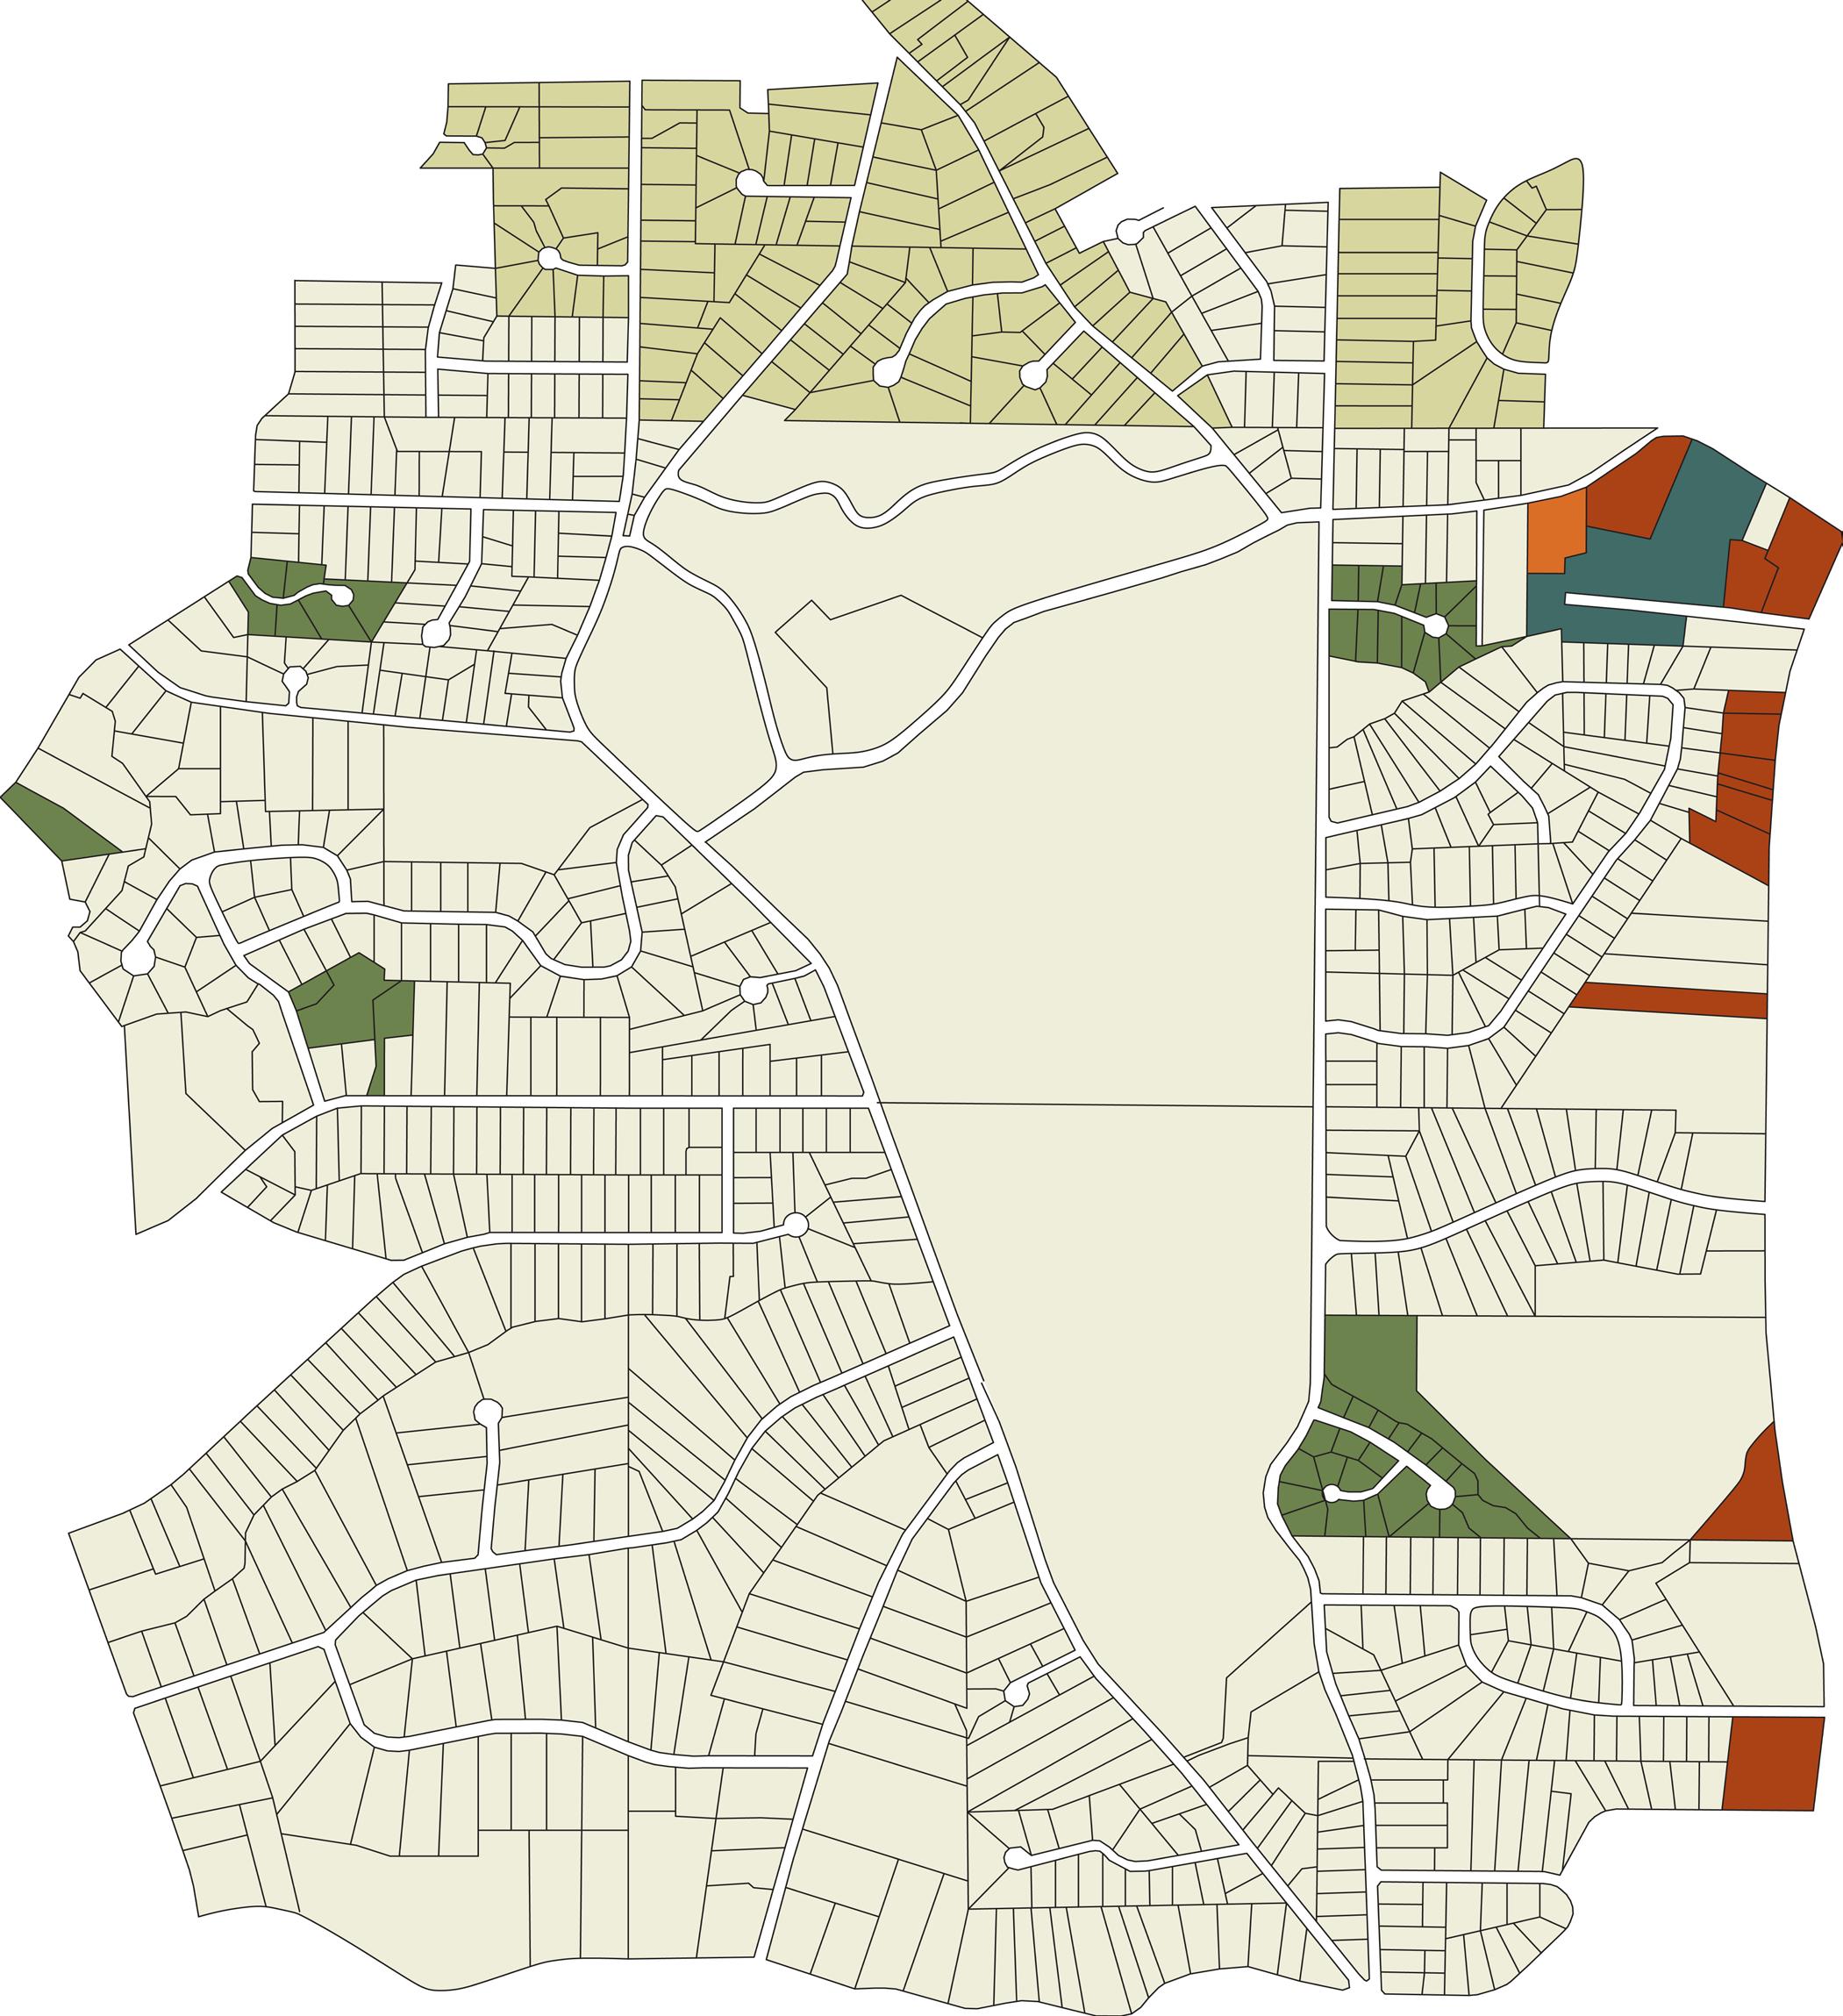
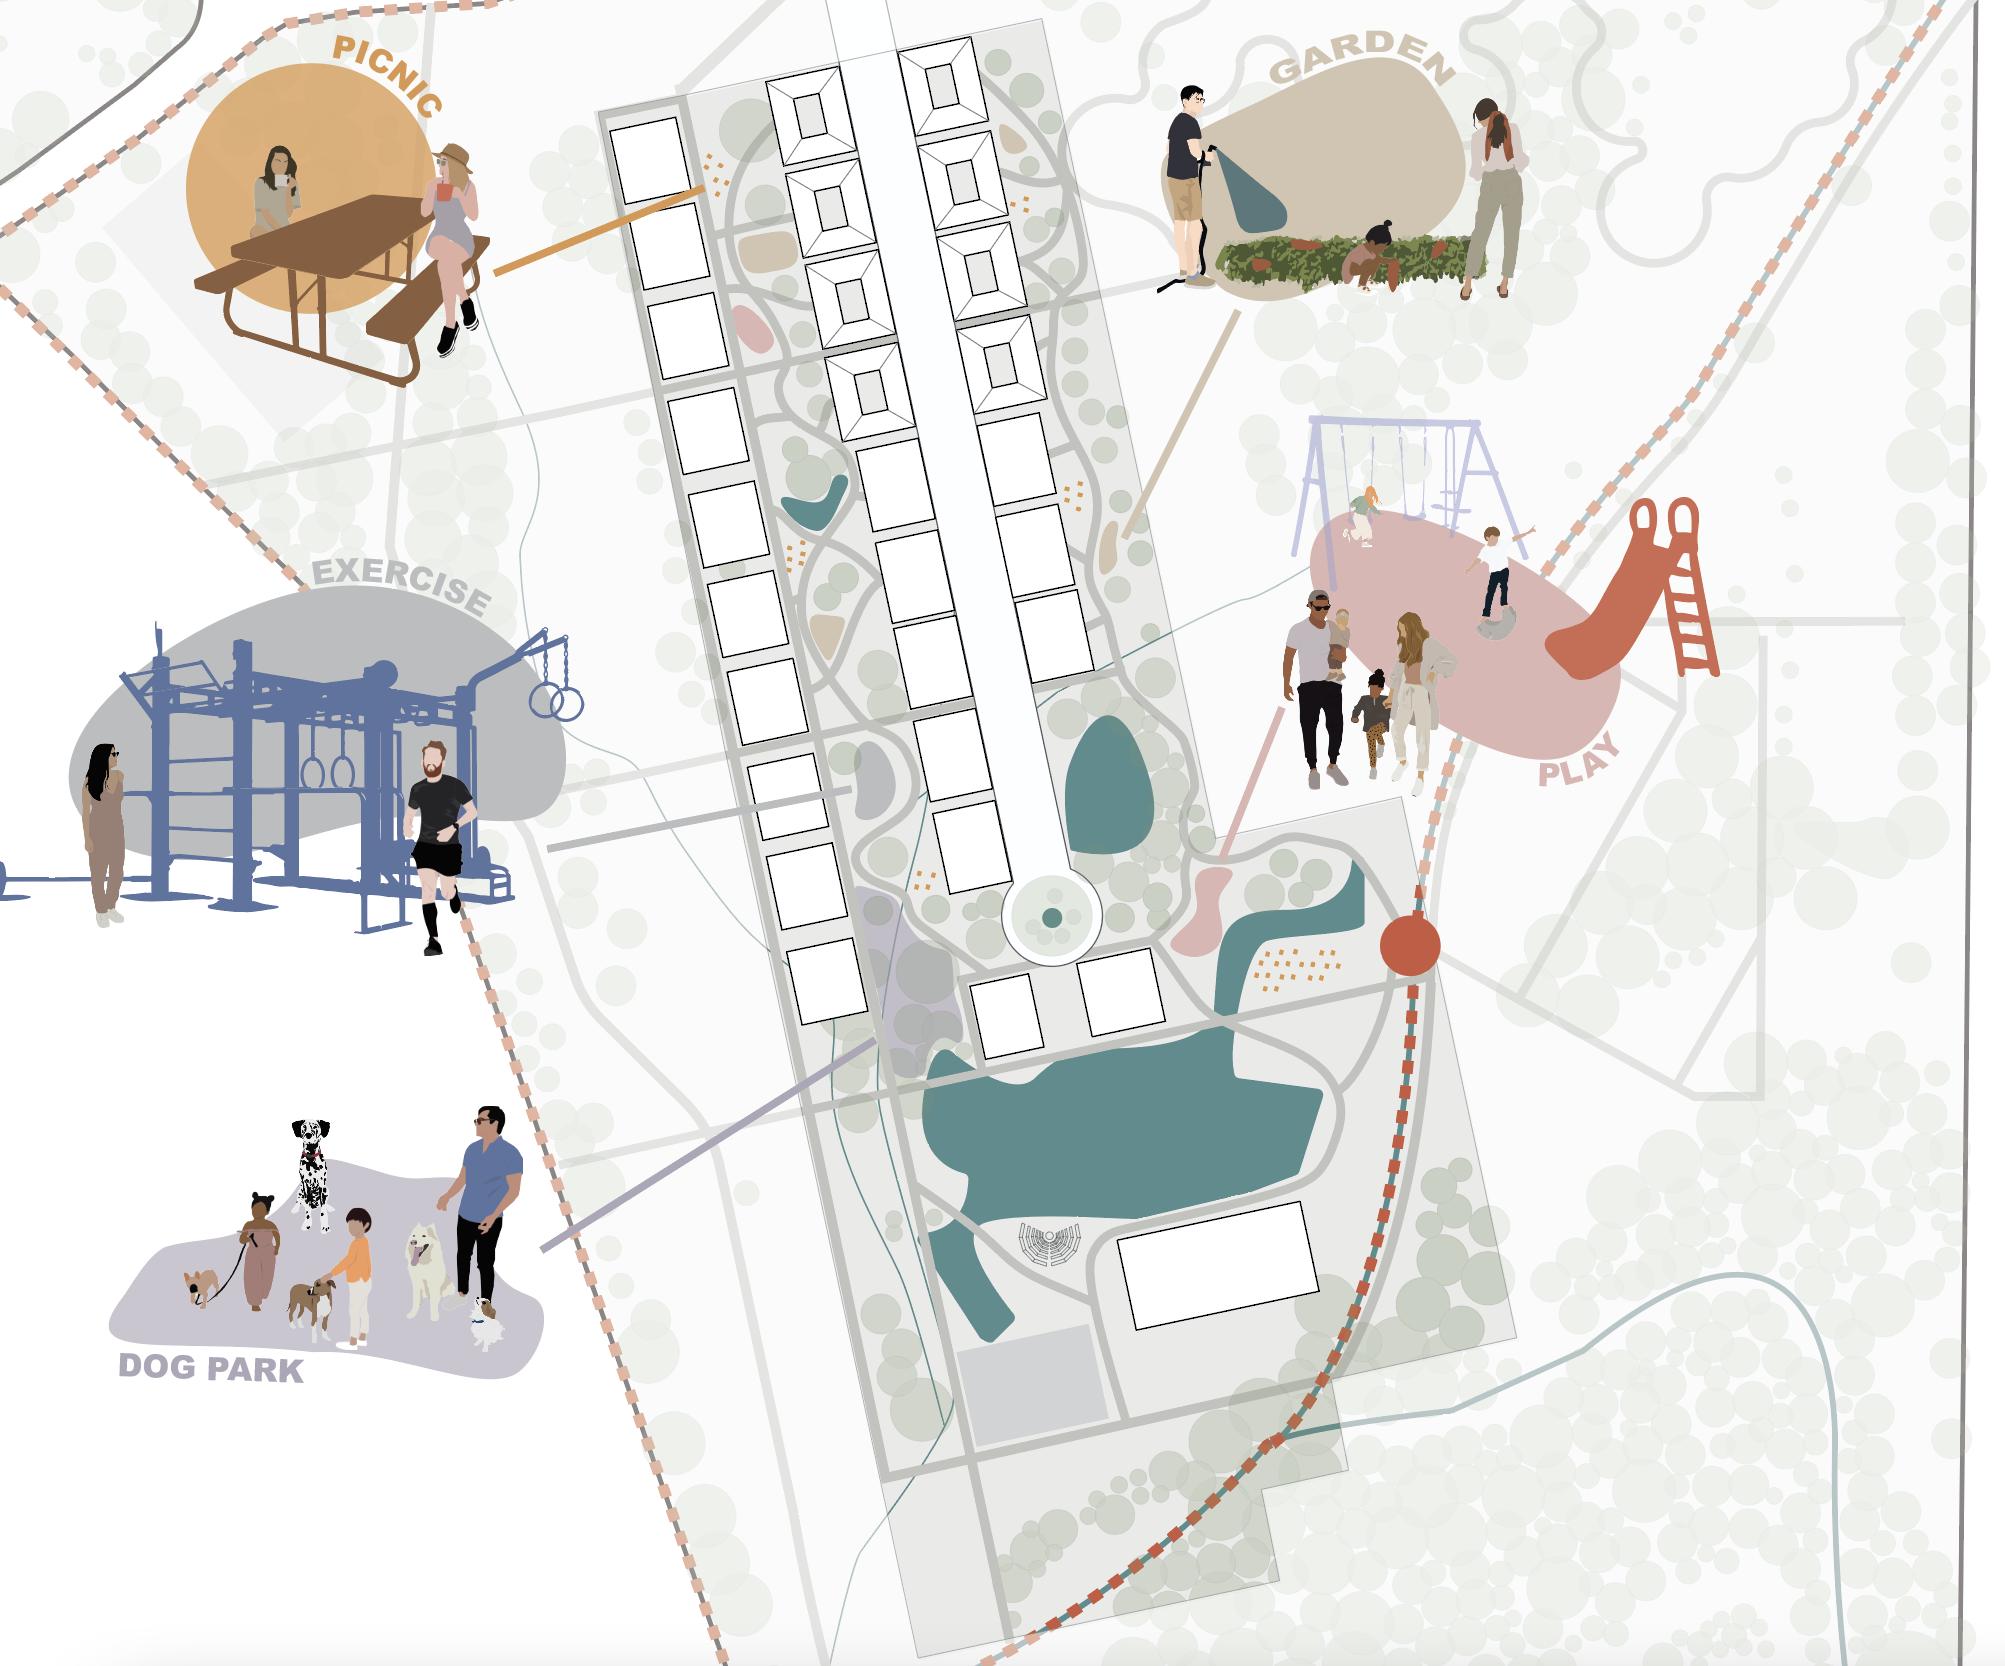
The master plan was broken down into four different neighborhoods based on the densities and the types of housing that each student wanted to focus on. I was a part of the ‘Living Street’ neighborhood as shown below. The ‘Living Street’ neighborhood houses residences that have retail spaces and live/work spaces. It runs along the main street till the retention pond located in the center of the site. It incorporates important community buildings such as the library, the water treatment plant, and the city hall. Additionally it incorporates different programs of landscape architecture such as garden spaces, picnic spaces, workout spaces, and dog parks.
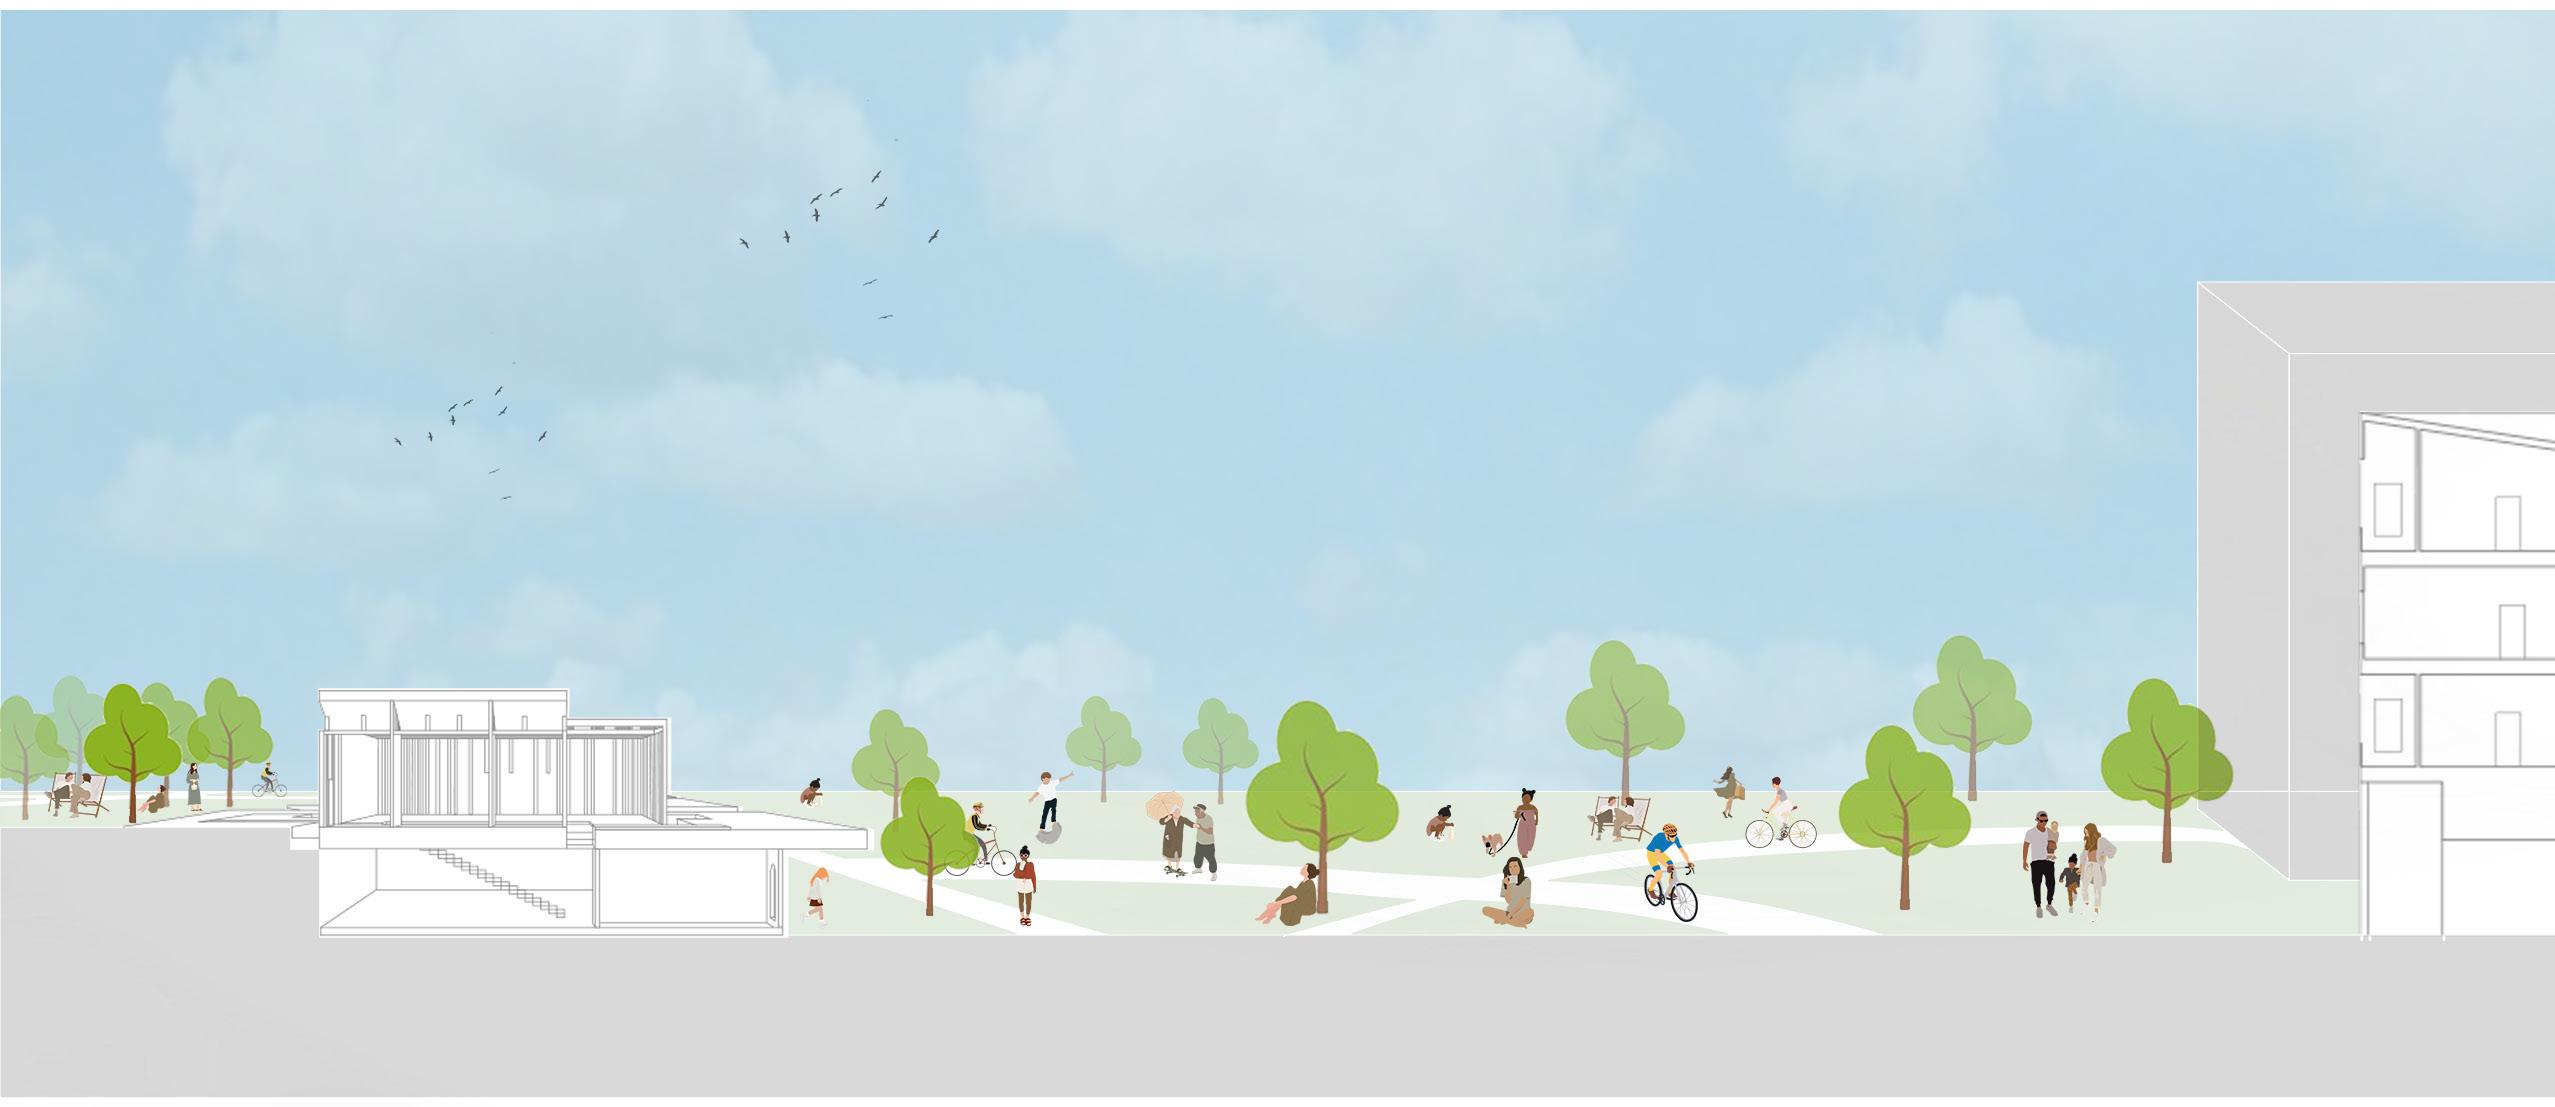
A sectional view that cuts across in the east-west direction. The drawing reveals different acitvities that take place in the garden spaces and dog parks, three different housing types proposed by three different students, and the modes of transportation that are allowed to access the site as decided by the transportation and infrastructure sector.


Cabin over Cave
Individual Project under Chastain Ecovillage Multi- Family Live & Work Space, Living Street Neighborhood
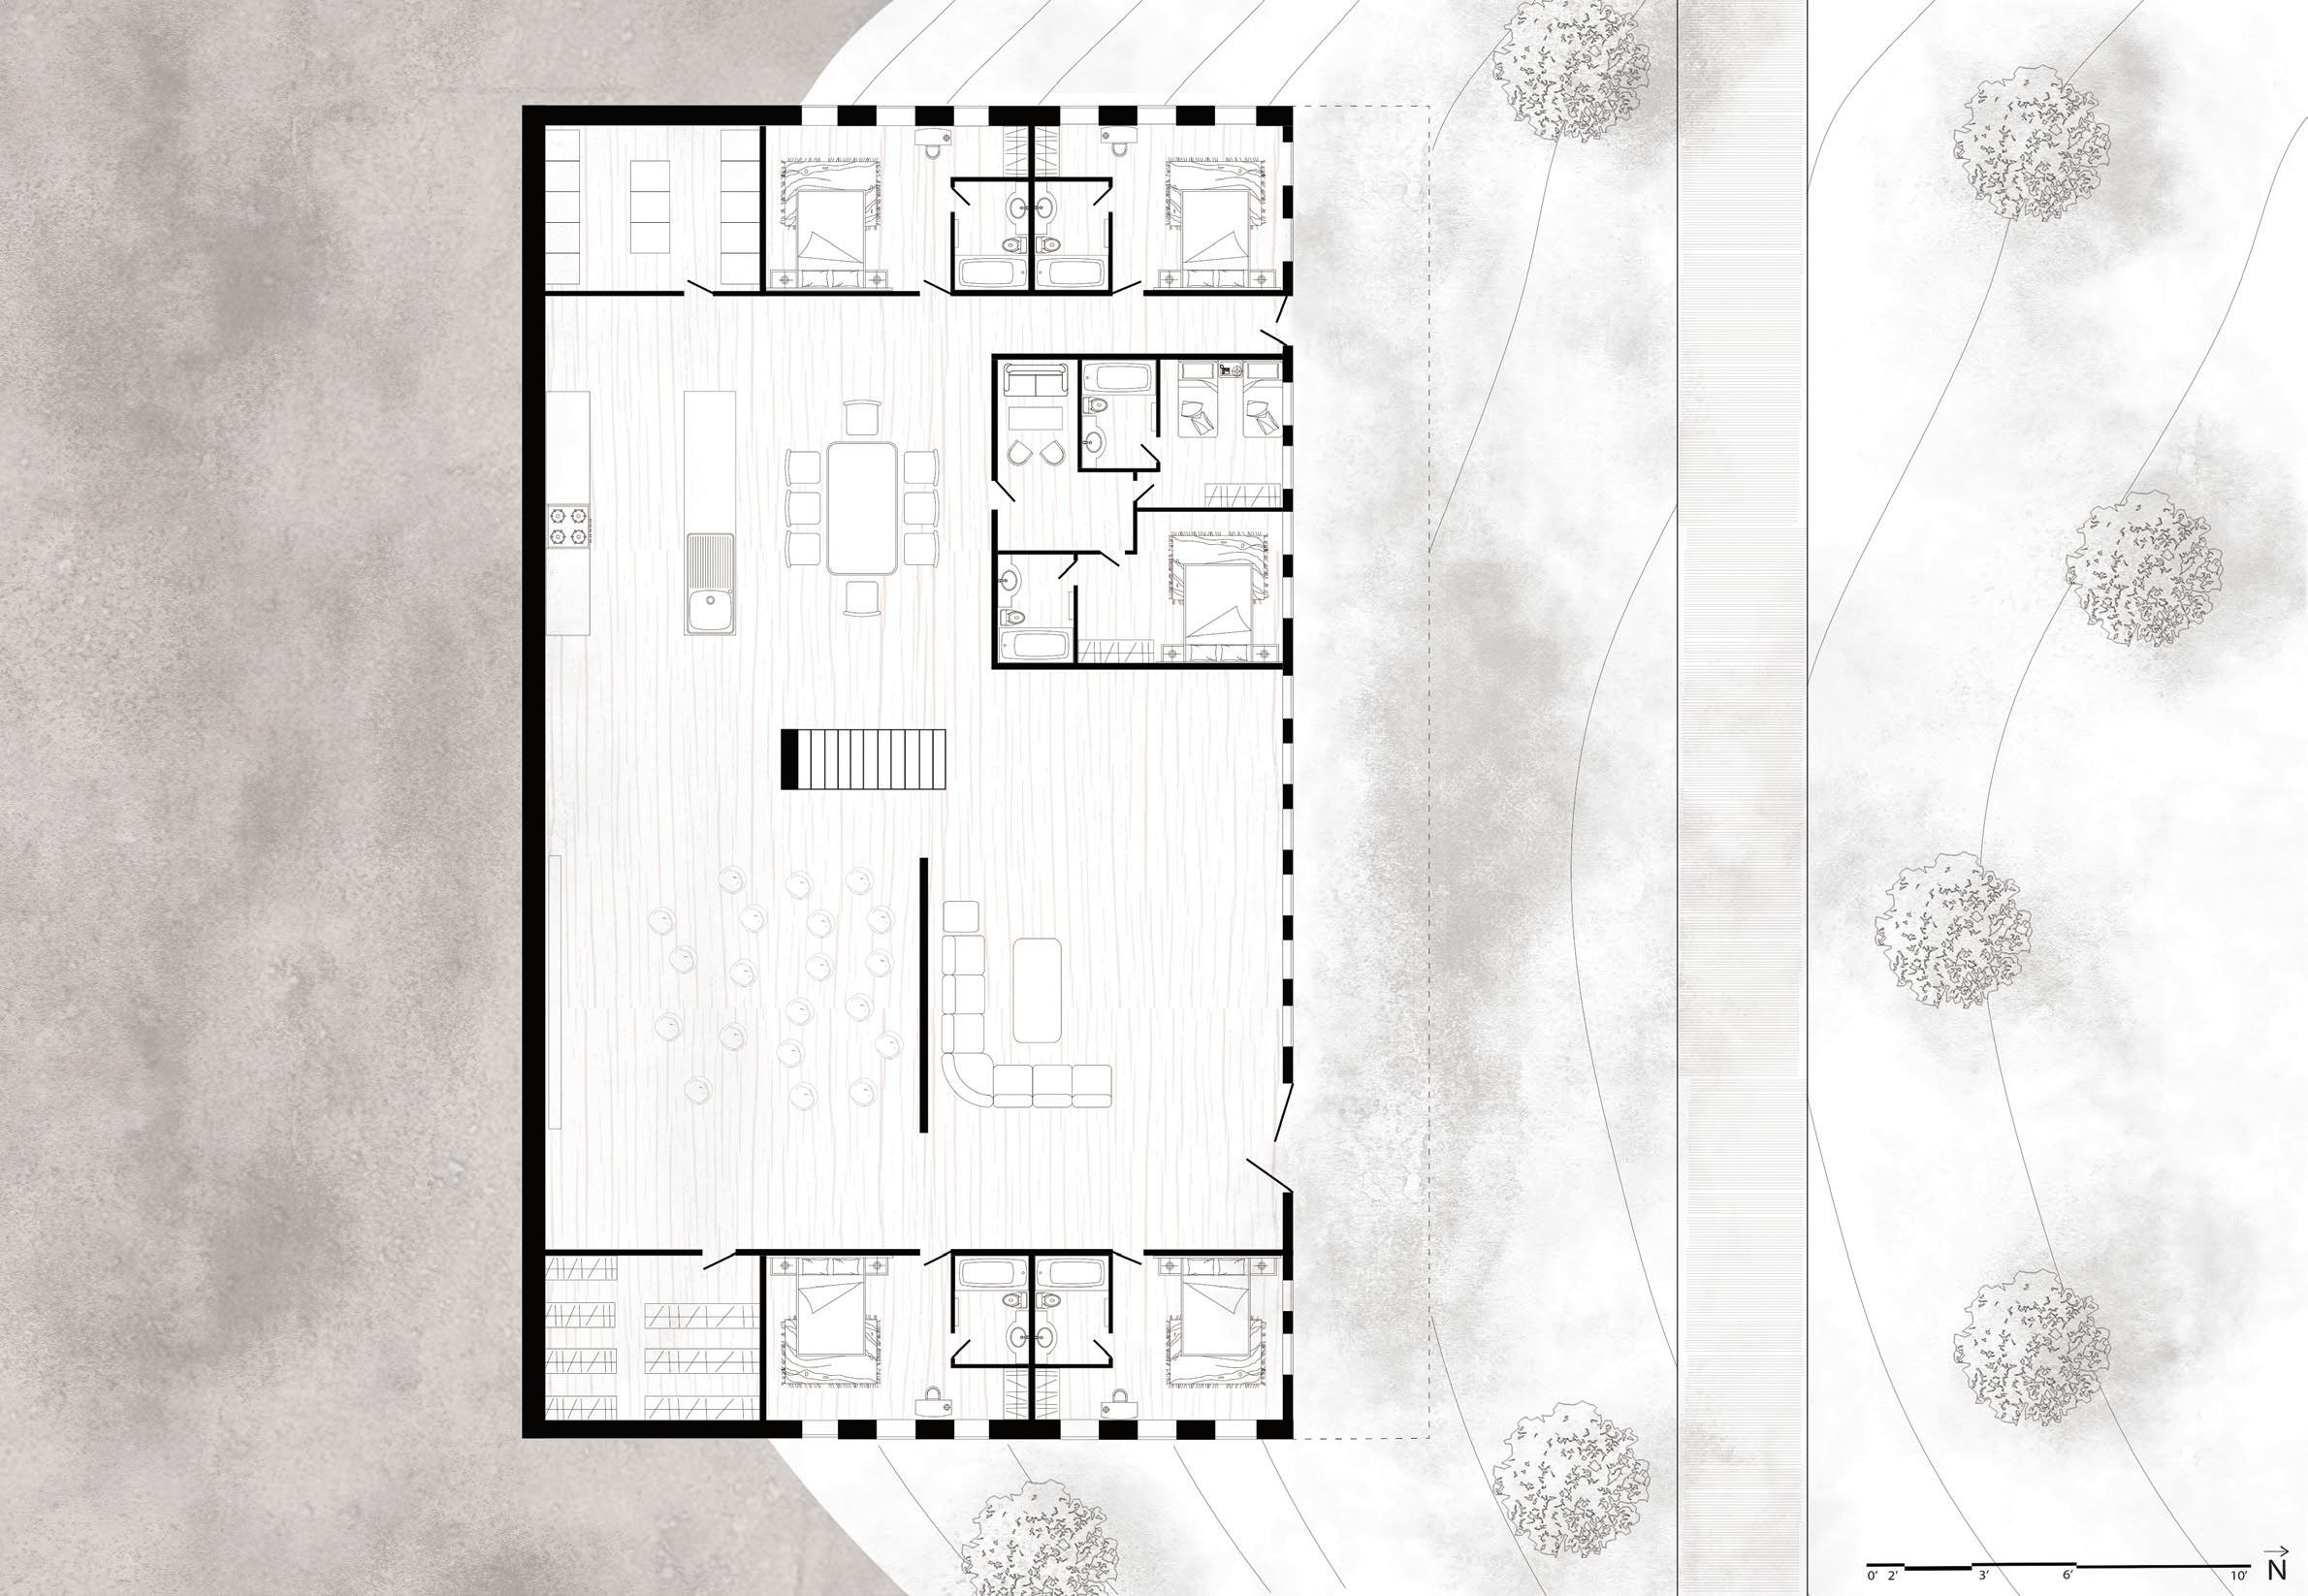
Cabin over Cave, a live & work space, was designed individually. It has been placed in the ‘Living Street’ as it houses working population or small families who access the urban areas and retail spaces everyday. The housing has been placed after the landscapes that serve as a buffer zone between the main street and the residential structures.
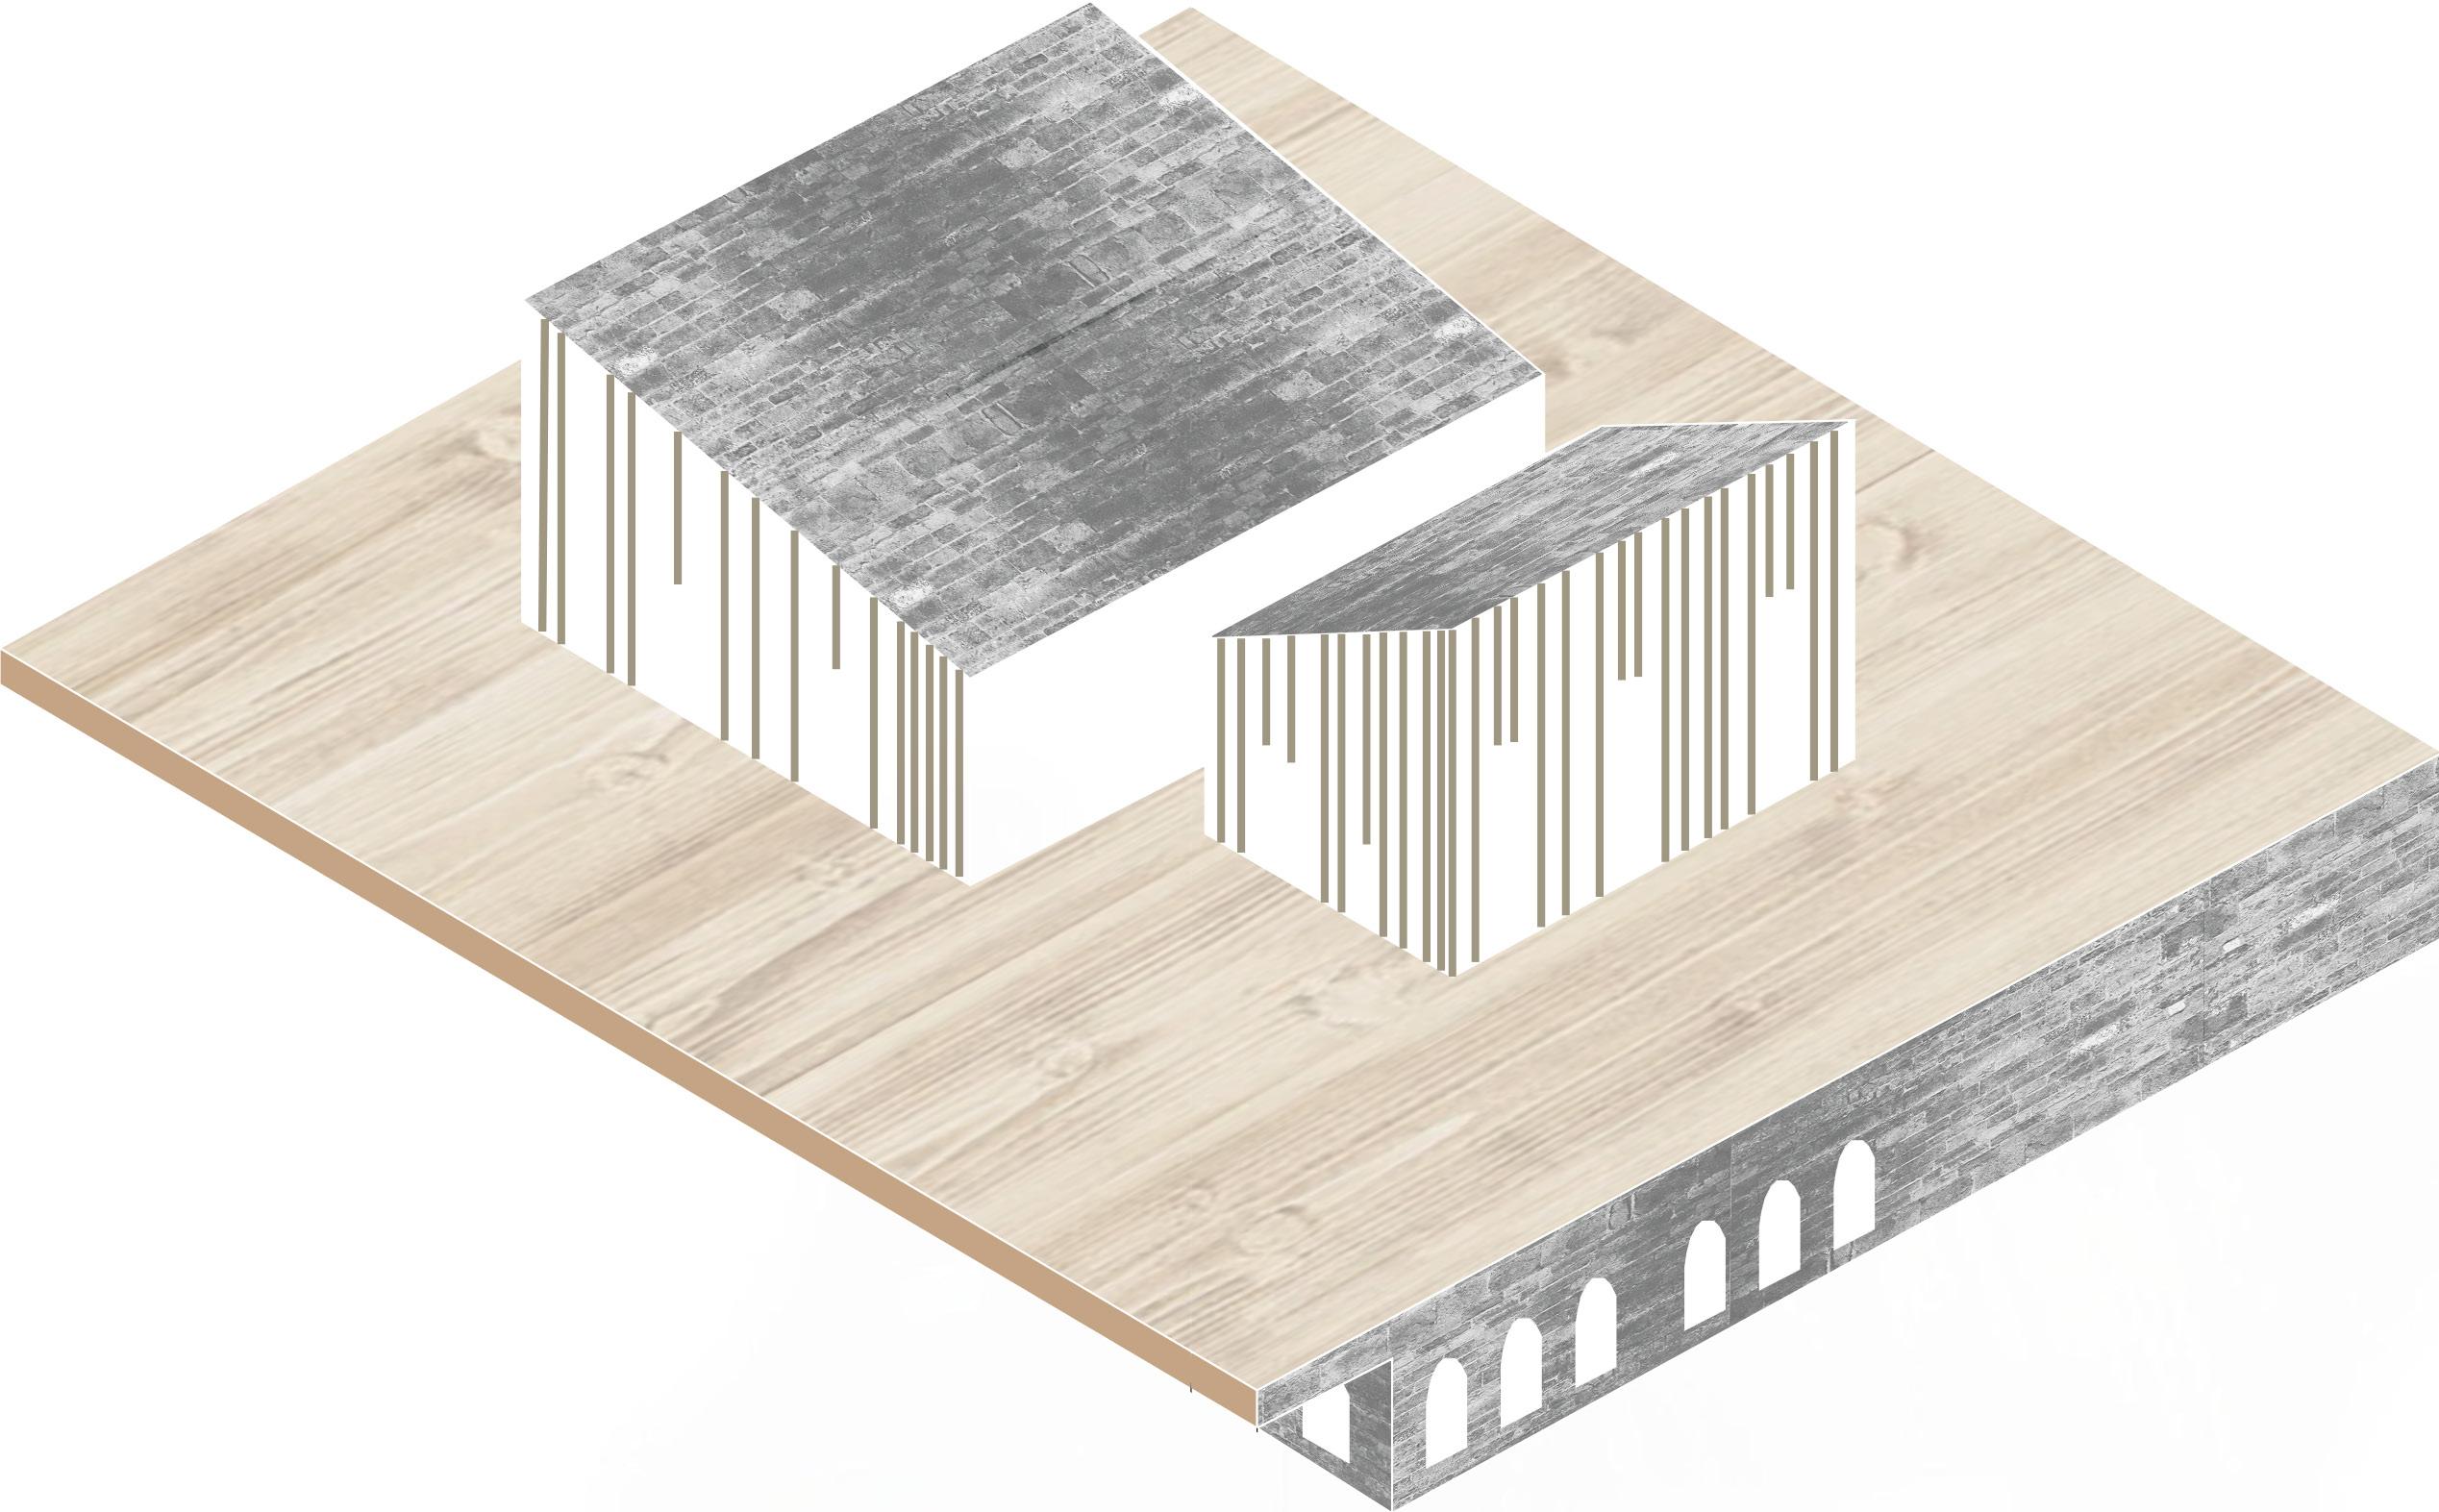
This project takes inspiration from Olnick Spanu House in response to the uneven topography. Living spaces are enclosed in the cave, while the shared and the work spaces remain in the two boxes above, open to the gardens. Sustainable design strategies such as water harvesting and solar radiation analysis are considered to tie back into the design and reduce the overall energy consumption of multi-family housing.
An emphasis on the materiality has been made in the diagram below which is why it has been named ‘Cabin over Cave’. The materiality and the public & private diagrams highlight how the private spaces remain enclosed in the hidden and organic part of the project as compared to the public and work spaces that remain exposed in the structures above made of wood and glass.
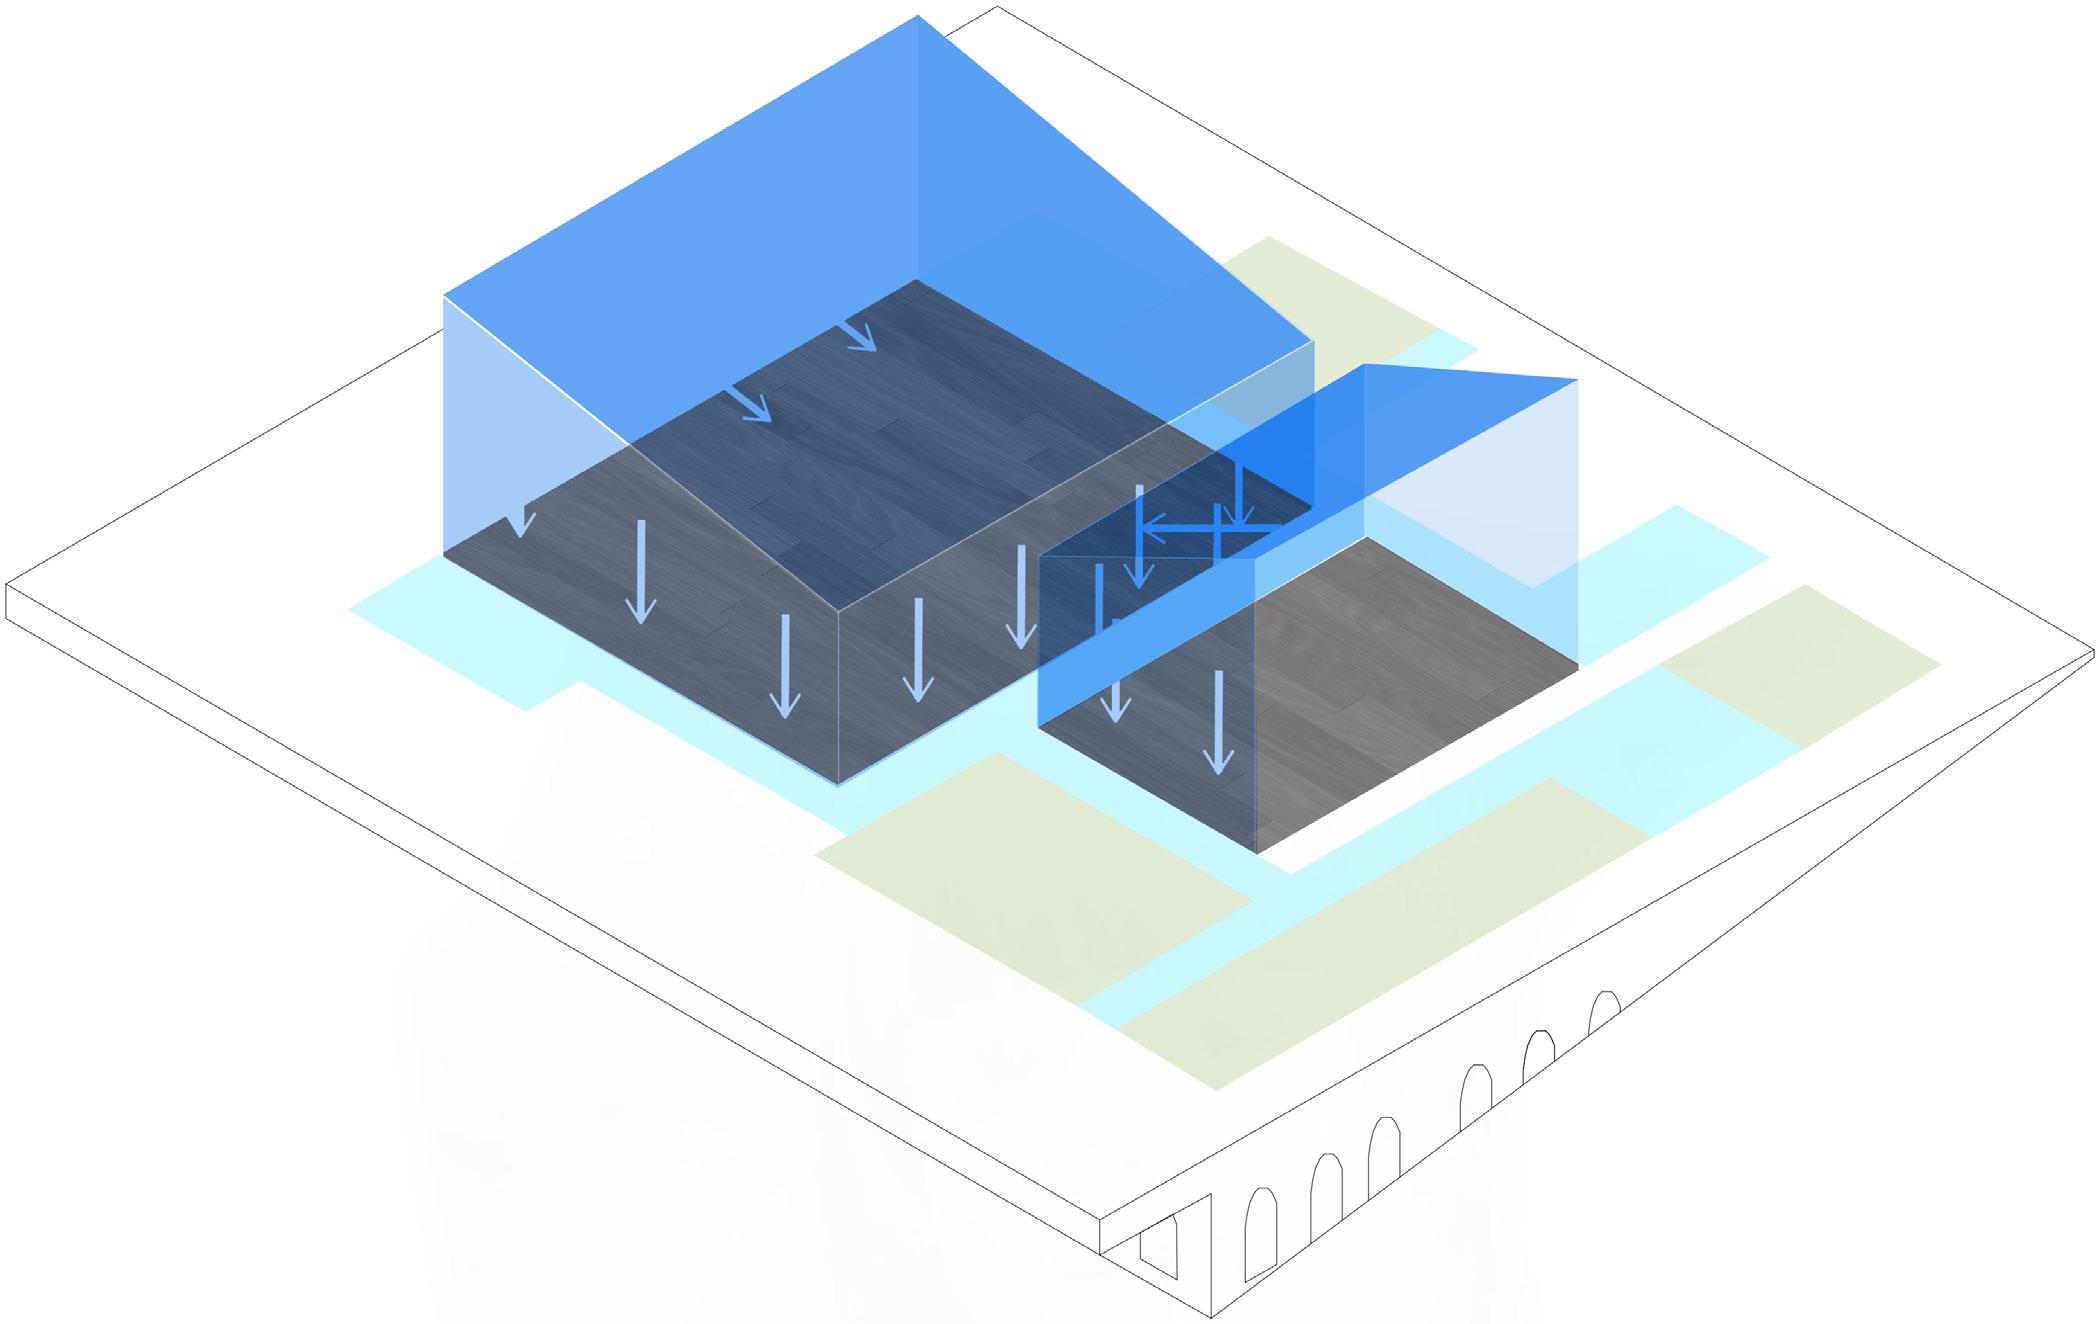
The water harvesting diagram emphasizes on how the water is directed into the three feet channels on the roof deck through the two sloping roofs. The water is filtered within these channels to keep it clean and the excess water is directed into the ground water table through hidden channels.
Water Harvesting
South East
Solar Panels
North
West
The east - west and north - south sections reveal how the direct sunlight is diffused into the different programs of the project. The water channels on the roof deck work as skylights to bring light into the public spaces housed in the cave. The solar panels oriented at a forty five degree angle in the south orientation harness solar radiation as well.
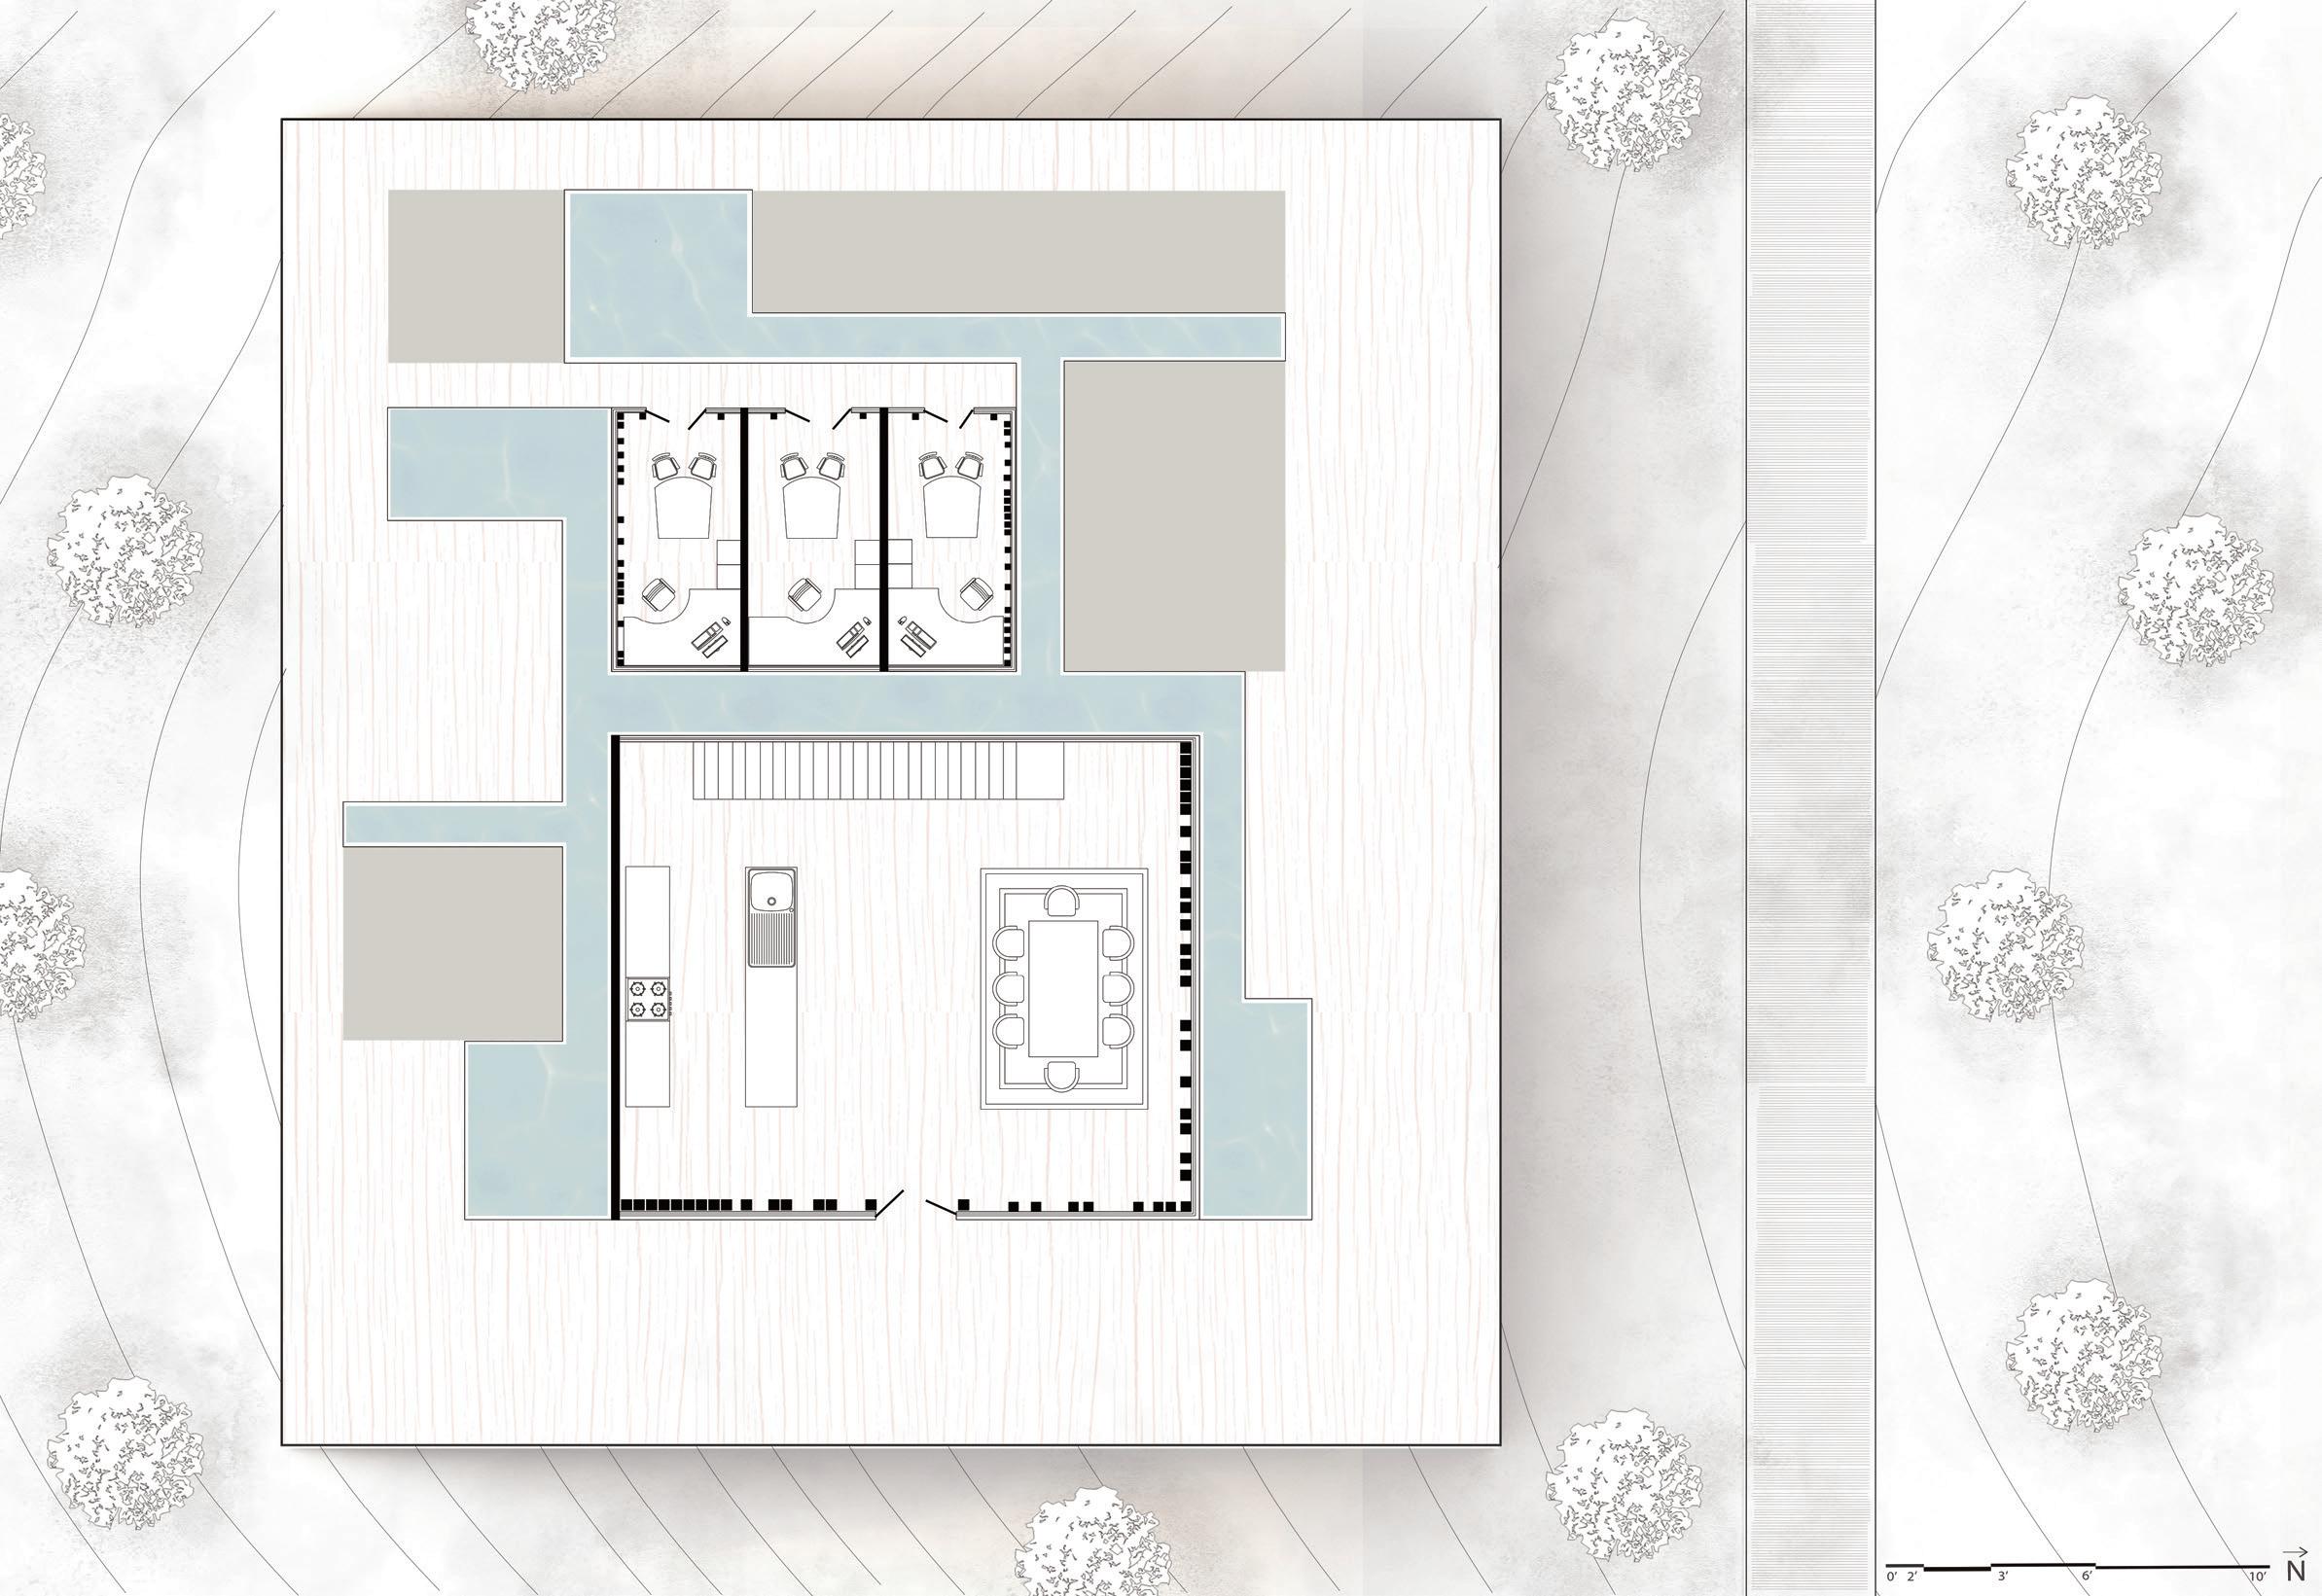
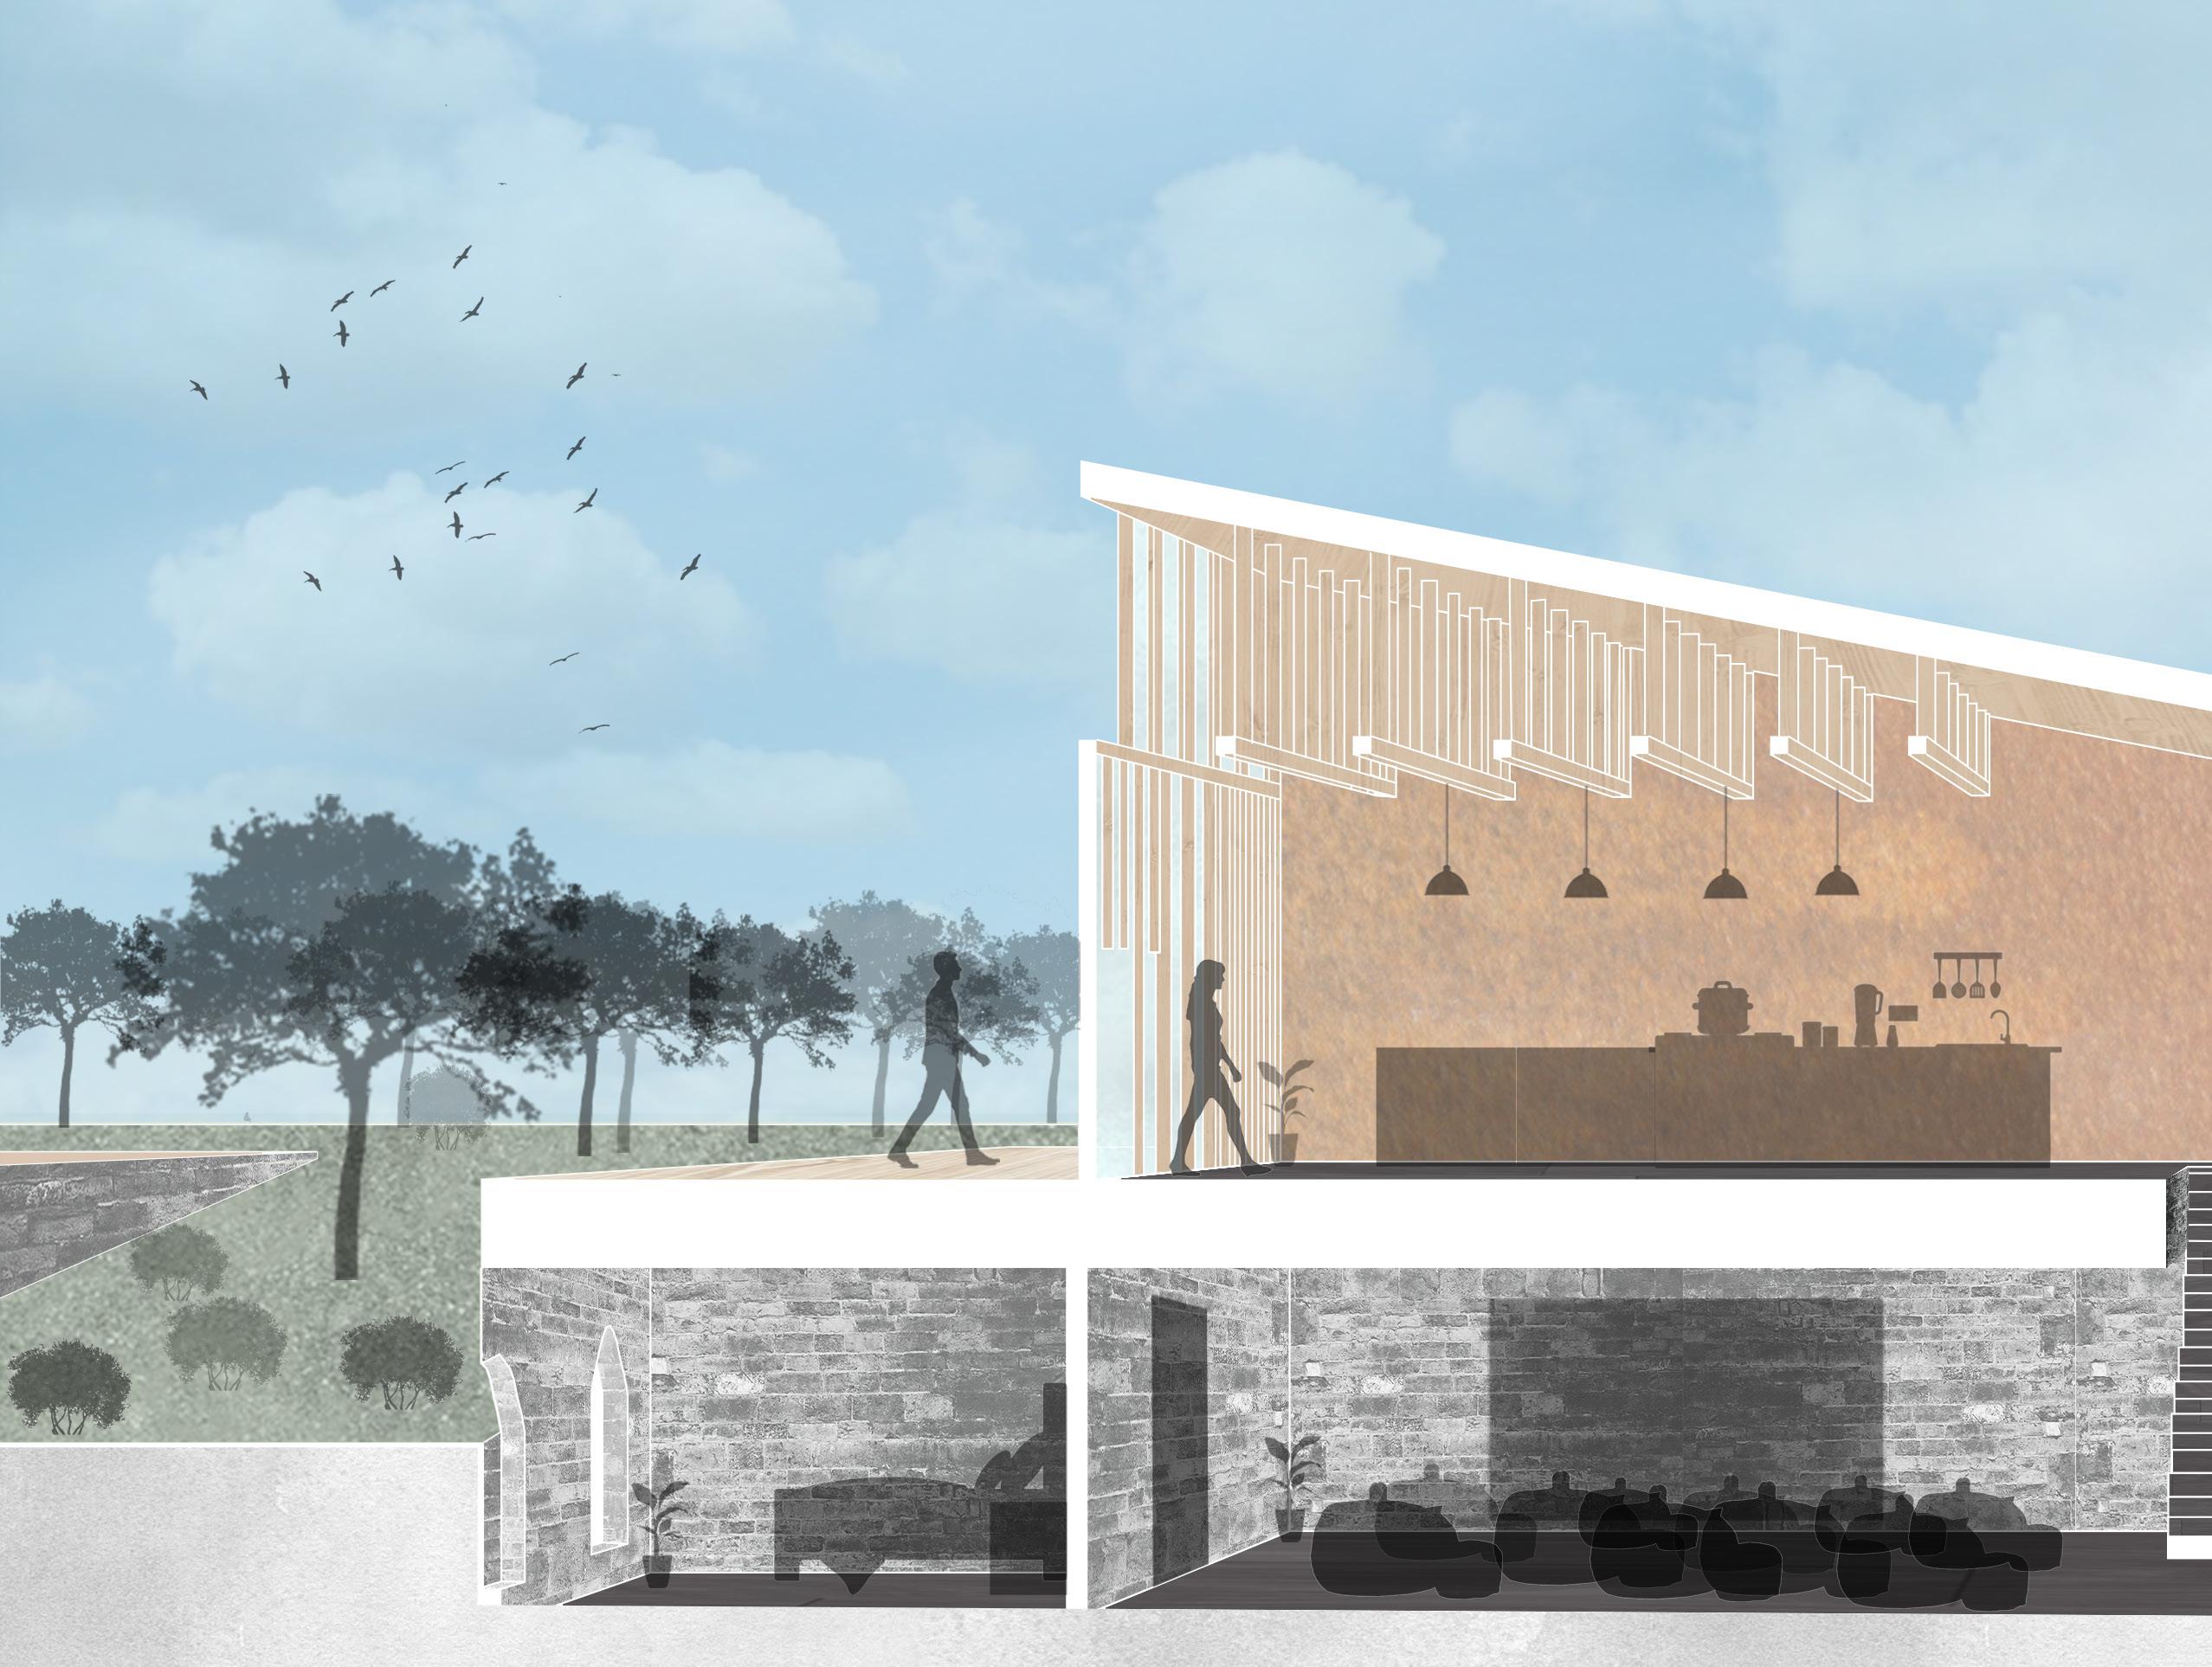
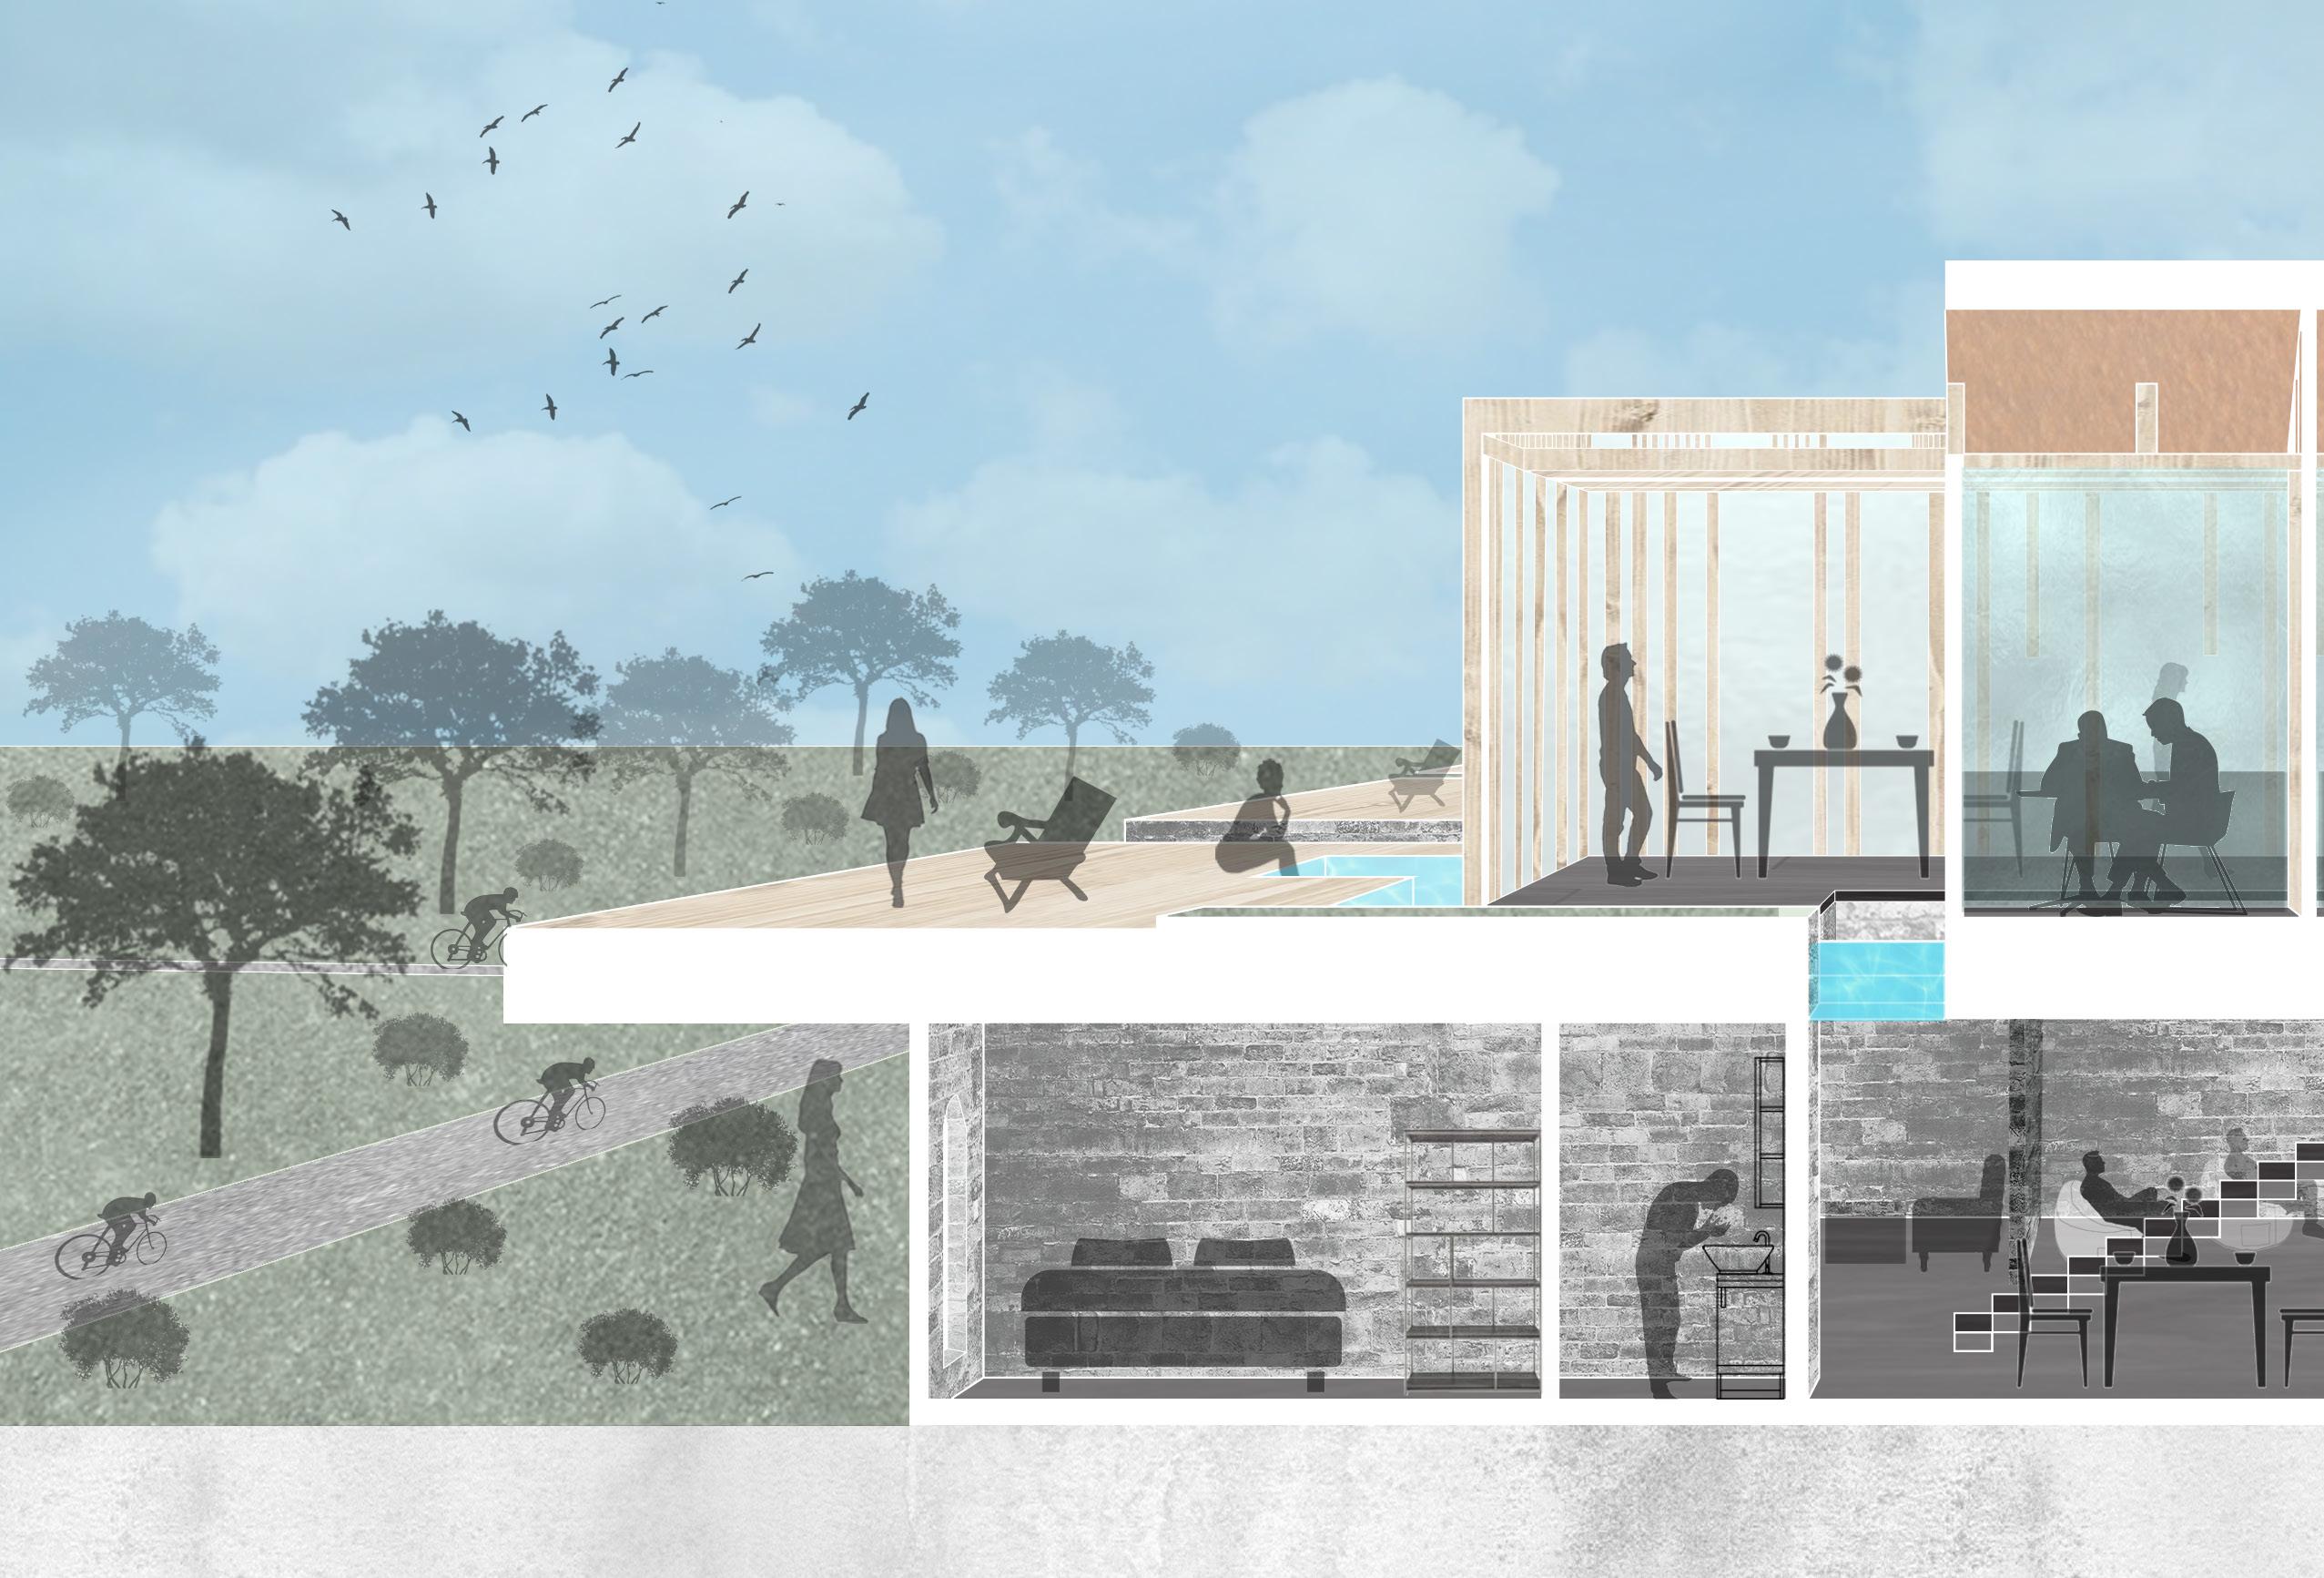 Section A - North to South
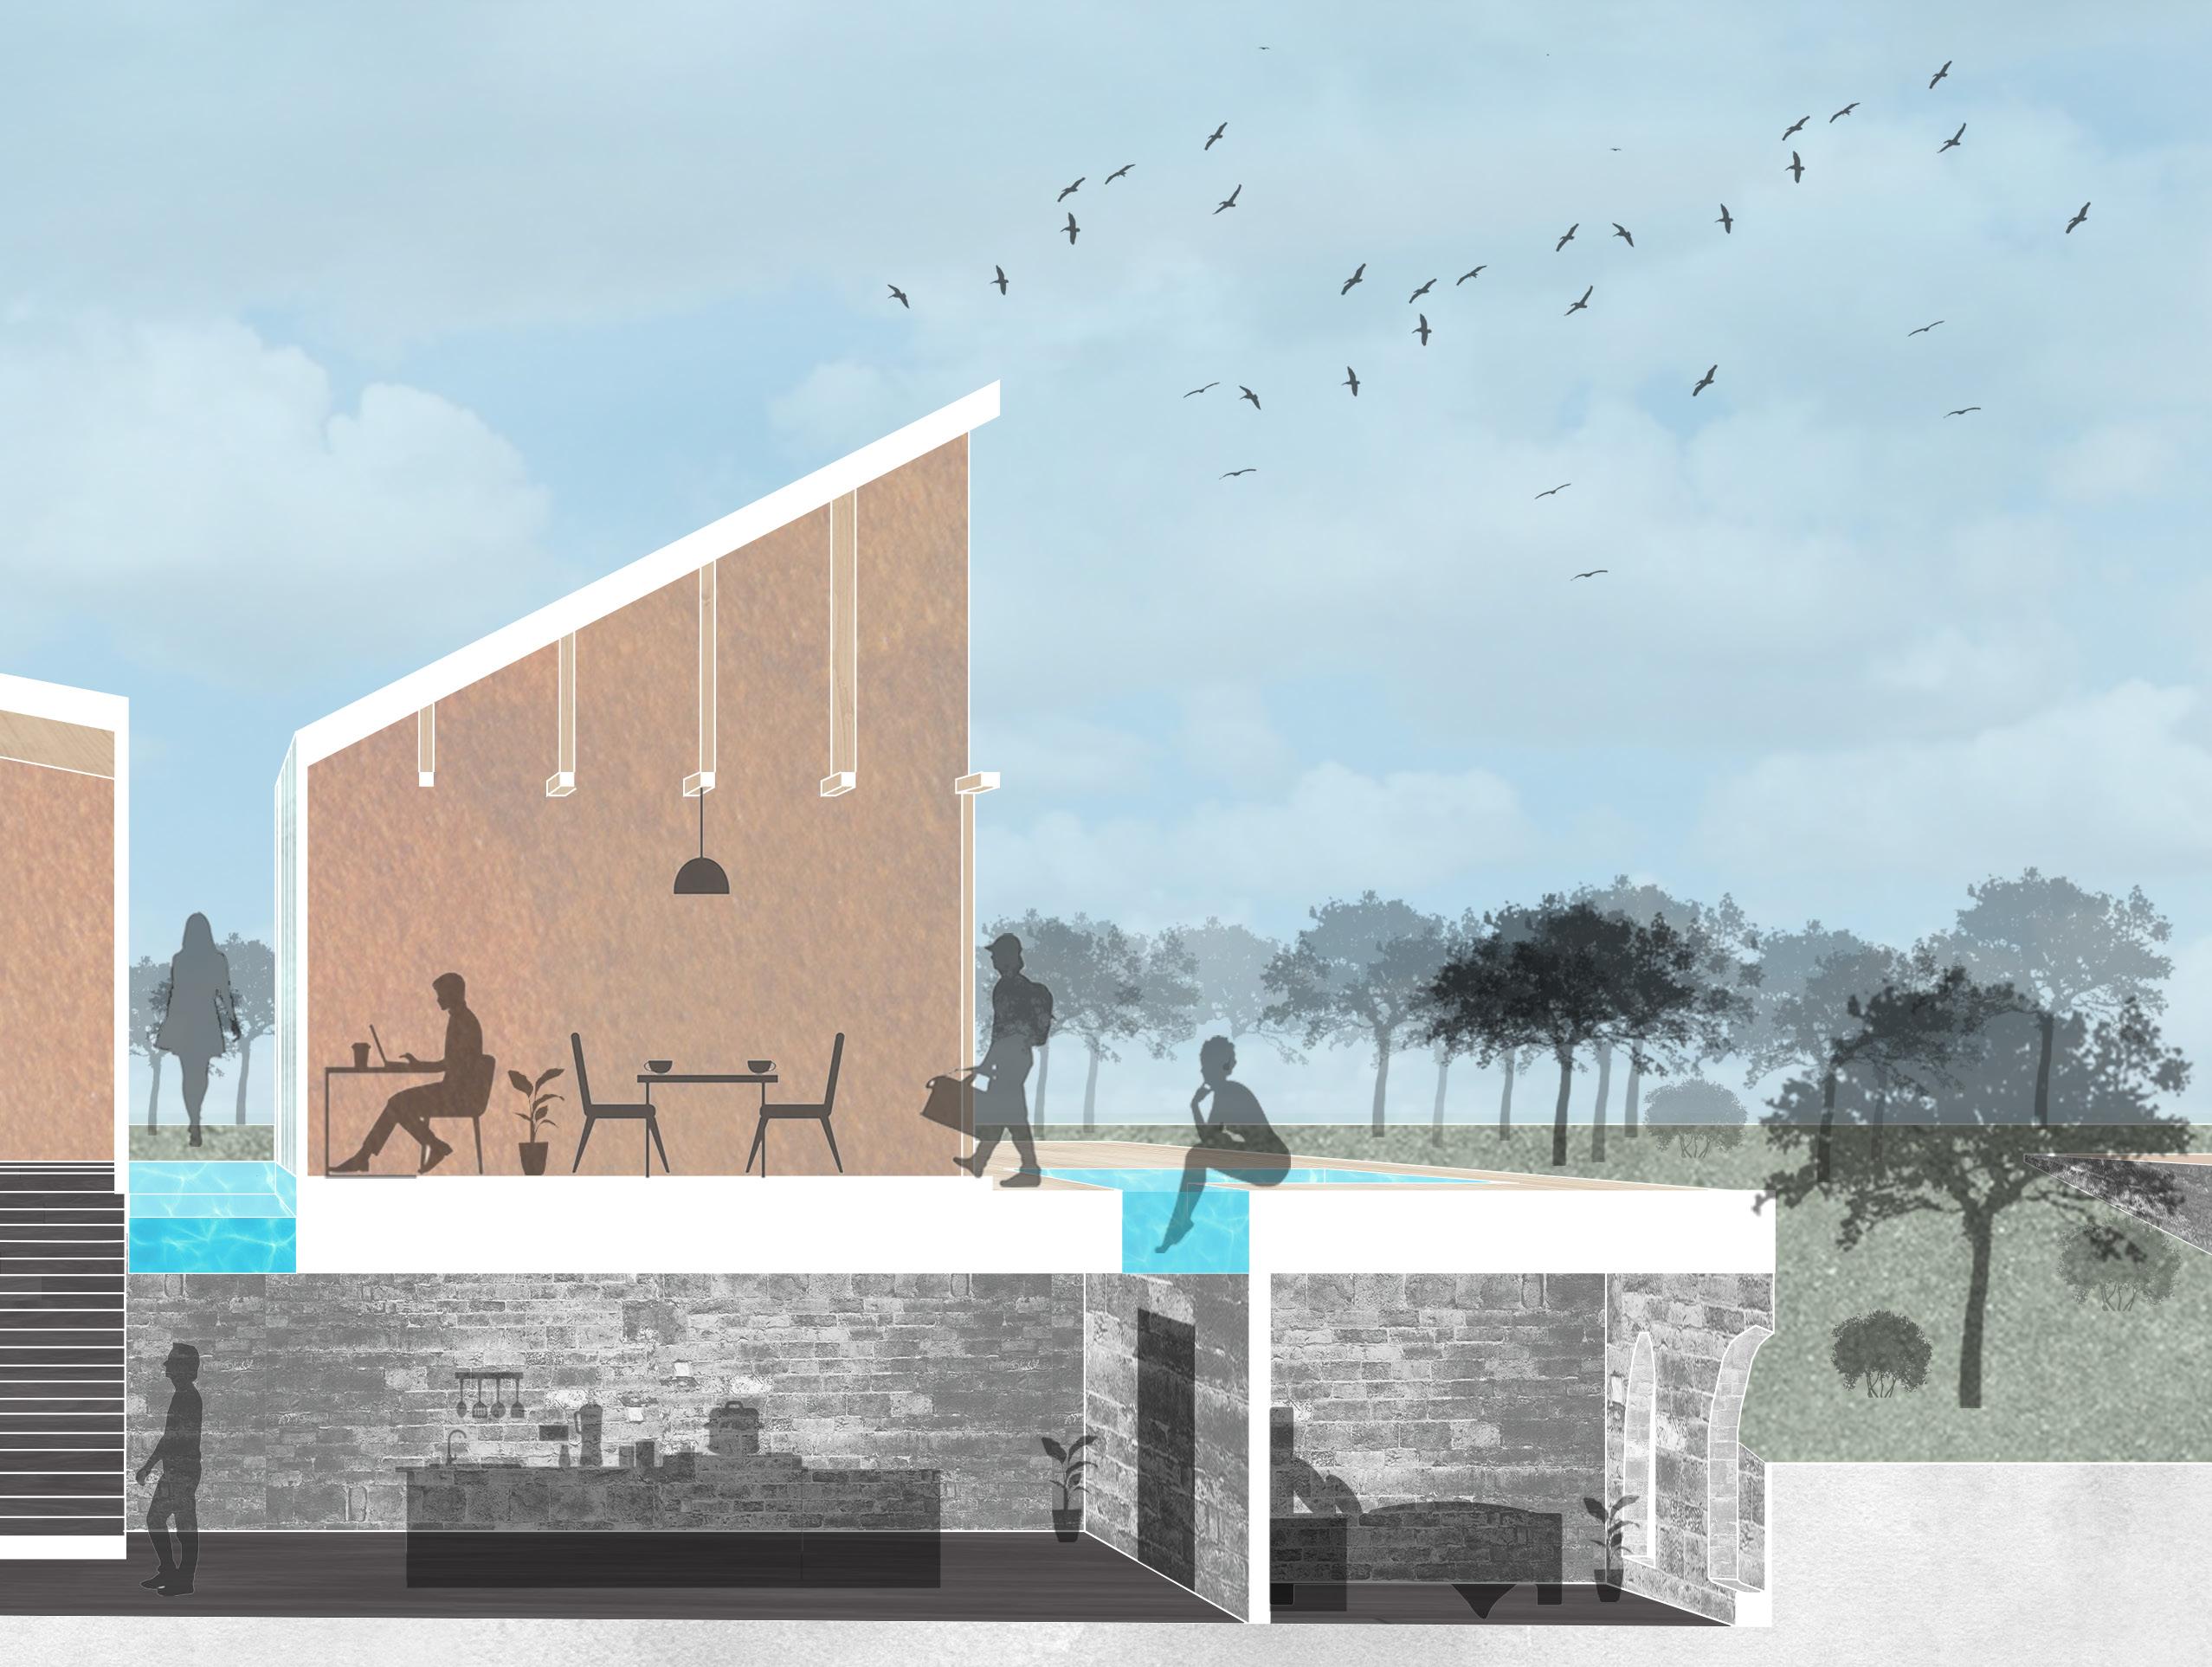
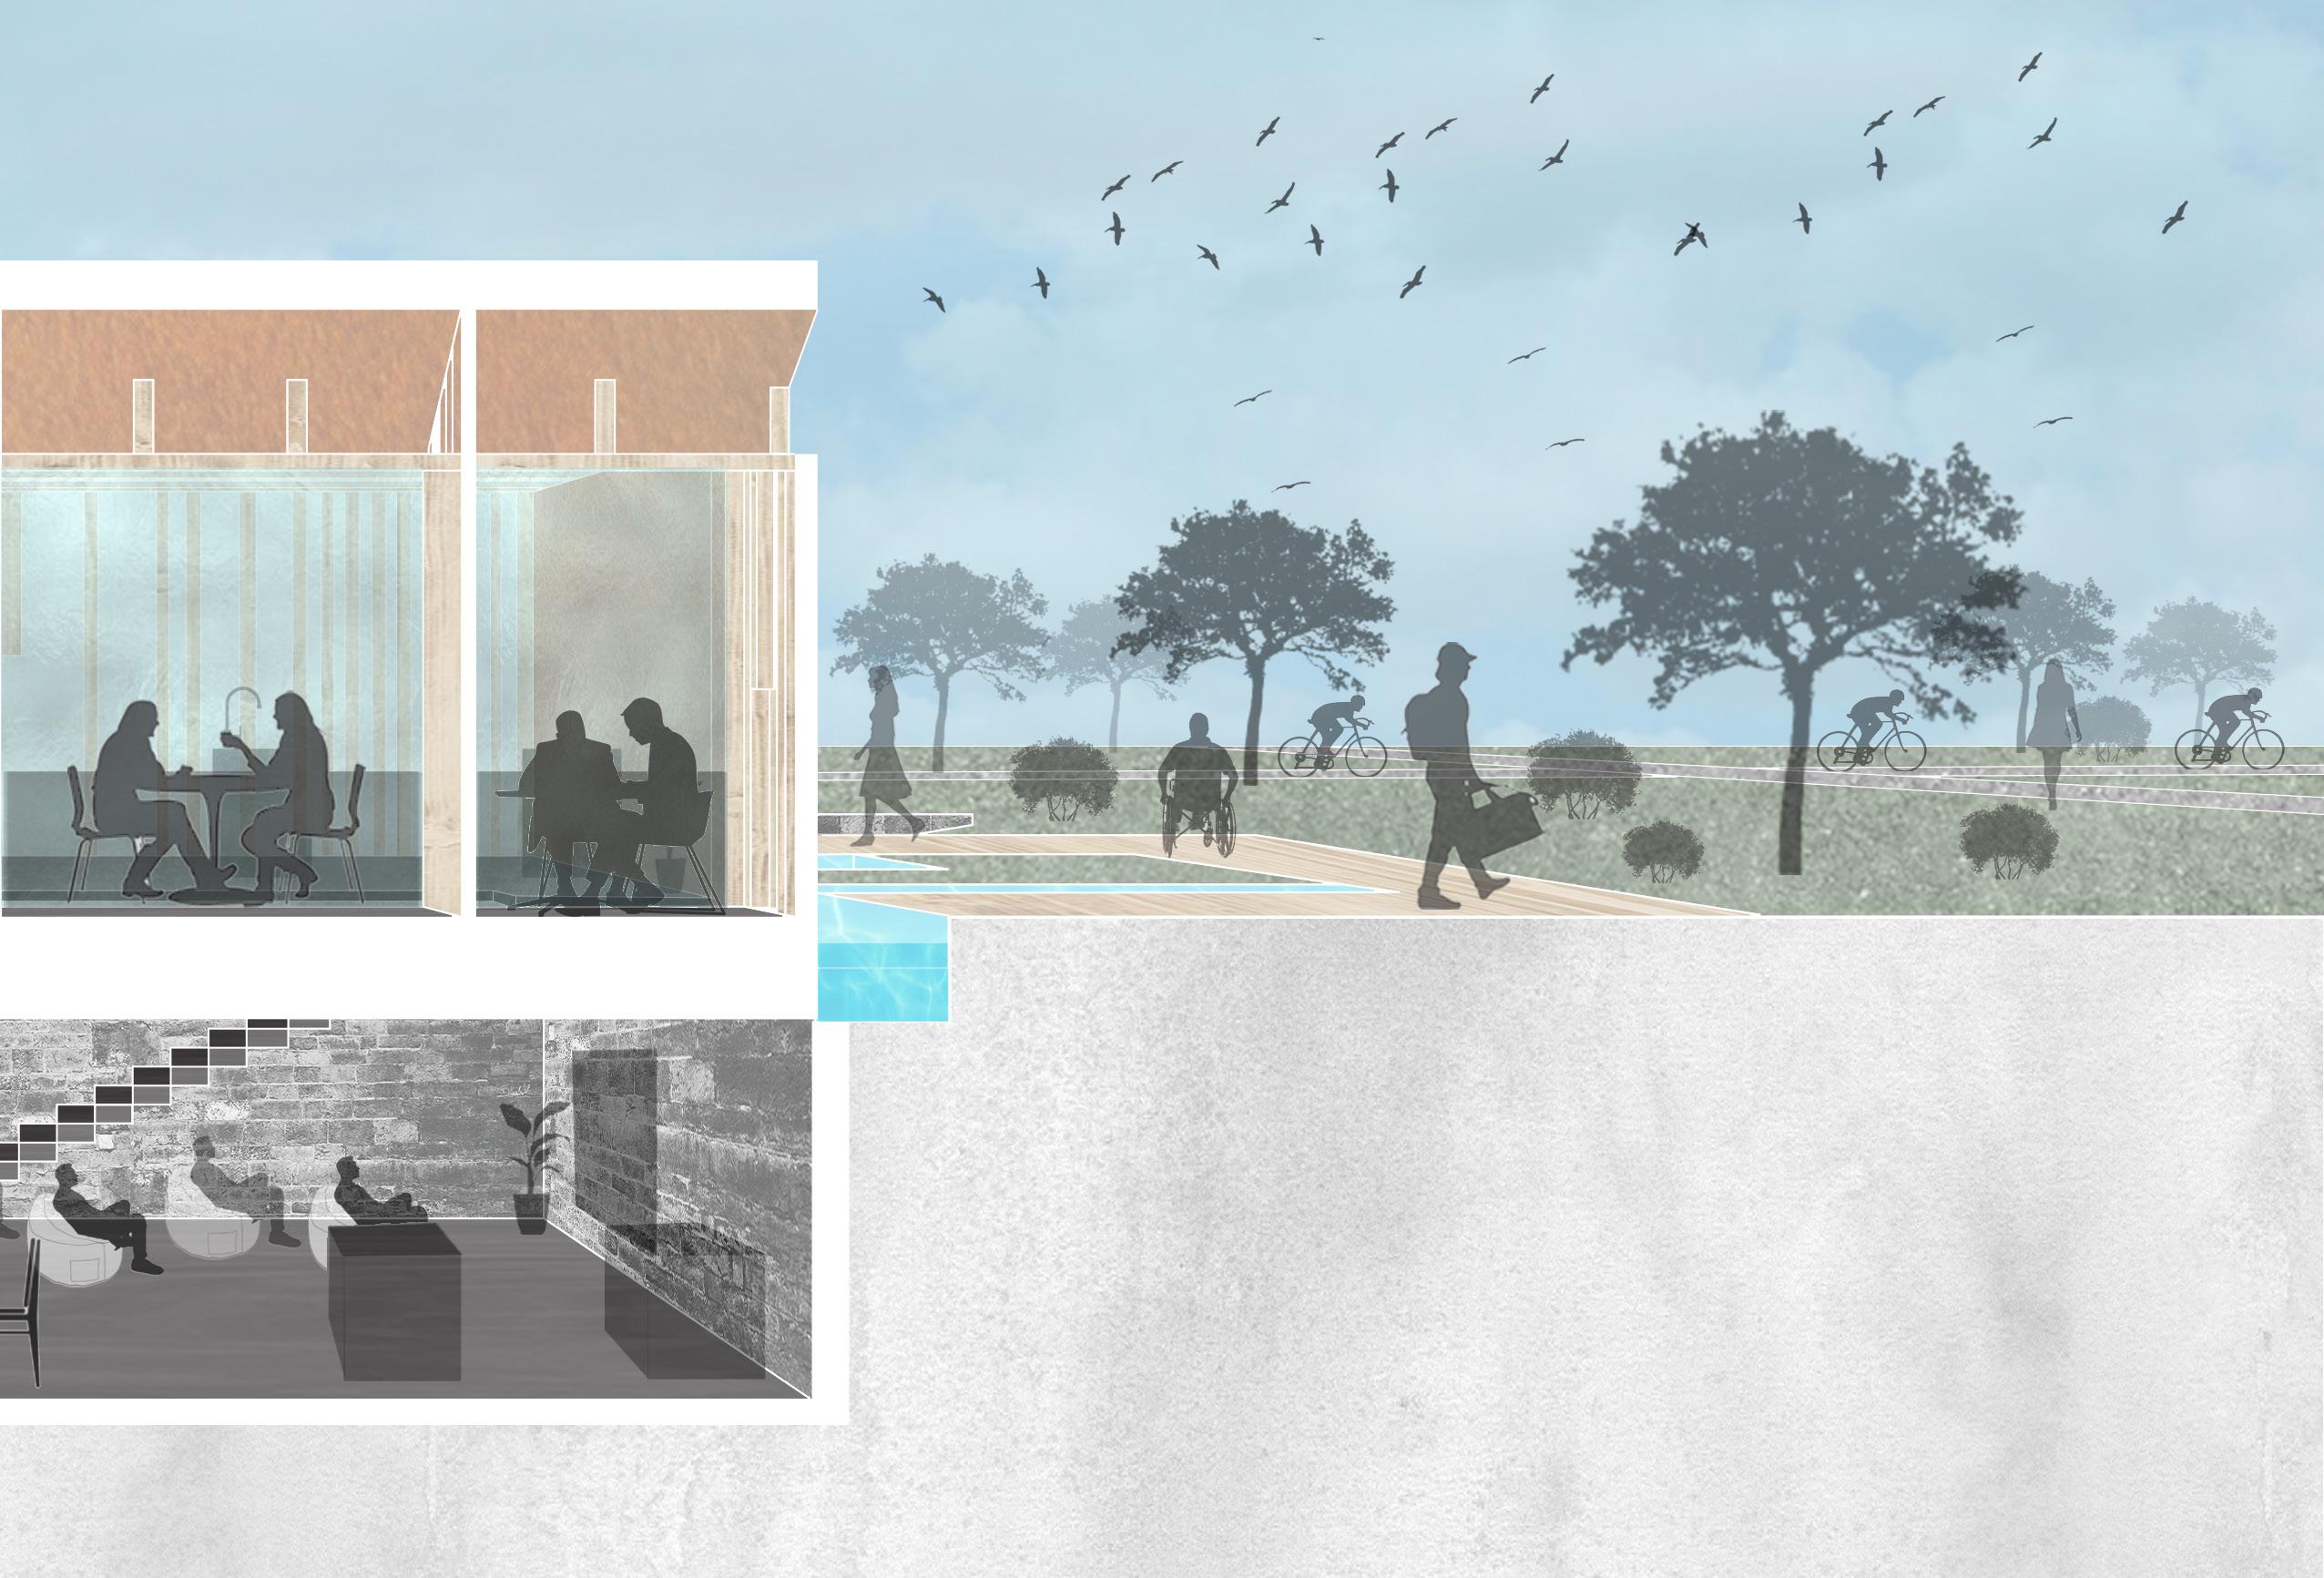
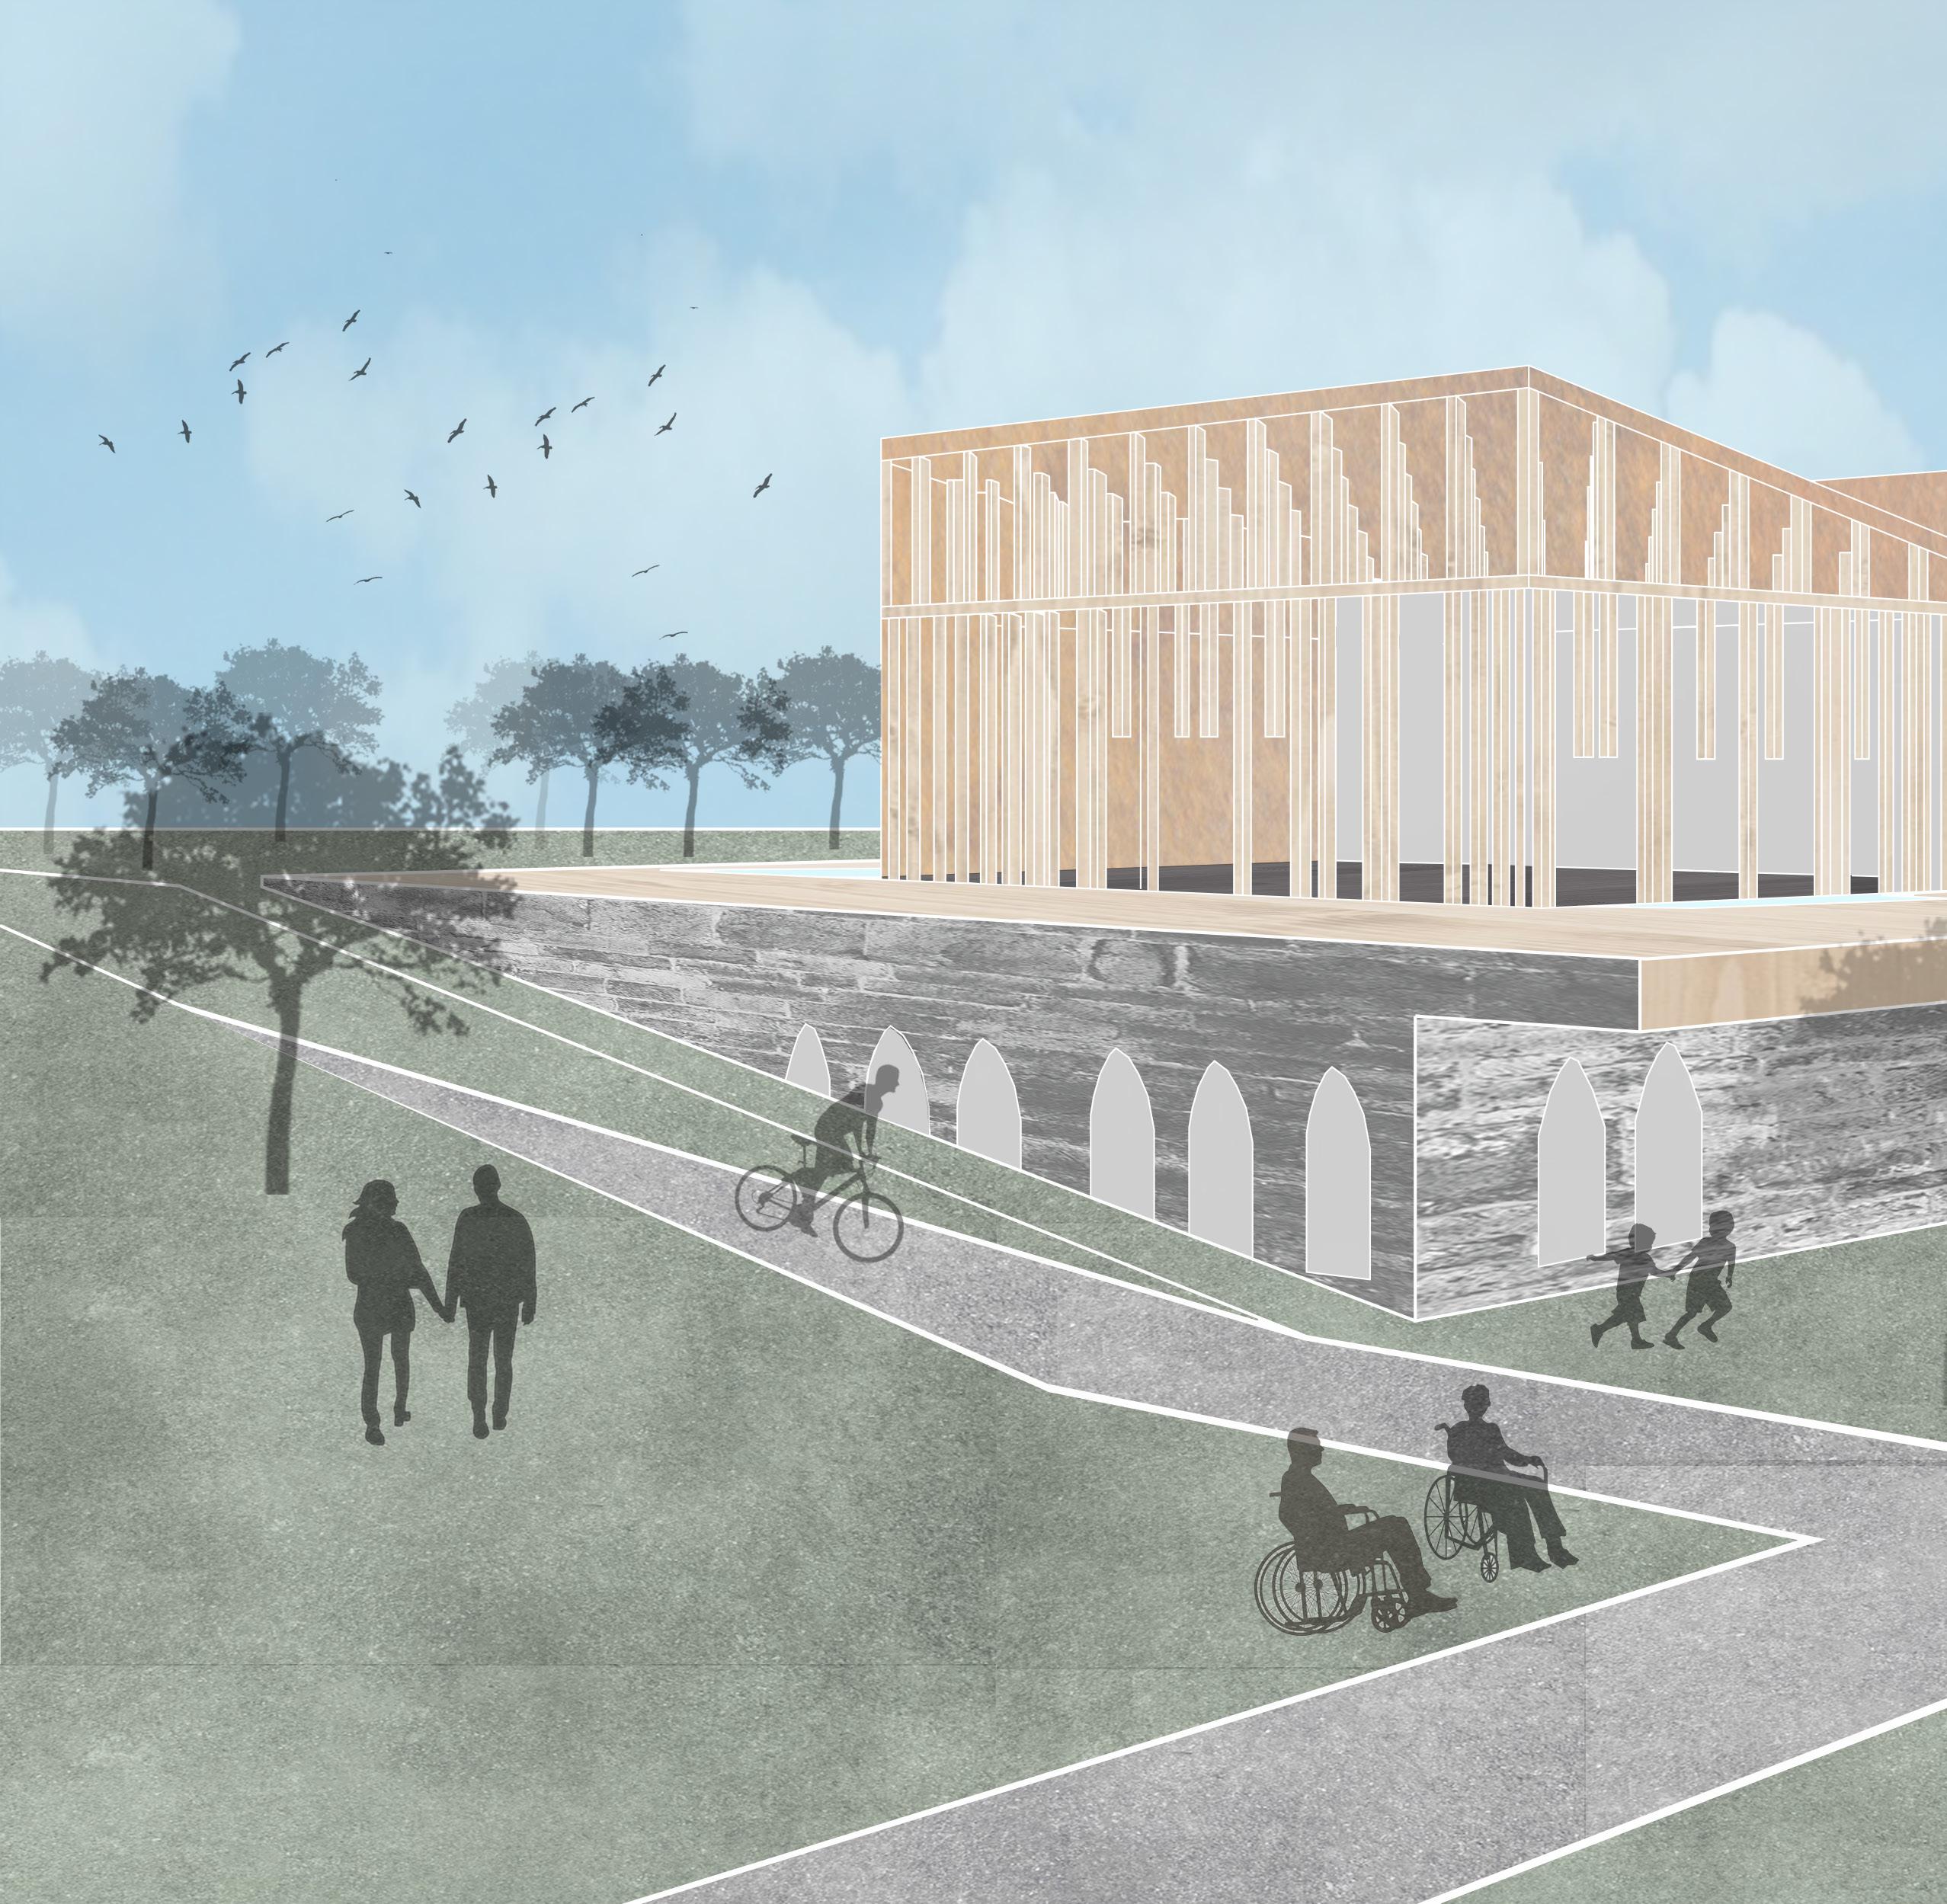
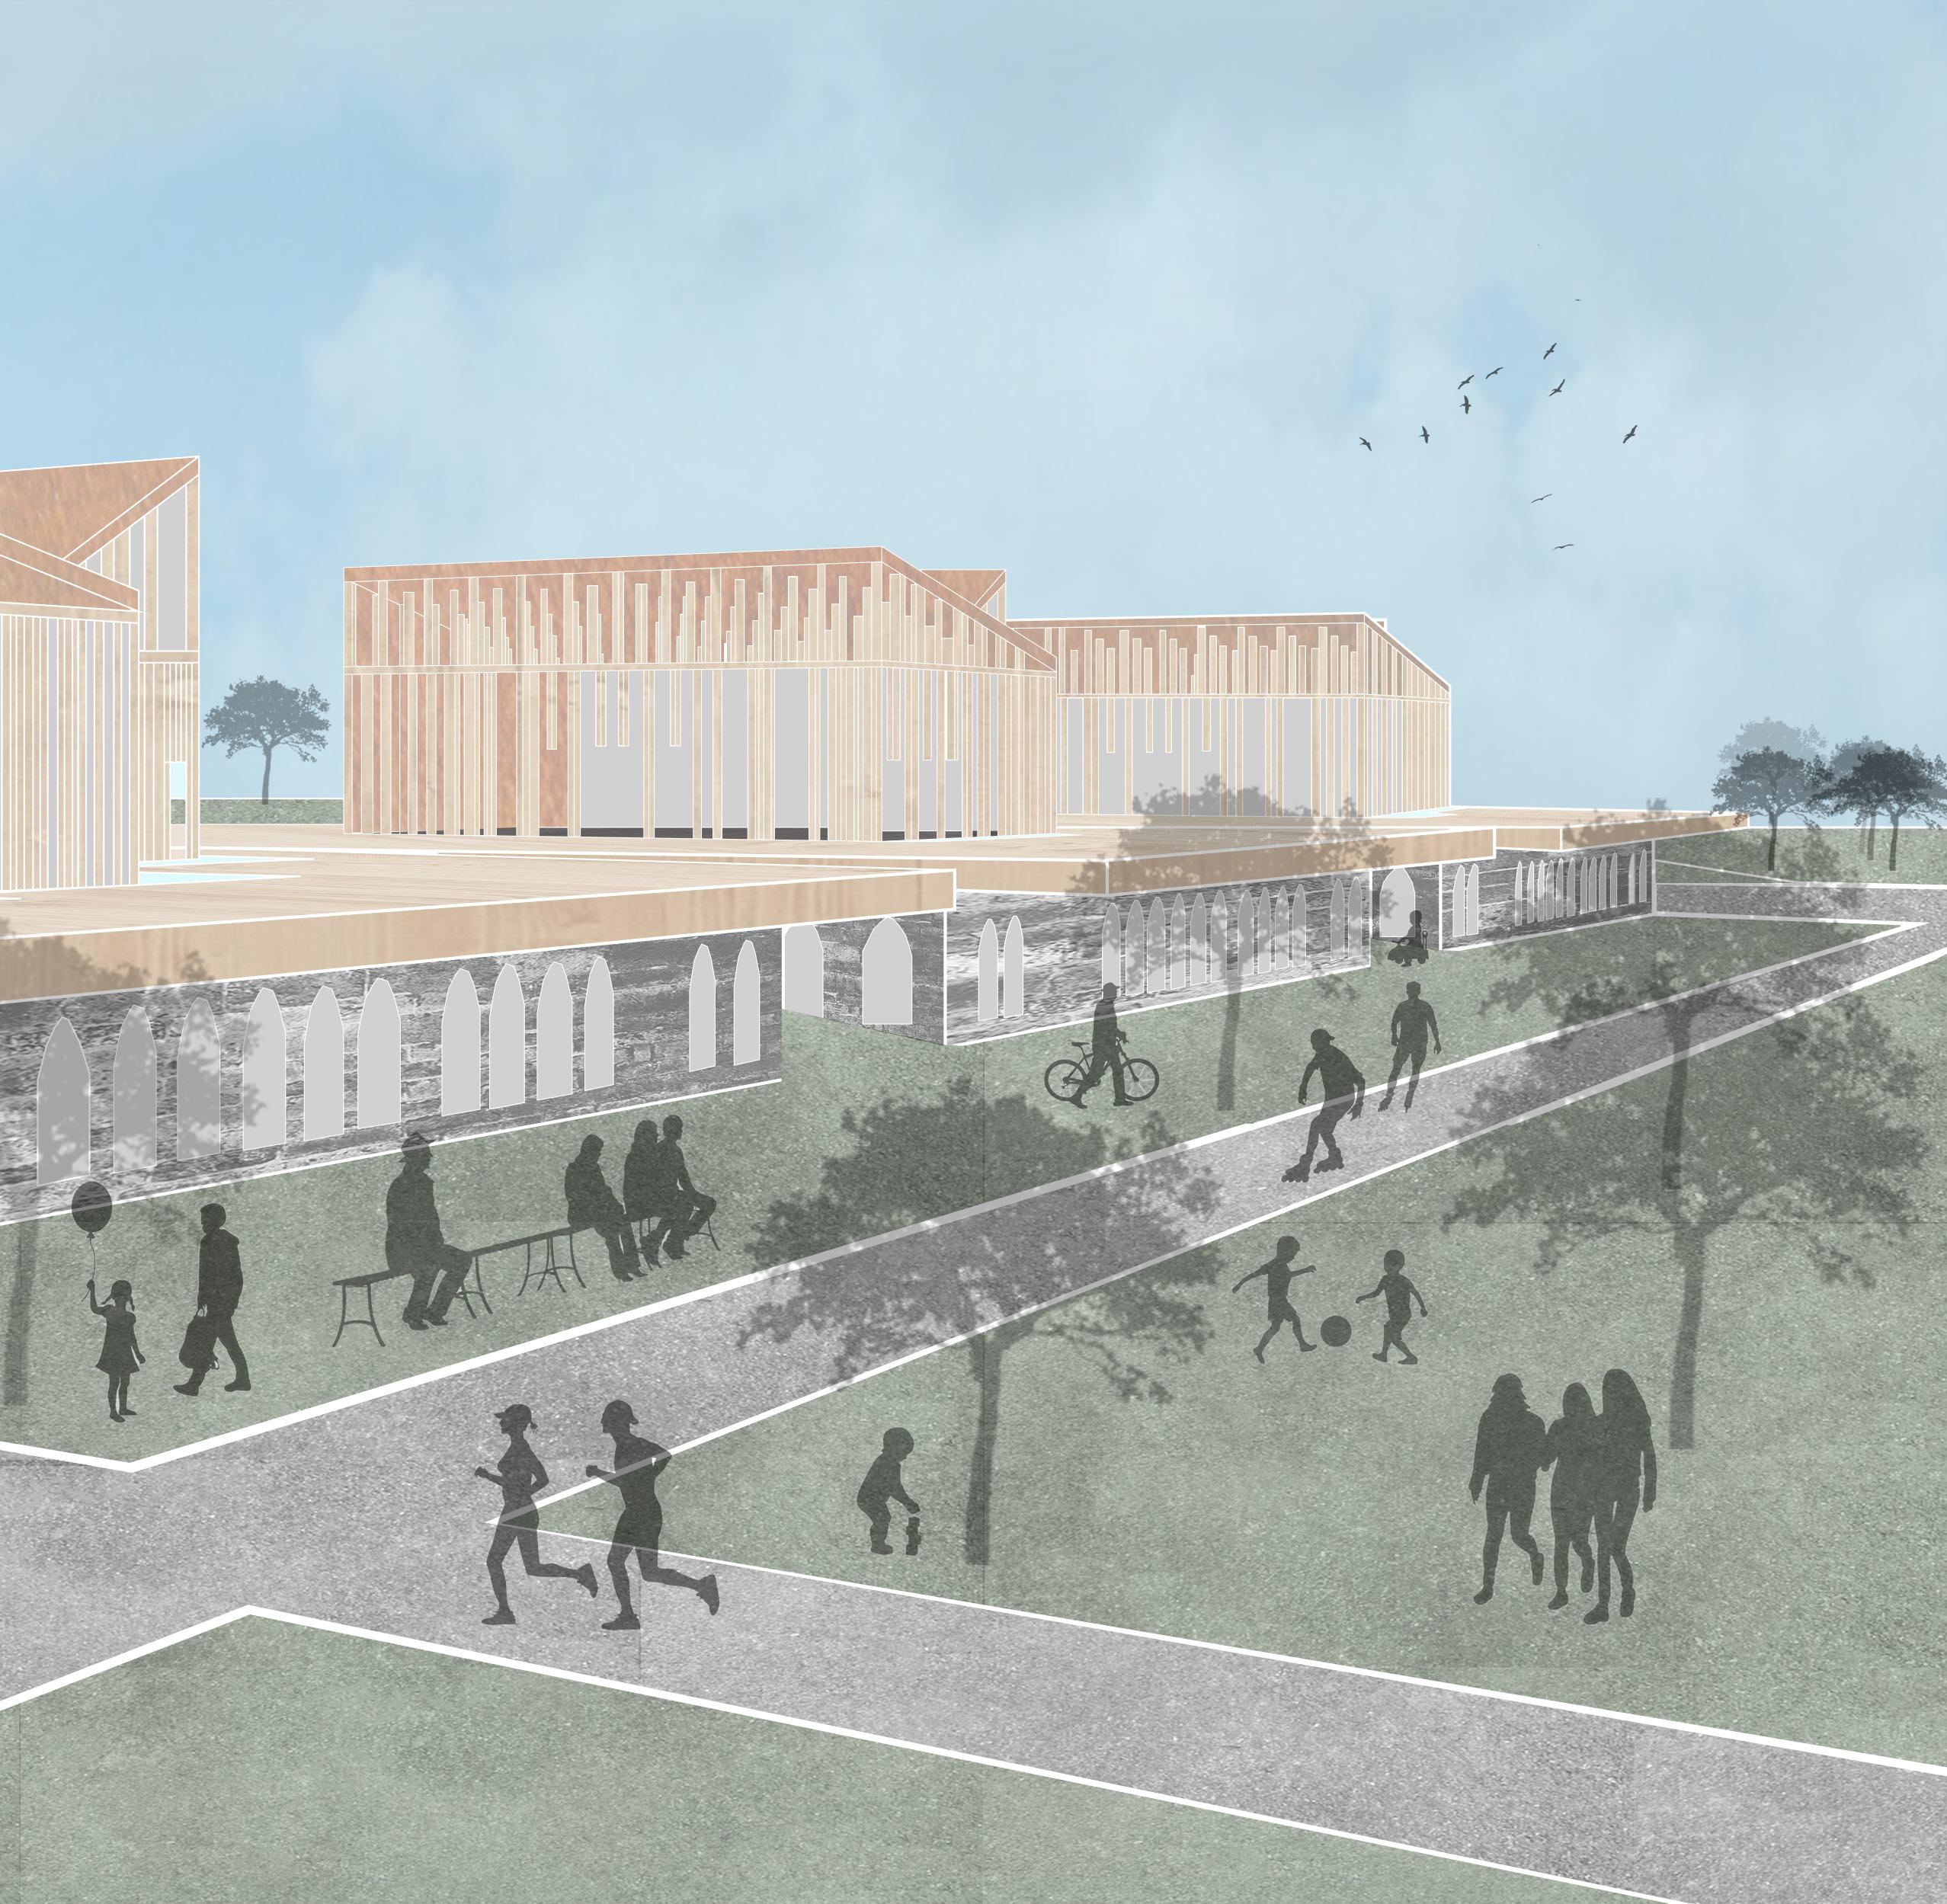
The street view showcases the different landscape activities and programs that the community indulges in. The elevation difference in the site has been addressed with gentle sloped walking and biking paths for ADA access. Cabin over Care can be accessed from either east or west direction.
Wellness Retreat
Studio Work
Wellness Retreat in the Landscape
Sweetwater Creek State Park, Manchester Mill Ruins
Individual Project
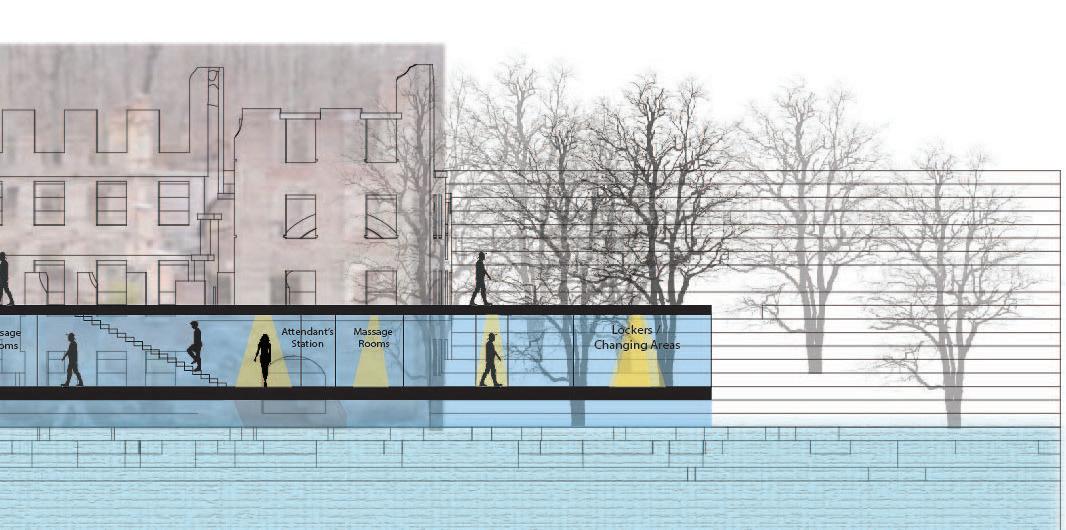
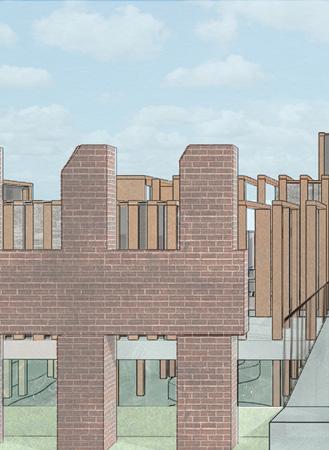
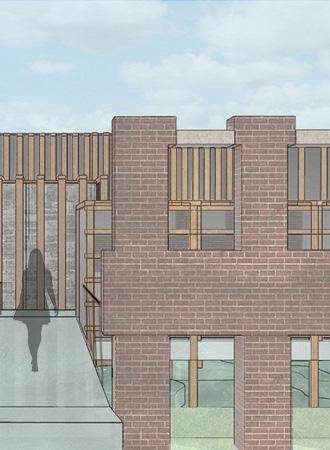
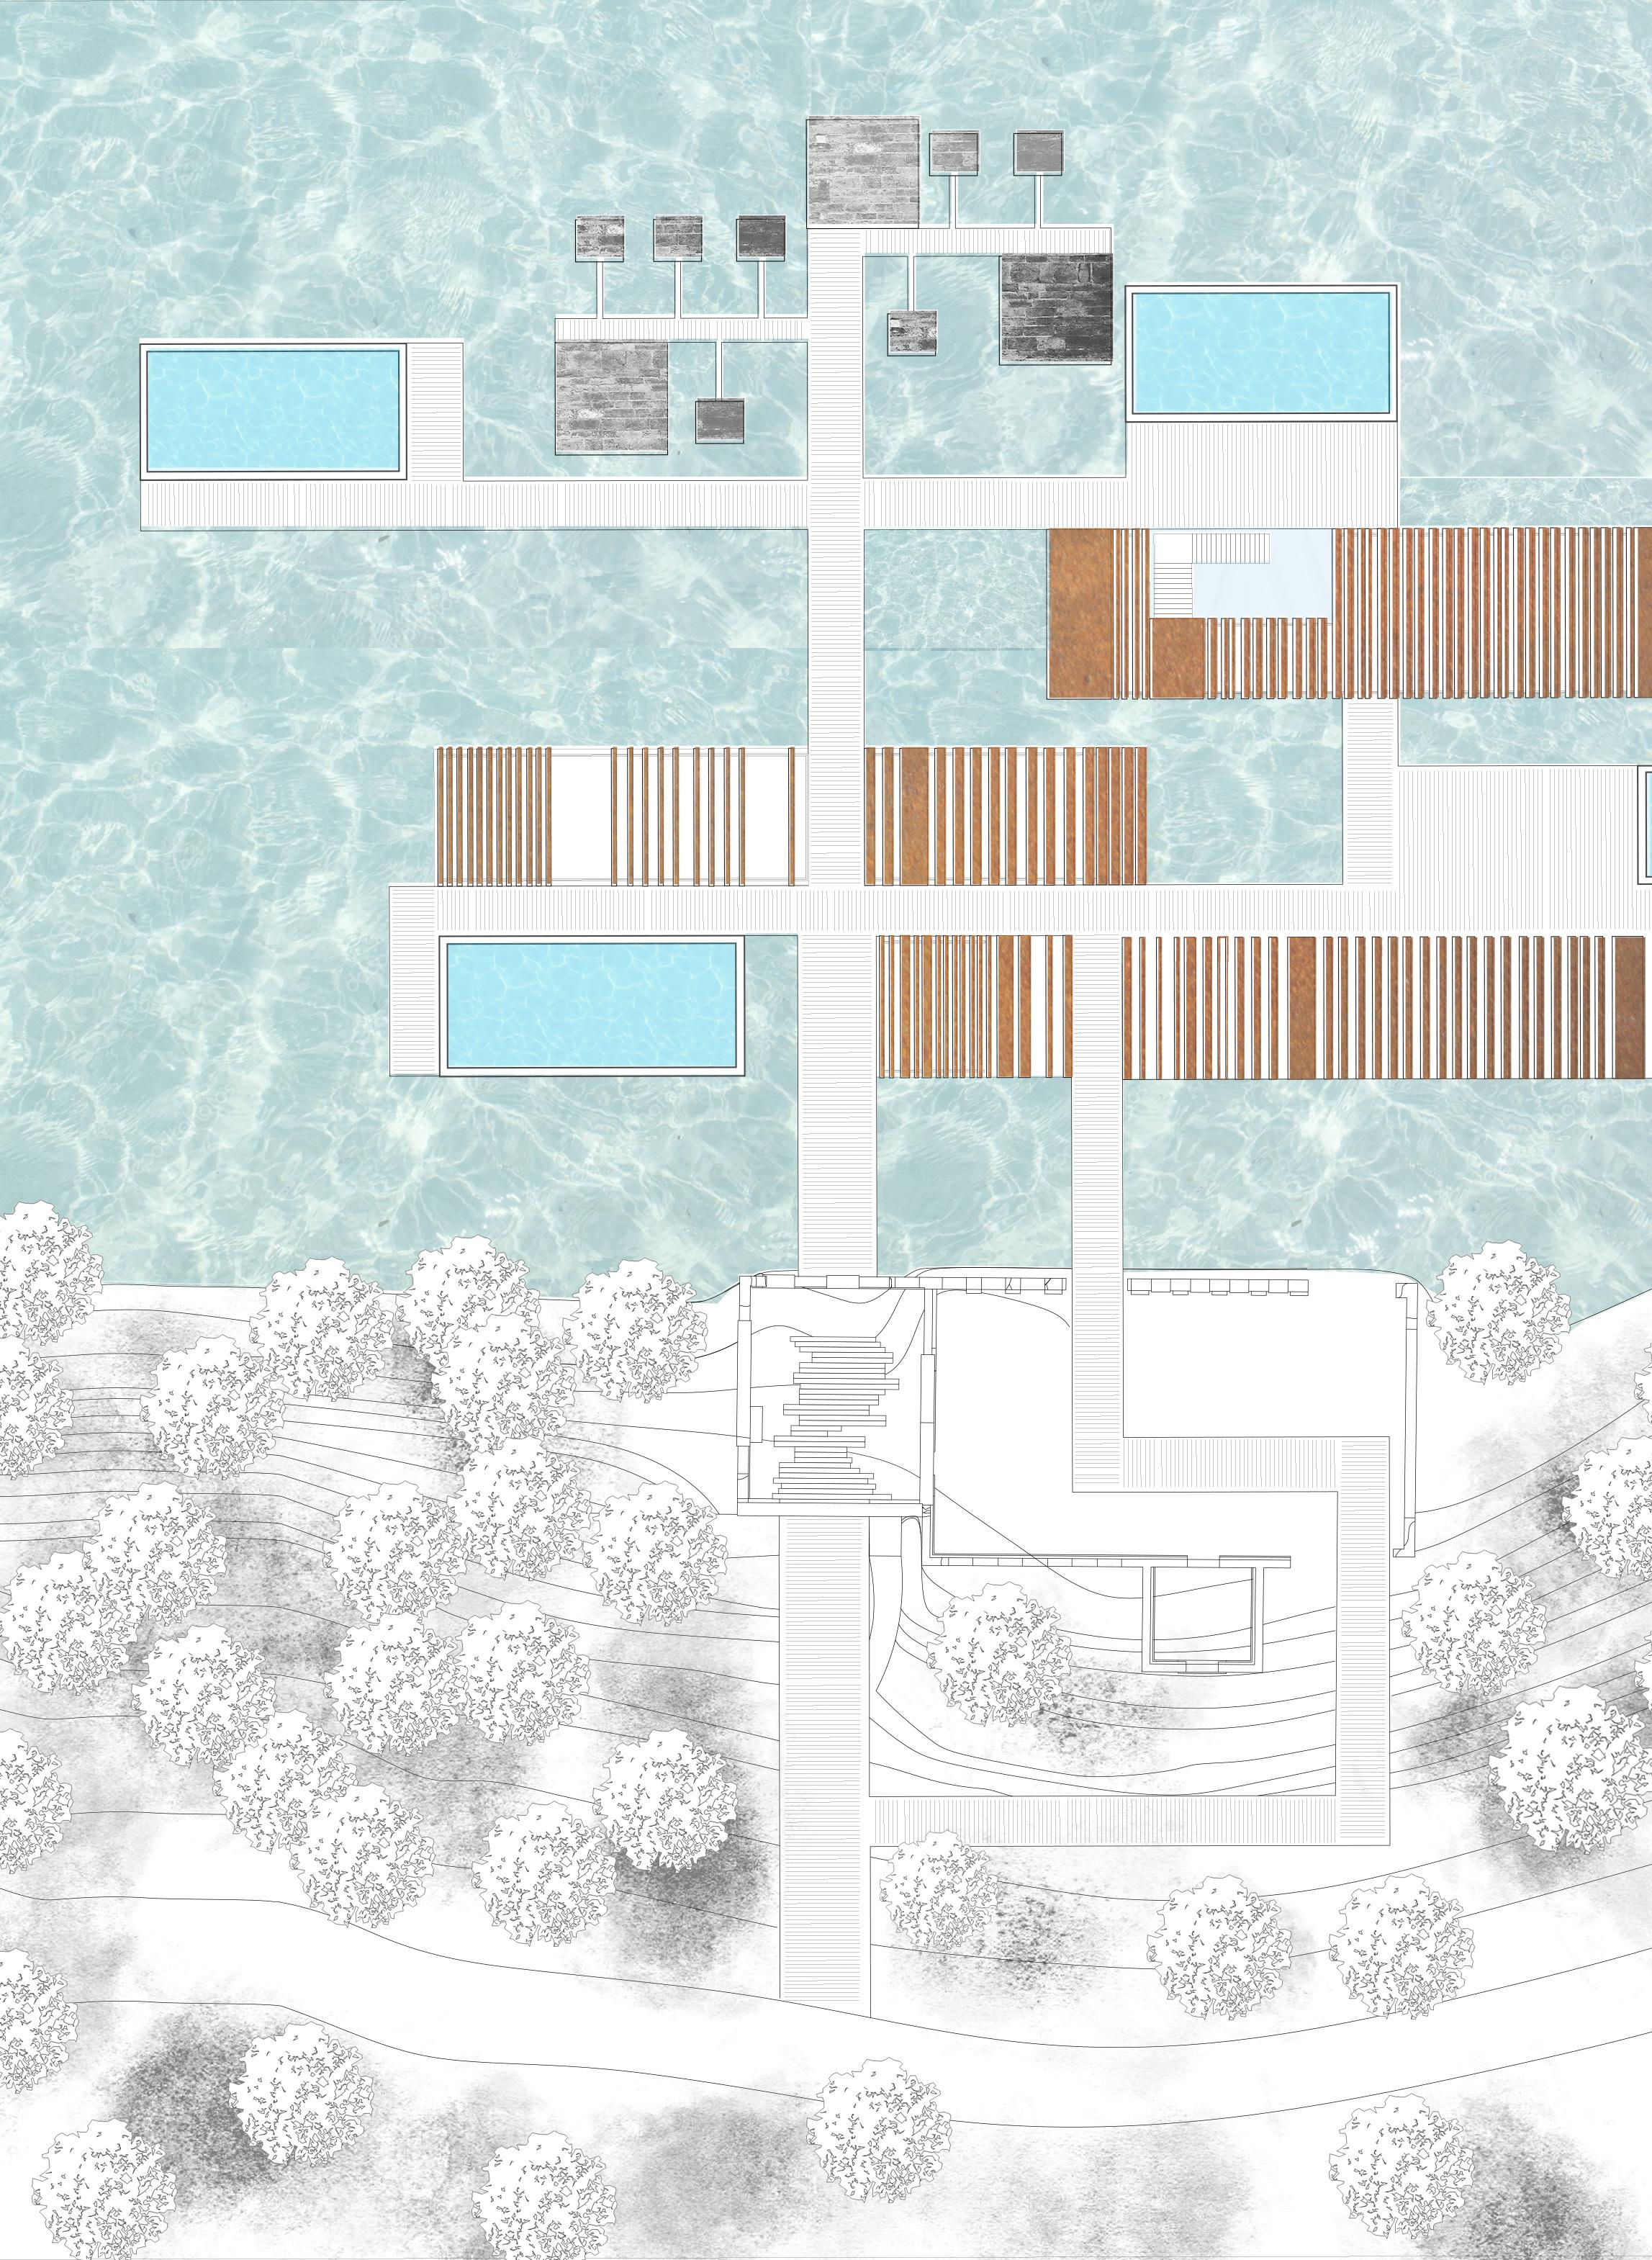
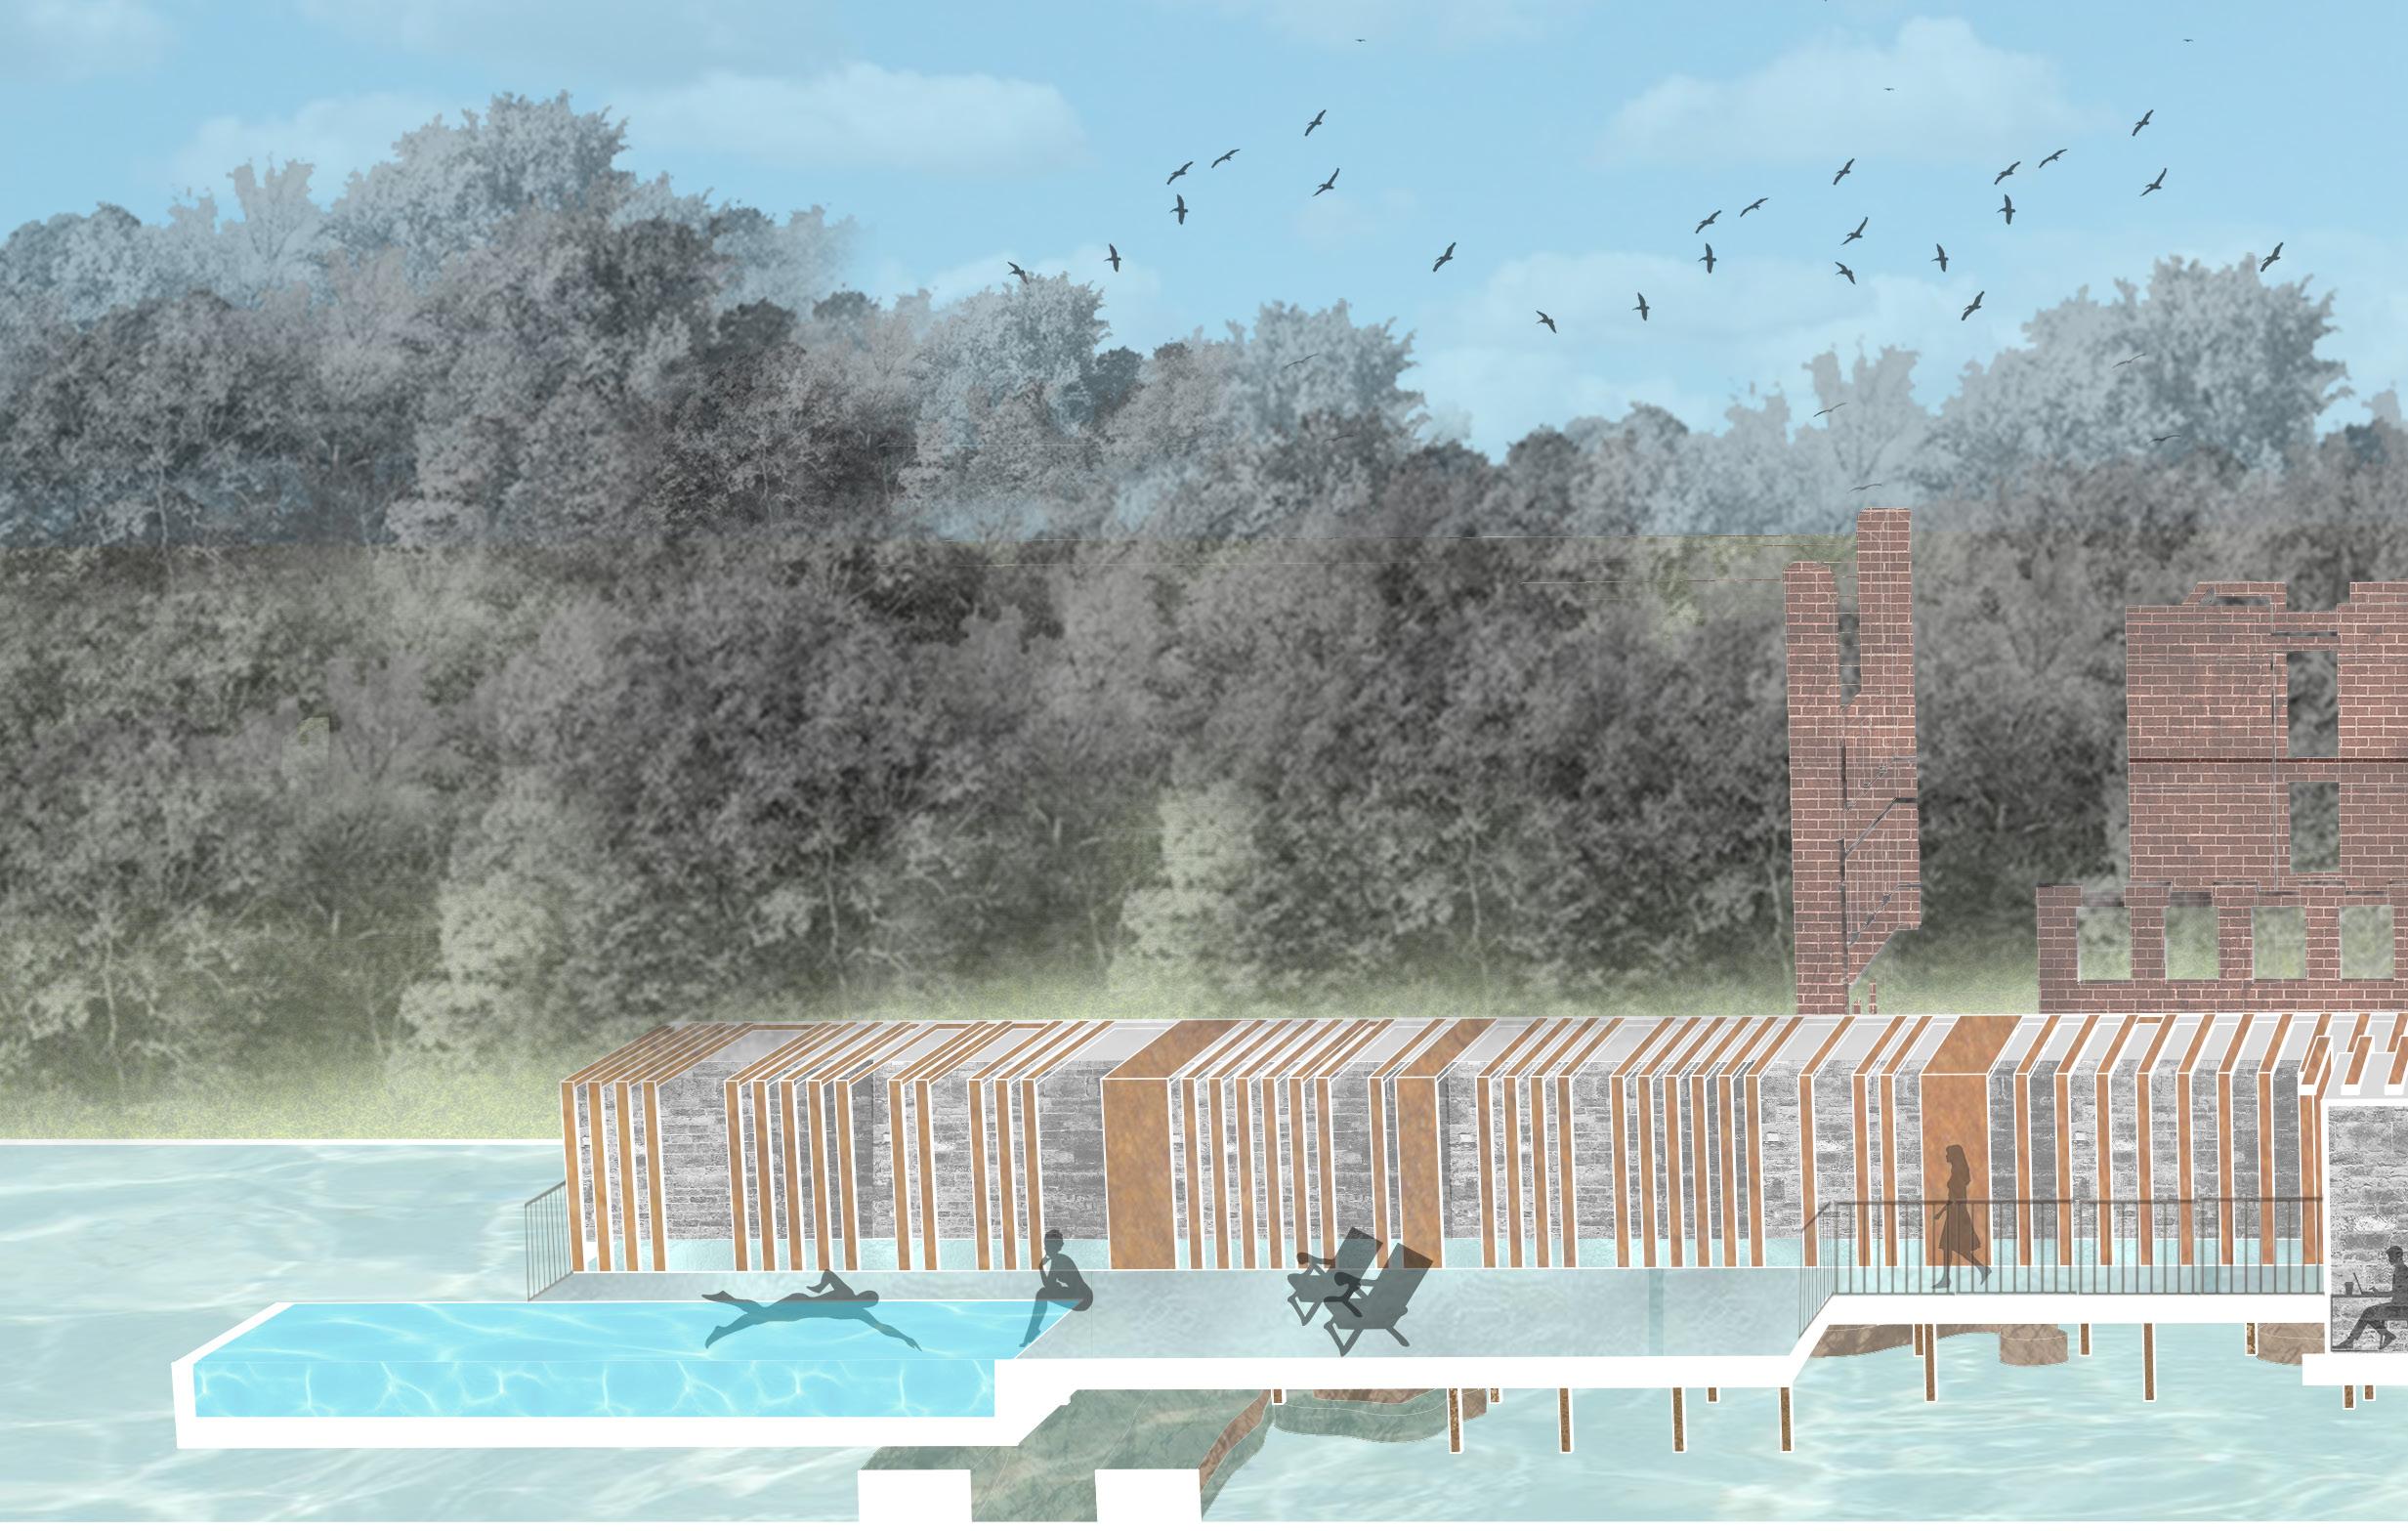
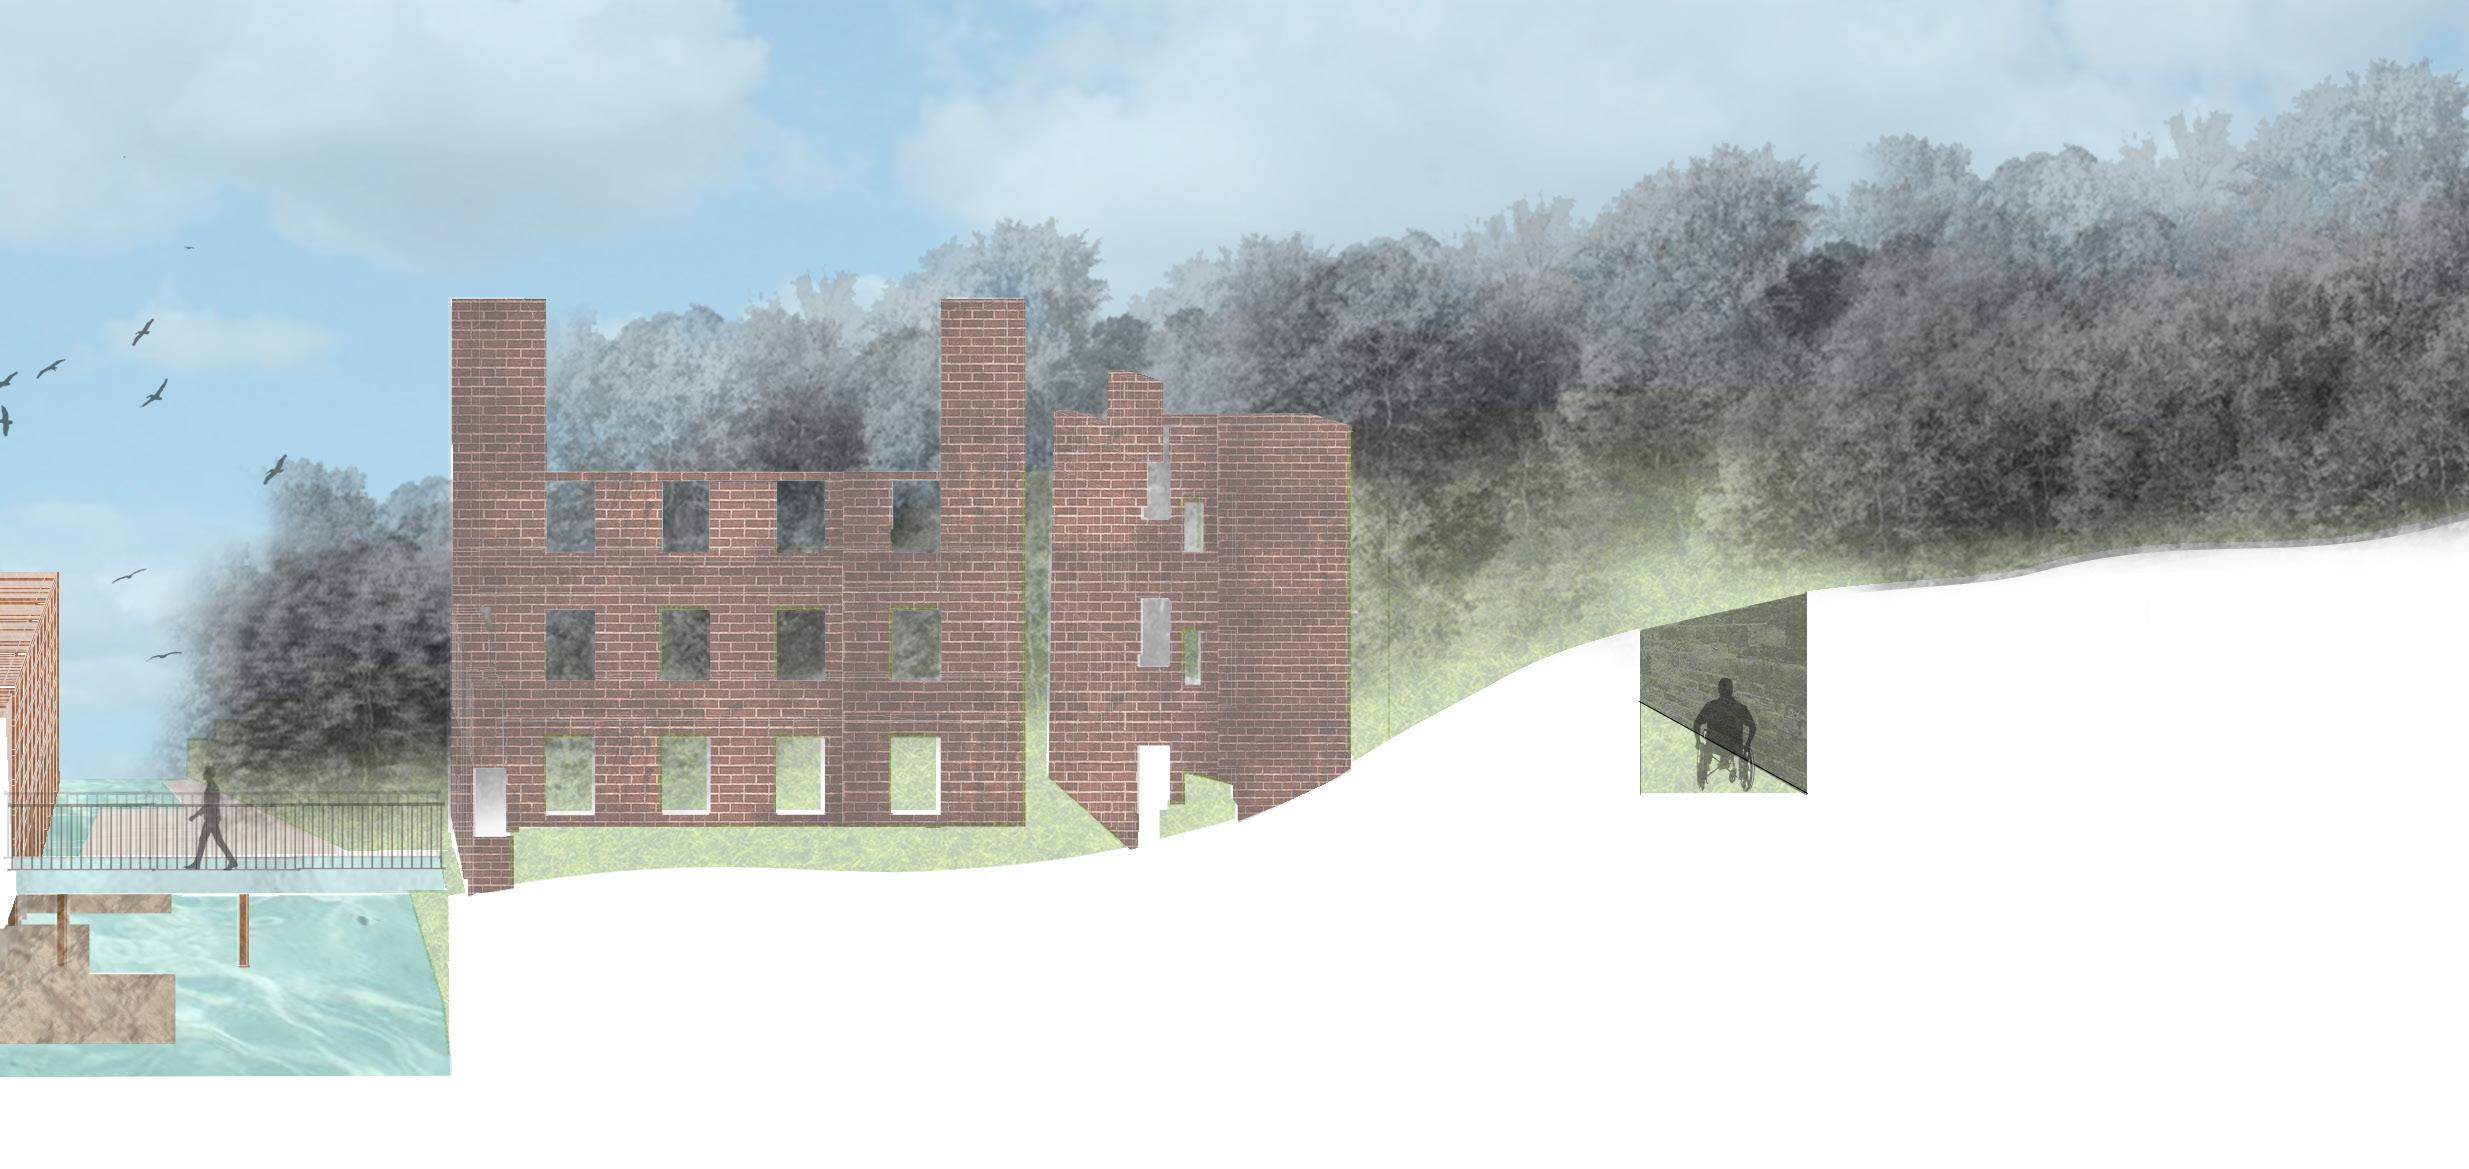
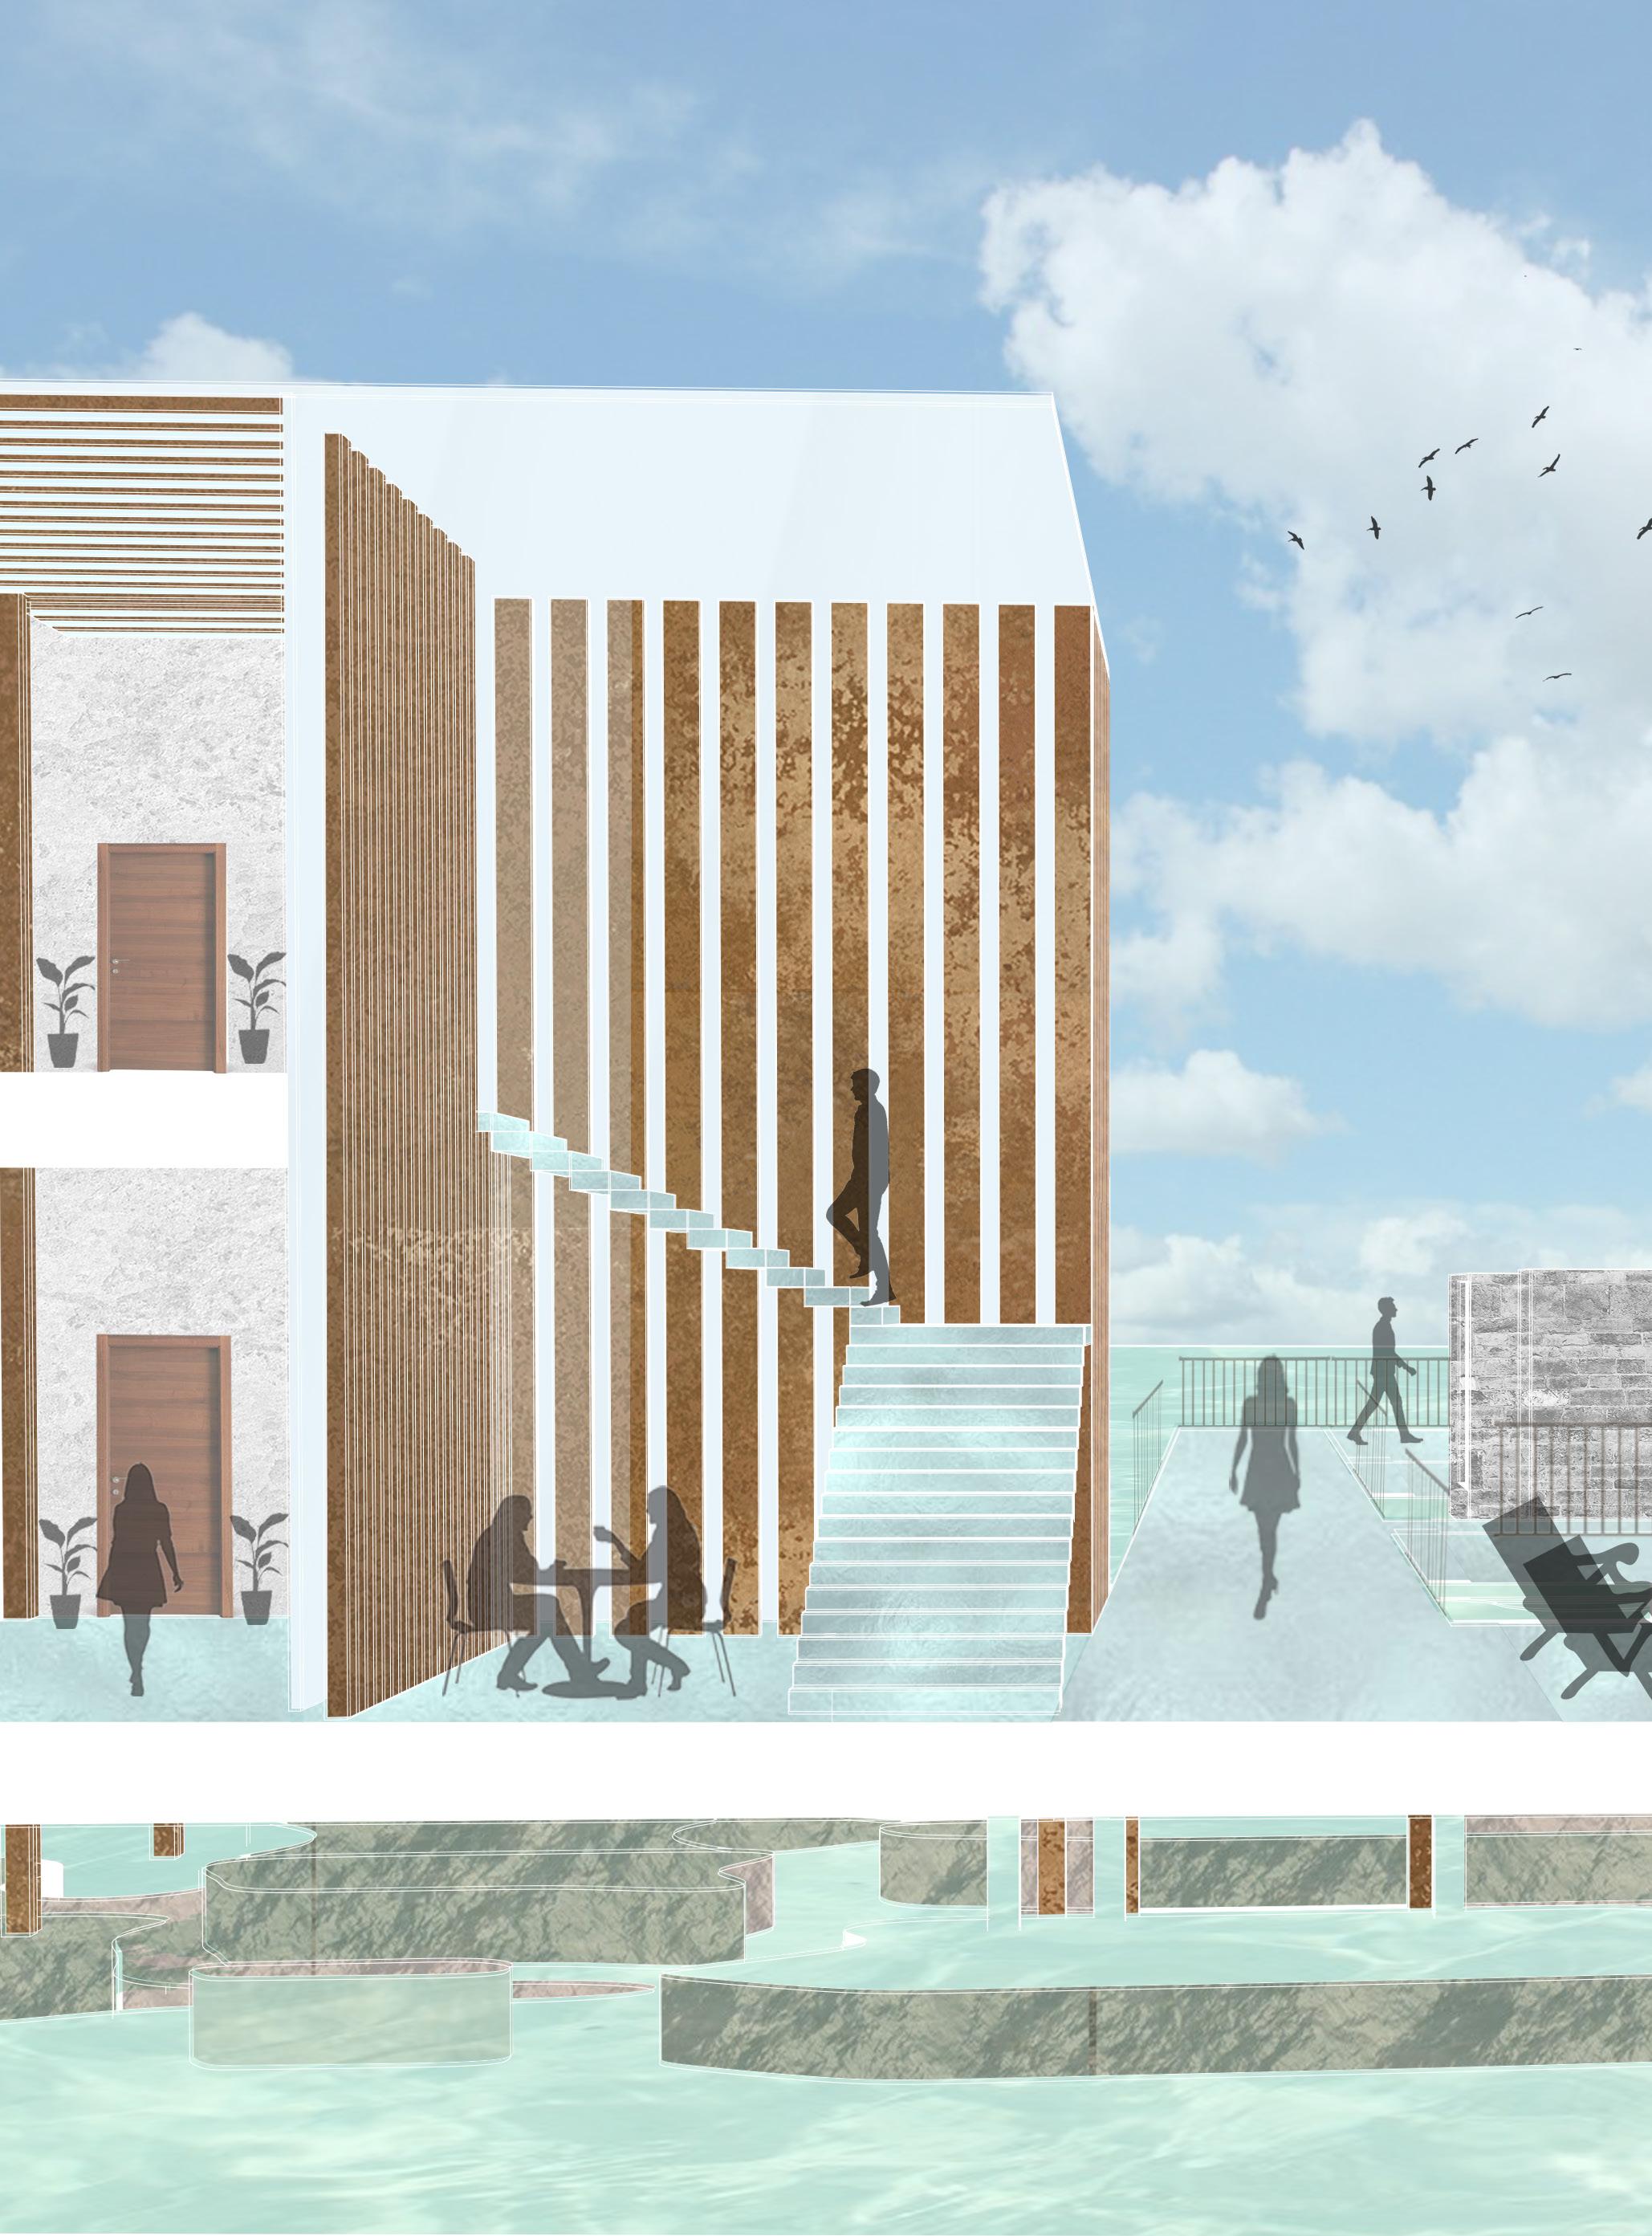
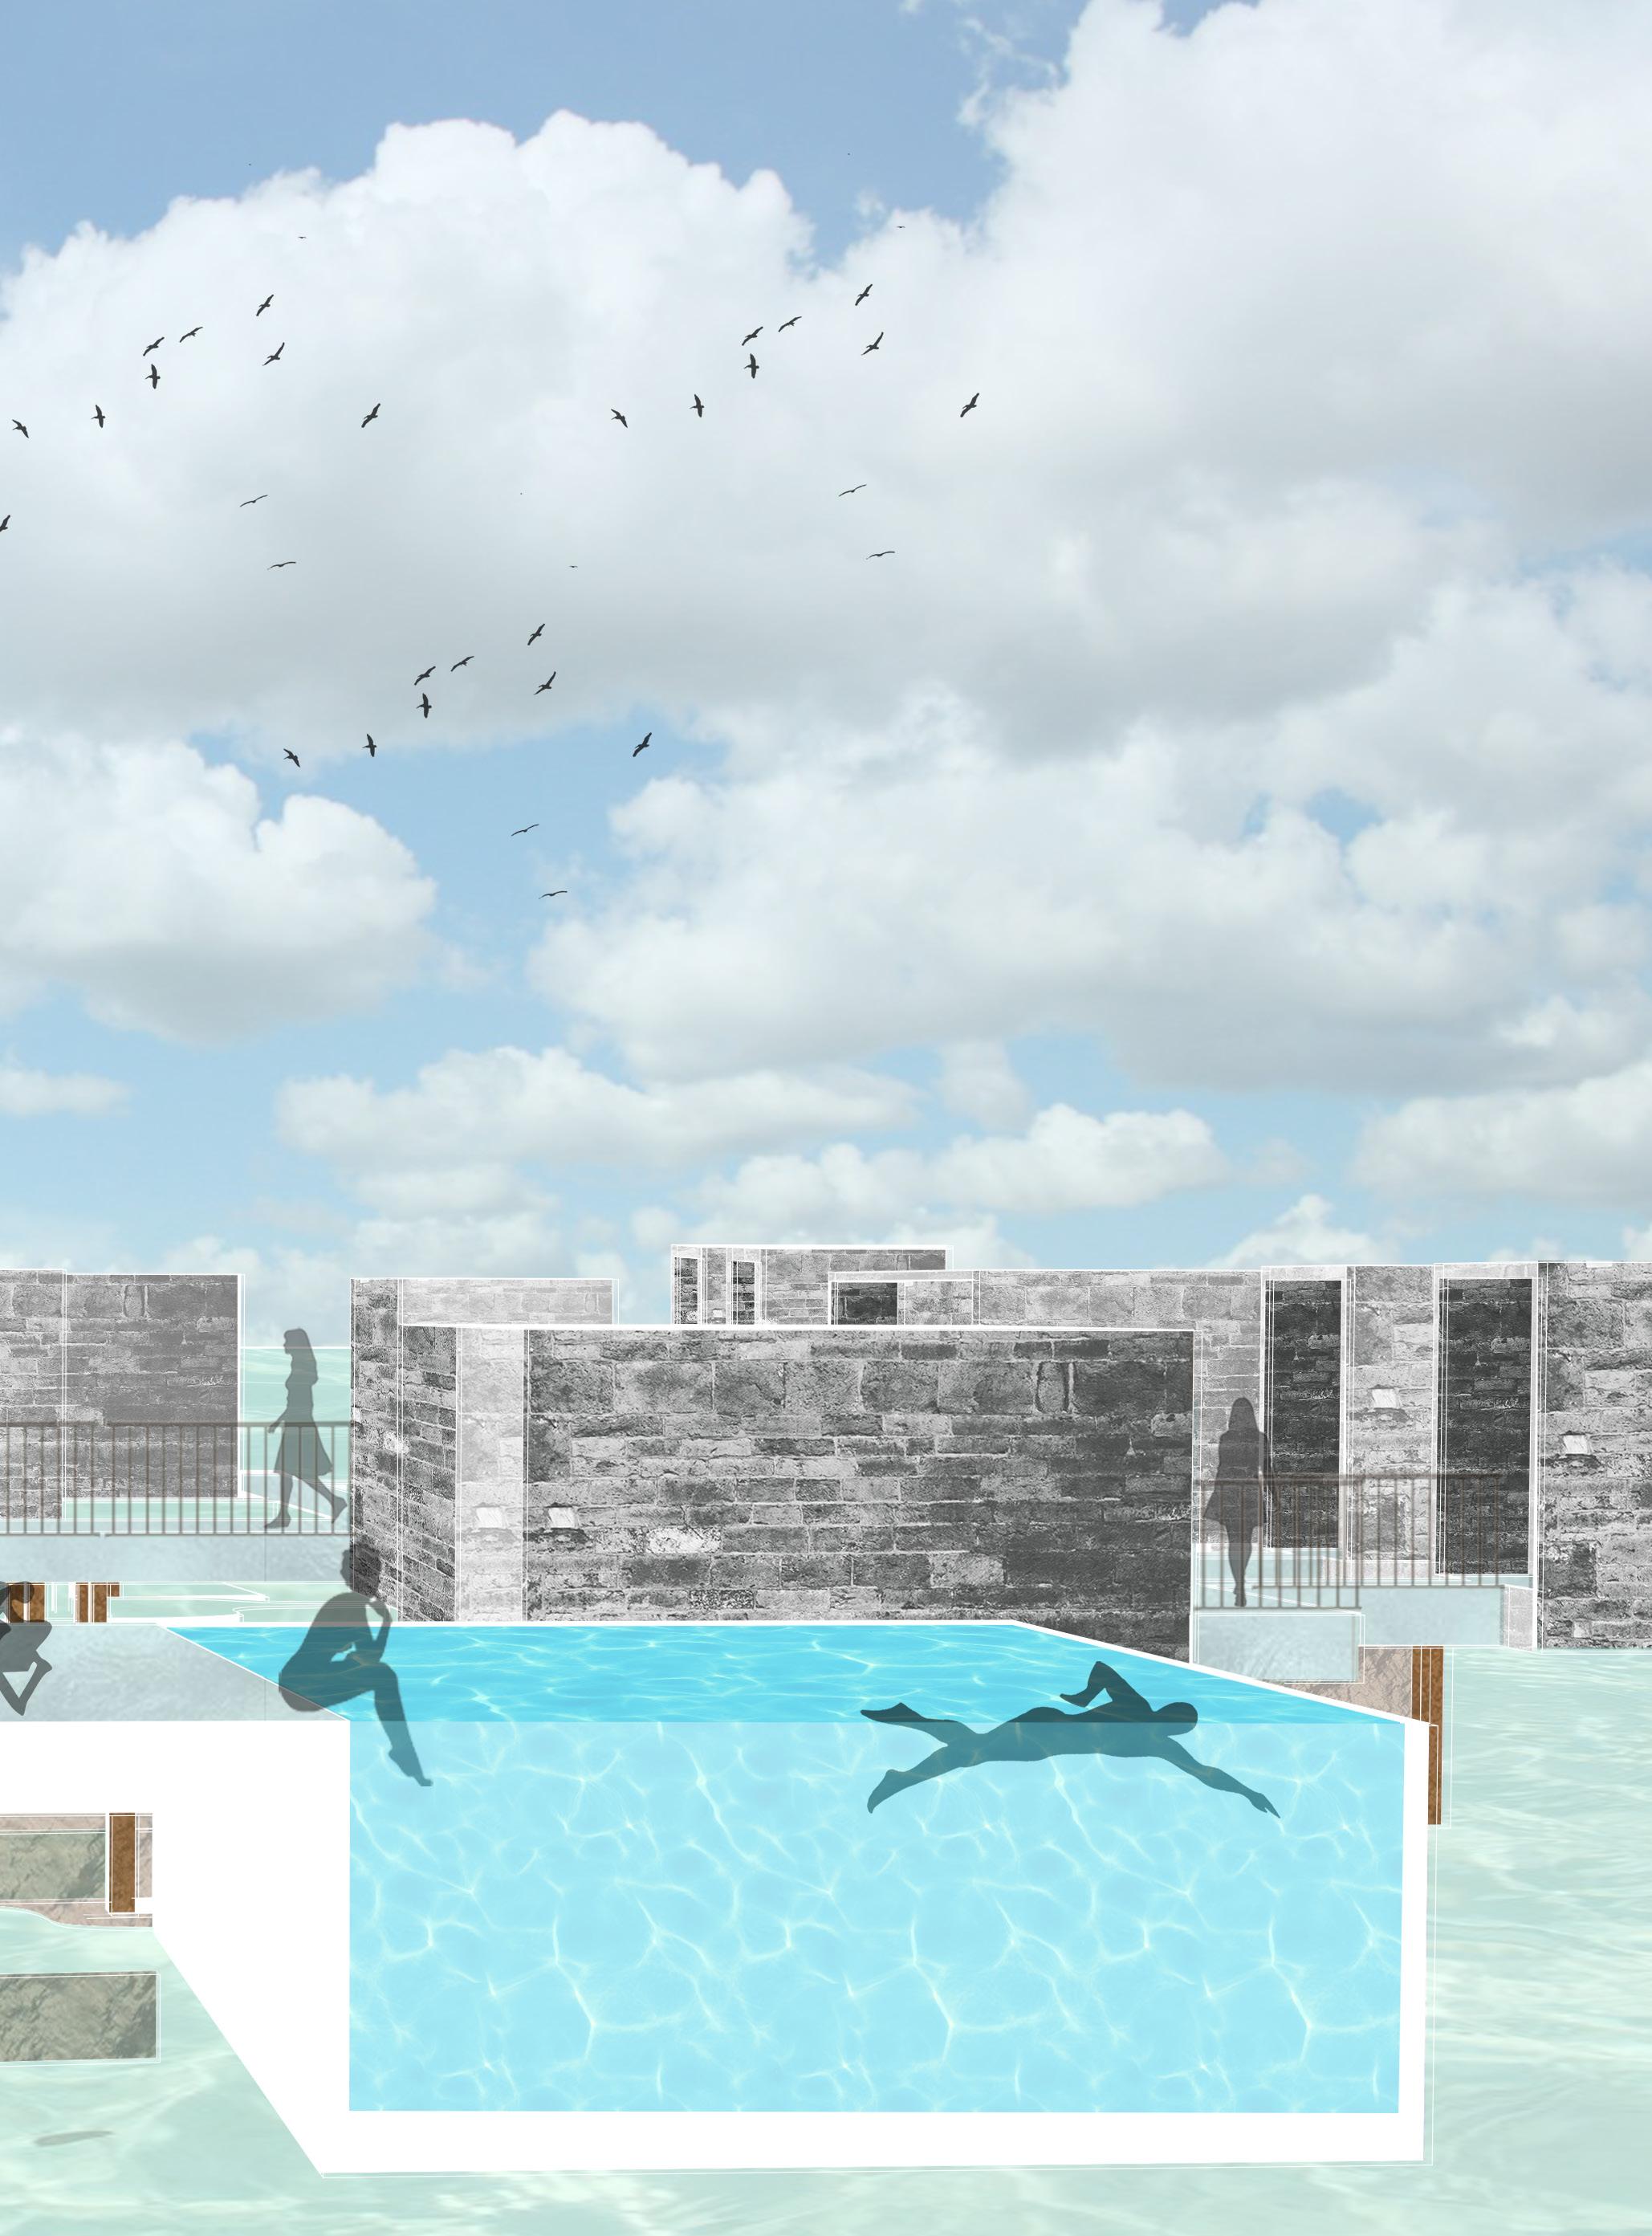
Cultural and historical significance of Manchester Mill Ruins changes over time as a result of every additioal layer that brings in new use and information. This proposal tries to capture the information that remains in the core of the aggregation of these different layers. It tries to highlight how passing of time can change the cultural and historical significance just like the water changes its course over the rocks in different seasons. Since the proposal plays with similar elements like the material and the use of river water but arrays them in a different way rather than an experienced combination that exists, it shows how liminality – ‘Using familiar elements and defamiliarizing them’ – drives this project. The passage from Manchester Mill Ruins to the Wellness Center asks the visitor to realize and experience the history of the site and slowly progress through its limits – through the ‘threshold’ / ‘Limen’– to be transitioned into a space with similar layers but a different composition.
