Urban Cooling Strategy


2052
2022 -
Acknowledgement of Country
Wagga Wagga City Council gulbali-yanhi ngurambang-gu Wiradjuri-gu walumaldhaany-galang. nganha bala mayiny Wiradjuri. yindyamali-yanhi mudyiganggalang-bu balumbambal-bu balugirbam-bu yindyamali-yanhi bagaraygan nguarambang-gawali-i yandu muran.
wigi wagga wagga-dha ngiyanhi gulbali-bu yindyamali-bu guwiinyguliyalagu buyaa-bu giilaang-galam-bu. ngiyanhi gulbali-bu yindyamali-bu guwiinyguliyalagu dhaagungiyalam-bu bila-galang-giyalam-bu. gulbali-yanhi Wiradjui-mayiny ngurambangguwalbu bala yarruwala-bu waluwin-bu walabangan-bu dhirrangal-bu.
Wagga Wagga City Council acknowledges the traditional custodians of the land, the Wiradjuri people, and pays respect to Elders past, present and future and extends our respect to all First Nations Peoples in Wagga Wagga.
We recognise and respect their cultural heritage, beliefs and continuing connection with the land and rivers. We also recognise the resilience, strength and pride of the Wiradjuri and First Nations communities.

2 URBAN COOLING STRATEGY 2022 - 2052 WAGGA WAGGA CITY COUNCIL
Acknowledgement of Country

........................................................................... 2 Purpose.....................................................................................
.................................................................................................
.....................................................................................................
...........................................................................
............................................................................................... 94 References ...................................................................................................... 97
3 URBAN COOLING STRATEGY 2022 - 2052 WAGGA WAGGA CITY COUNCIL
Contents
.........................
This project has been proudly funded by the New South Wales Government with assistance from Local Government NSW under the Increasing Resilience to Climate Change program. ...................................................
5 Objectives .................... 5 Our warming world.......................................... .... 7 Vulnerable communities .................................................................................... 8 What is urban heat? .............................
......... 9 What is urban canopy? .................................. .................................................. 9 Mapping & analysis ......... ............................................................... 12 Survey area ................................... ................................................ 13 Airborne imagery and data analysis .......................................... ............... 13
Canopy cover by suburb ................................................................................ 17 Canopy cover by land use .............................................................................. 18 Public open space ........................................................................................................... 20 Road reserves .......... 21 Residential .. 22 Commercial 23 Industrial 24 Environmental conservation ........................................................................................... 25 Rural ................................................................................................................................ 26
Suburb profiles 27 Cooling mechanisms 82 Cool by design
83 Cooler roofs
84 Increasing the urban canopy
86 The right tree in the right place 88 Public open space 92 Action summary
IntroductionThis section explains the purpose and objectives of the Urban Cooling Strategy and why it is critical to the wellbeing of our community.
4 URBAN COOLING STRATEGY 2022 - 2052 WAGGA WAGGA CITY COUNCIL
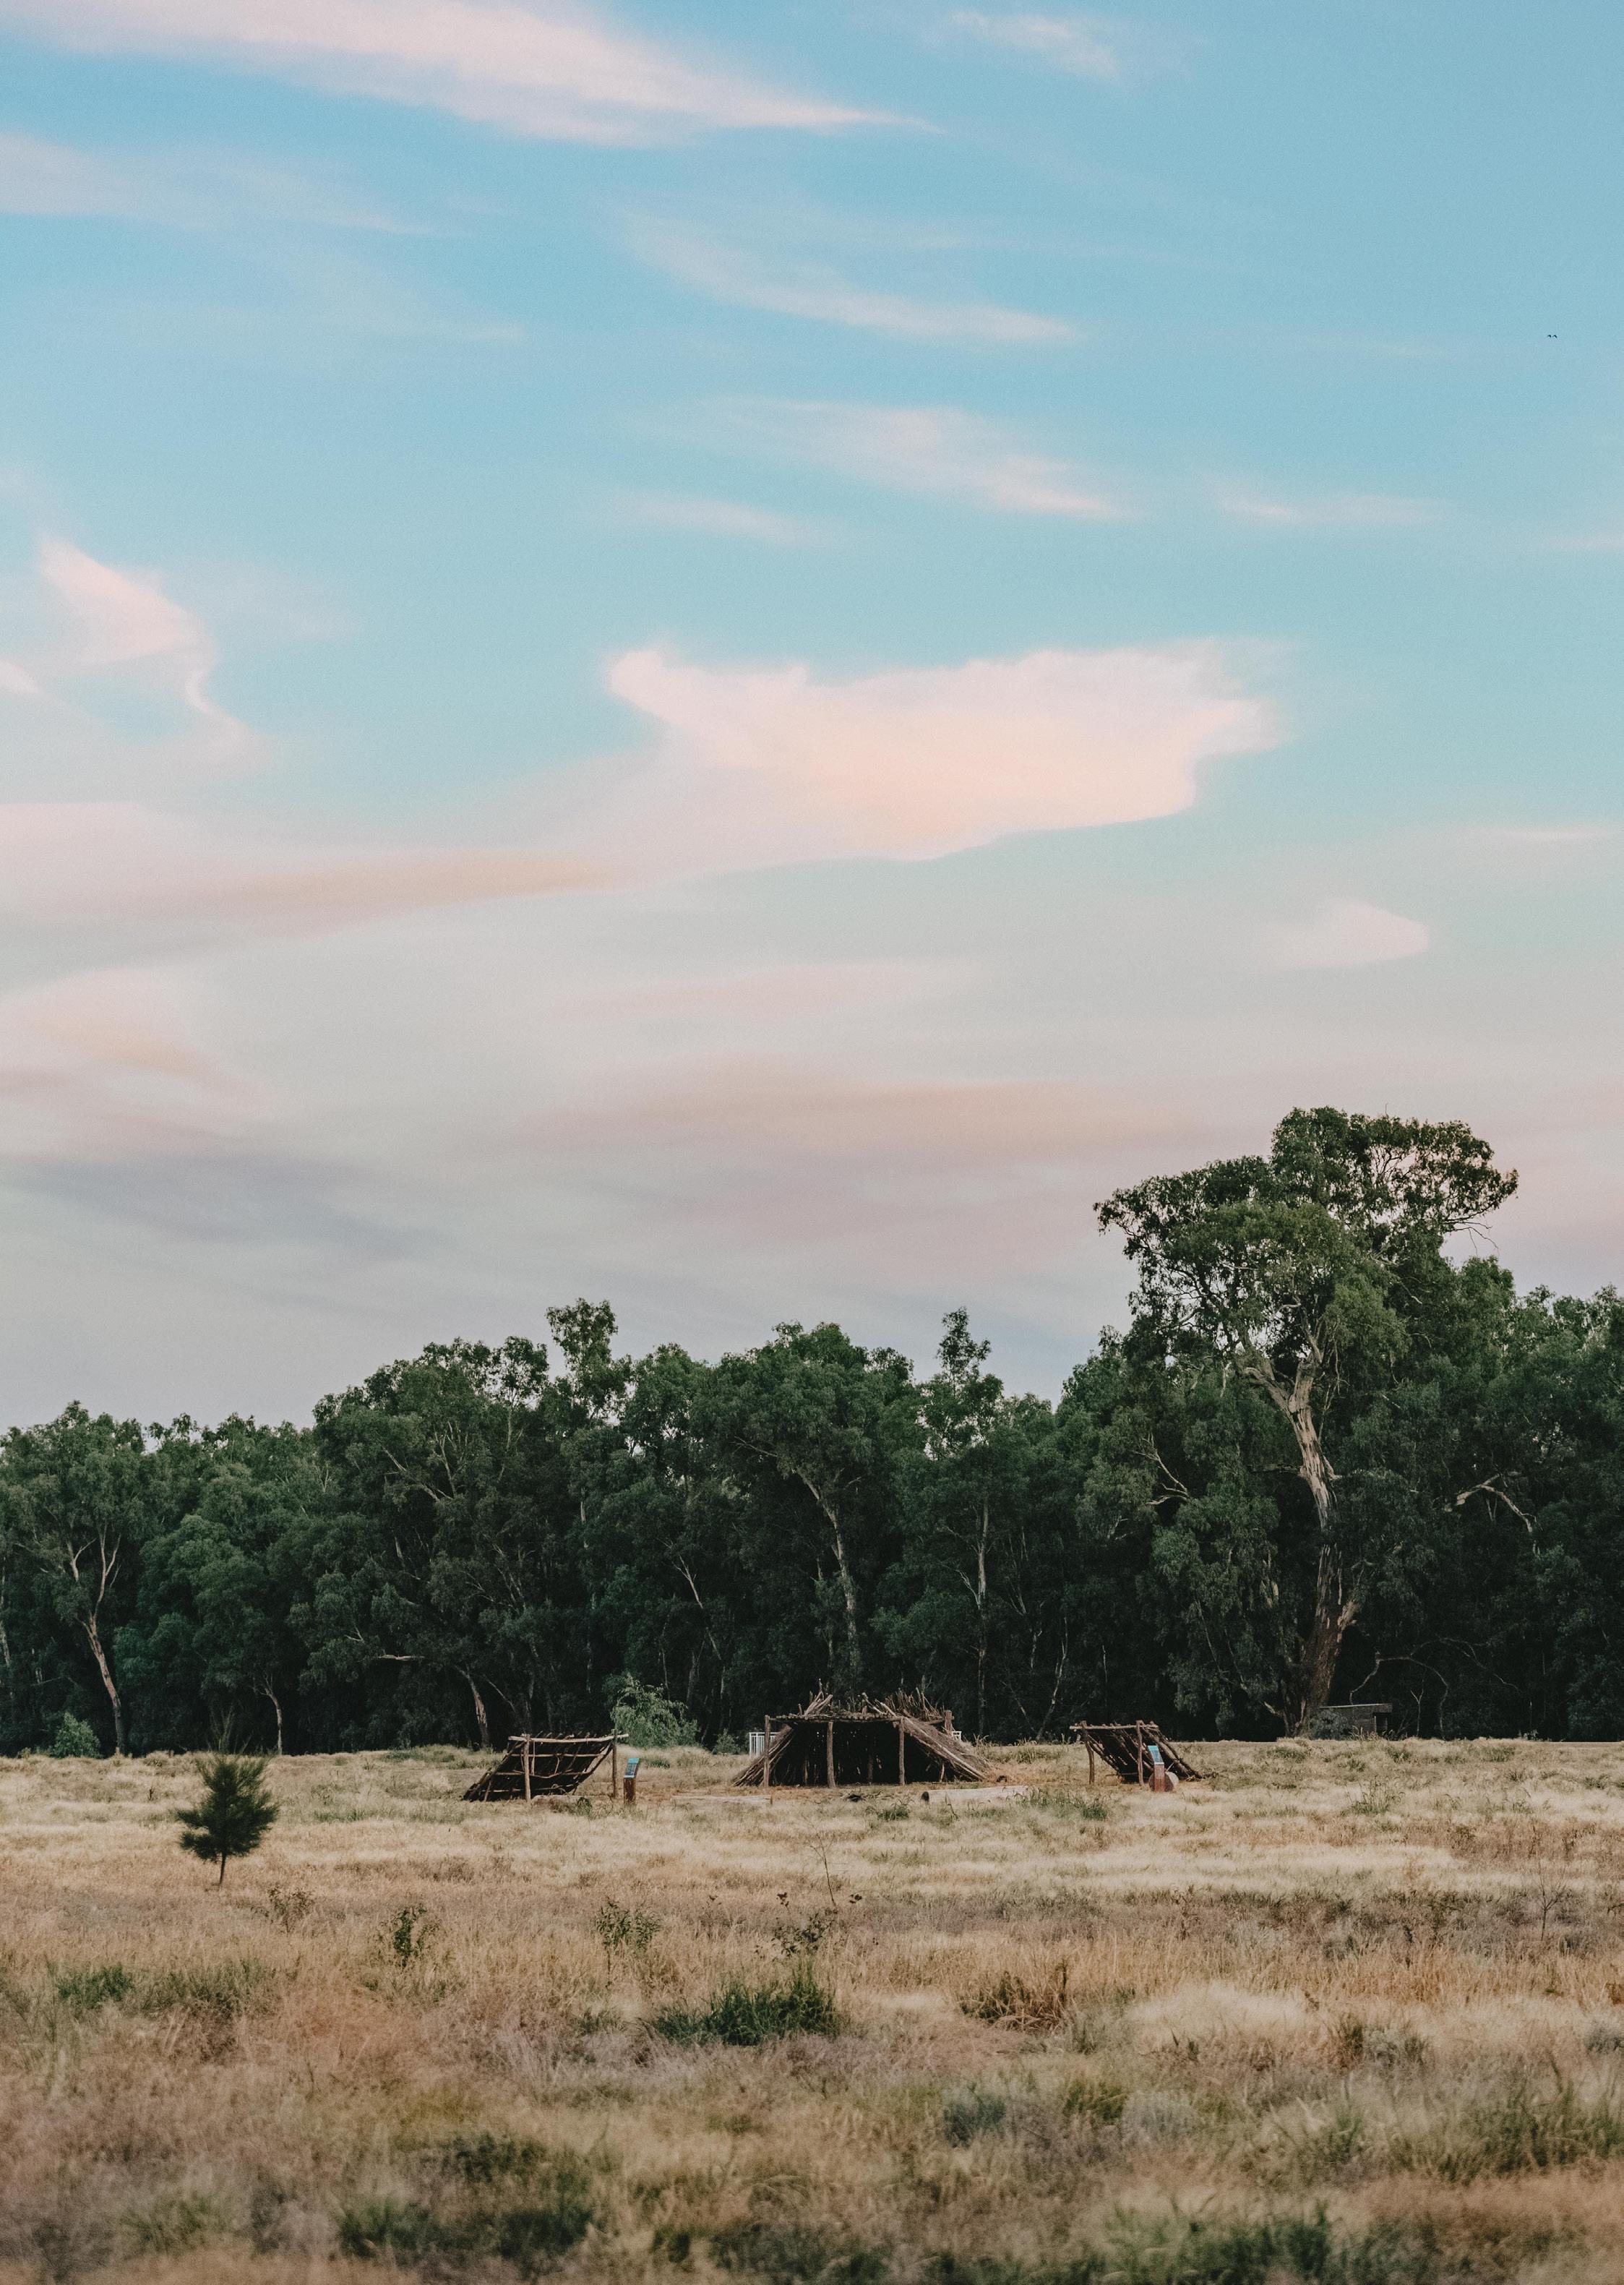
Image: Chloe Smith
Purpose
Our local community is faced with the challenges of a warming climate. Long term observations and climate modelling projections indicate that the region is expected to experience an increase in temperatures and frequency of extreme heat in the coming decades. This will have an impact on:
• Human health
• Energy consumption for cooling
• Water consumption
• Local biodiversity
• Infrastructure
• Public open space amenity and usage
Increased proportions of non-natural areas (the built environment) leads to the creation of urban heat islands, a phenomenon where urban areas experience higher temperatures compared to the surrounding environment.
Consequently, an effective cooling strategy is required to protect and build resilient communities from the impact of living in a warming climate.
There are several ways to create cooler urban areas, particularly during the urban planning phase, but the best value for money option is increasing the number of trees in the urban landscape.
Increasing the tree canopy in our local community will provide much needed shade and shelter from heat, improve our air and water quality, improve health and wellbeing and build our community’s resilience to climate change.
Objectives
The Urban Cooling Strategy (the Strategy) aims to increase community health, well-being and resilience through planning more sustainable future developments and adapting our existing areas wherever possible.
This will enable our community to:
• Plan for and create more liveable future neighbourhoods
• Reduce land surface temperatures in existing urban areas
• Increase urban canopy coverage on existing public and private land
• Increase the community’s awareness of urban cooling mechanisms
The Strategy is to be reviewed within 10 years so that ongoing canopy and heat mapping can be conducted. This will allow Council to evaluate trends and results from current initiatives. This will also enable continued prioritisation of activities and incorporation of any new technologies or approaches associated with cooling urban areas.
The Strategy also aligns with the priorities of the following key documents:
• Riverina Murray Regional Plan 2036
• Wagga Wagga Community Strategic Plan 2040
• Wagga Wagga Local Strategic Planning Statement 2040
• Corporate Net Zero 2040 Strategy
• Recreation, Open Space and Community Strategy 2040
• Biodiversity Strategy: Maldhangilnha 2020-2030.
5 URBAN COOLING STRATEGY 2022 - 2052 WAGGA WAGGA CITY COUNCIL
6 URBAN COOLING STRATEGY 2022 - 2052 WAGGA WAGGA CITY COUNCIL
Wagga’s Snapshot Max temperatures in Wagga Wagga projected to increase in near future (2020-2039) by 0.7ºC. total canopy cover area as a proportion of the entire study area Highest canopy cover recorded was total canopy cover area as a proportion of total land use area (not including rural). Max temperatures in Wagga Wagga projected to increase in far future (2060-2079) by 2.0ºC. Climate Change / Future Predictions Urban Tree Canopy Mapping Results Highest to Lowest Canopy Suburbs Coolest to Hottest Canopy Suburbs 0.7ºC 2.0ºC 7.9% 10.8% at Turvey Park. 16% Coolest median land surface suburb temperature was at Kapooka. 27.3ºC Hottest median land surface suburb temperature was at Forest Hill. 31.0ºC Lowest canopy cover recorded was at Bomen. 2%
Wagga
Our warming world
The impact of rising temperatures and the increasing frequency of heatwaves is a growing challenge for urban areas. These notable differences are expected to become even more pronounced with climate change. The Intergovernmental Panel on Climate Change estimates that ‘even if global warming is restricted to below 2°C, there could be a substantial increase in the occurrence of deadly heatwaves in cities if urban heat island effects are considered’ (IPCC 2018).
All across the world governments are recognising that future sustainable neighbourhoods will require the integration of urban tree cover, green spaces, cooler street and building design, the retention of water in the urban landscape and permeable surfaces if they are to mitigate the effects of increasing urban heat.
Adapt NSW and ACT’s Regional Climate Modelling (NARCLiM) projections indicate that our region is expected to experience an increase in all temperature variables (average, maximum and minimum) for the near future (2020-2039) and the far future (2060-2079) including significantly more very hot days (over 35°C) than we experience now (OEH, 2014).
Relevant best practice guidelines related to increasing resilience to urban heat include the following:
• Urban Heat Planning Toolkit
• Beating the Heat: A Sustainable Cooling Handbook for Cities
• Guide to Urban Cooling Strategies
• Minimising the impacts of extreme heat: A guide for local government
• State Environmental Planning Policy (Sustainable Buildings)
• Greener Neighbourhoods Guide
• Western Sydney Street Design Guidelines
• Greener Places Urban Infrastructure Design Framework
• Technical Guidelines for Urban Green Cover in NSW.
By integrating and implementing a variety of strategies we can adapt our urban environments to these changes in climate. Broadly, this encompasses the following key principles:
• More sustainable design of new built precincts
• Better design of blue and green spaces
• Increasing thermal efficiency of new buildings
• Adapting and retrofitting existing buildings and infrastructure
• Increasing urban canopy and green cover.
7 URBAN COOLING STRATEGY 2022 - 2052 WAGGA WAGGA CITY COUNCIL
Vulnerable Communities
Urban heat significantly affects liveability. Analysis shows that increased exposure to higher temperatures (more than 28°C) (WSROC 2018) results in negative impacts on sleep, health and labour productivity (WSROC 2018). These impacts are particularly apparent during heatwaves. Heatwaves can worsen existing illnesses (morbidity) and can cause death (mortality). In fact, statistics show that heatwaves kill more Australians than any other natural disaster including storms, fires and floods combined (WSROC 2018).
Extreme heat is a health risk to all members of the community; however, it has an even more adverse effect on vulnerable people in our community who are least able to cope.
People more at risk of heat related illness include:
• Those who are very young (0-4 years)
• Those who are elderly (70+ years)
• Those who have physical or cognitive impairments
• Those with poor social support systems.
Using the Australian Bureau of Statistics (ABS) Socio-Economic Indexes for Areas (SEIFA) database for neighbourhoods within the study area, sectors of the community most vulnerable to increasing temperatures and heatwaves in terms of their relative socio-economic disadvantage have been identified. Neighbourhoods with the lowest SEIFA index (ie the most disadvantaged) have been cross referenced against the heat and canopy mapping results and should be prioritised for urban cooling initiatives as much as possible.
Each suburb profile has the above demographic data included at the bottom (see Figure 1 below), and this is sourced from the 2021 Census Data.
Ashmont SEIFA: 779
Priorities
• UCS6 • UCS7 • UCS9 • UCS10 • UCS11
• UCS17 • UCS22 • UCS24
3,747 people
1,554 homes 27% of population more vulnerable to heat
• UCS12 • UCS14 • UCS16
Figure 1: Suburb sample profile incorporating Census data.
8 URBAN COOLING STRATEGY 2022 - 2052 WAGGA WAGGA CITY COUNCIL
Introduction
What is urban heat?
Urban areas, where built structures are most common are prone to higher temperatures relative to outlying areas. These hotter areas are referred to as ‘urban heat islands’. The difference in temperature between urban and less-developed areas has to do with how well the surfaces in each environment absorb and hold heat. Urban heat islands can form under a variety of conditions, including during the day or night, in large or small cities, and suburban areas. The UHI effect is primarily caused by:
Urban Mass and Form: The dimensions and spacing of buildings can influence wind flow and urban materials’ ability to absorb and release solar energy. In heavily developed areas, surfaces and structures obstructed by neighbouring buildings become large thermal masses that cannot easily release heat.
Urban Materials: Conventional materials used in urban environments such as pavements or roofing tend to reflect less solar energy and absorb and emit more of the sun’s heat compared to trees, vegetation, and other natural surfaces. Heat islands tend to build up throughout the day and become more pronounced after sunset due to the slow release of latent heat from these materials.
Waste Heat: Vehicles, air-conditioning units, buildings, and many industrial facilities emit heat into the urban environment. These sources of human-generated waste heat can contribute to heat island effects.
Reduced Natural Features: Trees, vegetation, and water bodies tend to cool the air by providing shade, transpiring water from plant leaves, and evaporating surface water. Hard, dry surfaces in urban areas – such as roofs, pavements, roads, buildings, and carparks– provide less shade and moisture than natural landscapes and therefore contribute to higher temperatures.
What is urban canopy?
All vegetation provides some cooling effect compared to bare dirt or hard surfaces. When the Strategy refers to ‘urban canopy’ it is referring to the vegetation comprising all trees and shrubs that are above 3m in height. This is the standard height used in studies to determine when meaningful shade (and cooling) is created.
Studies have shown the co-benefits of increasing urban canopy coverage rates and reducing land surface temperatures to a community. This is especially important given the predicted impacts of climate change at a local level. Increased average temperatures and numbers of excessively hot days will increase the impacts of the UHI effect, impacting negatively not only on the health of our community, but also the comfort and performance of our buildings and public spaces.
Urban trees create shade, mitigate the impacts of UHI effect and contribute to the creation of attractive community spaces and public realm. They are also an important part of urban biodiversity and create habitat and corridors for numerous birds and other animals.
9 URBAN COOLING STRATEGY 2022 - 2052 WAGGA WAGGA CITY COUNCIL
Introduction
10 URBAN COOLING STRATEGY 2022 - 2052 WAGGA WAGGA CITY COUNCIL
benefits of trees Increased water quality Increased biodiversity Environmental Increased amenity Increased recreation Social Increased house values Decreased energy costs Economic Increased air quality Increased mental health Health
The

11 URBAN COOLING STRATEGY 2022 - 2052 WAGGA WAGGA CITY COUNCIL
Mapping and analysis
This section discusses the aerial imagery and remote sensing techniques and the data on heat and canopy.

12 URBAN COOLING STRATEGY 2022 - 2052 WAGGA WAGGA CITY COUNCIL
Council engaged consultants ArborCarbon to acquire, process and deliver remotely sensed data used to determine current canopy cover using a unique 11-band airborne multispectral camera system (ArborCam) for the accurate detection of vegetation, vegetation condition and concurrent land surface temperature (LST).
The ArborCam was used to acquire high resolution imagery to accurately quantify canopy cover and identify urban hotspots. Vegetation cover statistics were extracted and categorised into different height strata, suburbs, land use zones and road reserves, as determined by Council. Heat and vegetation statistics were extracted for each suburb and these are described later.
Survey area
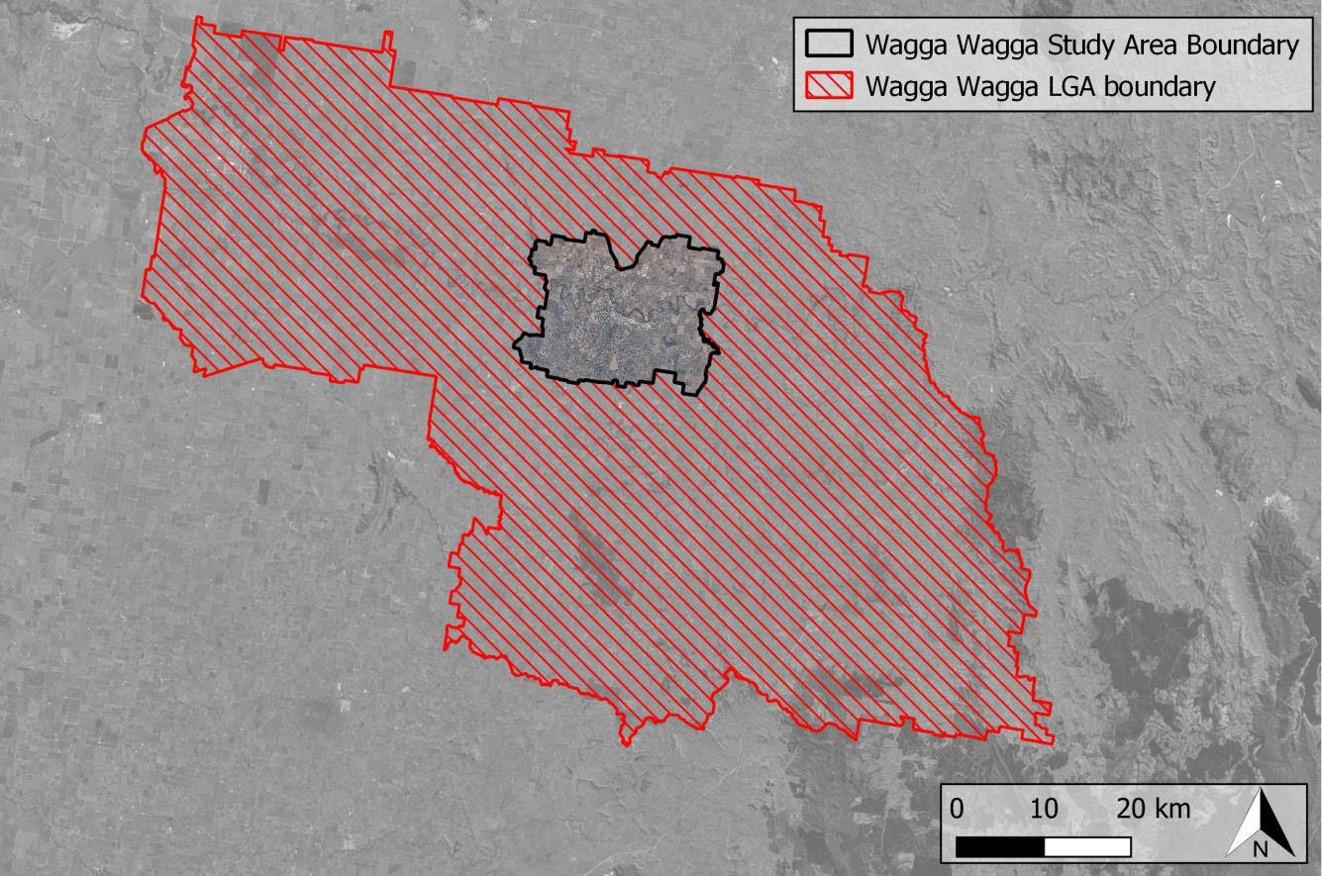
Height-stratified vegetation cover and LST statistics were calculated for the entire study area (Figure 2) and for 27 suburbs within the study area (Figure 3). The entire study area has a total land area of 31,840 hectares. The study area was determined based on Council’s mapping of suburb boundaries, presence of residential zonings and proximity to the urban centre and subsequent flight path.
As a consequence the suburbs vary greatly in size and population density, with some being completely urban in character, and others being predominantly rural in character.
Airborne imagery and data analysis
High-resolution airborne multispectral imagery was acquired at 16,000 feet above ground level over the study area during 19-26 February 2021. Imagery was acquired at a ground sample distance (GSD) ranging from 16 cm/pixel to 48 cm/pixel dependent on the spectral band. The thermal imagery was acquired with a GSD of 200 cm/pixel. The maximum air temperature recorded during the survey was 29.3°C (BOM, 72150).
A Digital Surface Model was generated from the acquired imagery for the full extent of the Wagga Wagga study area boundary, enabling the stratification of vegetation into five pre-determined height categories as follows: Grass, 0-3m (excluding grass), 3-6m, 6-10m, 10-15m, 15-20m, and >20m.
Different spectral bands were used to detect all living vegetation in sun and shadow. Vegetation that was not photosynthesising at the time of acquisition, such as dead wood in tree crowns and dead grass, was not classified as vegetation.
The acquired data was processed to produce high-resolution RGB imagery, False Colour Composite (FCC) imagery, a height-stratified vegetation cover dataset, land surface temperature (°C) and Vegetation Condition Index (VCI) across the study area. Examples of close-up images obtained from the datasets are shown in Figure 4 and Figure 5.
13 URBAN COOLING STRATEGY 2022 - 2052 WAGGA WAGGA CITY COUNCIL

14 URBAN COOLING STRATEGY 2022 - 2052 WAGGA WAGGA CITY COUNCIL
Figure 2: The Wagga Wagga Study Area (black) overlain the Wagga Wagga LGA area (red hash).
Figure 3: Wagga Wagga City Council suburb boundaries used to calculate vegetation cover and LST statistics.


15 URBAN COOLING STRATEGY 2022 - 2052 WAGGA WAGGA CITY COUNCIL
Figure 4: Close-up example images of each of the datasets generated for the Wagga Wagga study area: A) High resolution RGB imagery; B) Height-stratified vegetation cover, with each stratum displayed as a different colour; C) False Colour Composite (FCC) showing vegetation
Figure 5: Web-based mapping tool showing sliding door image of thermal imagery (left) and vegetation stratification (right) of part of central Wagga Wagga.
Mapping and analysis
Land surface temperature by suburb
Land surface temperature (LST) for each suburb was calculated from the thermal imagery taken in February 2021, with the overall median LST of the entire study area showing 29.2°C. The strong correlation between higher rates of canopy cover and lower LST values is evident throughout the study area.
Suburbs with large areas of non-vegetated impervious surfaces such as buildings, roads, tarmac, carparks, and bare soil generally resulted in higher average LST across the study area, such as Forest Hill and Gumly Gumly. Suburbs containing urban heat islands or ‘hotspots’, such as shopping centres, industrial estates and densely populated areas raise the LST of the suburb also.
Conversely, suburbs containing a higher vegetation cover proportion due to remnant native vegetation and small or sparse built up areas, (such as Springvale and San Isidore) resulted in lower LST. There can also be very broad ranges within the suburbs themselves.
The median LST values for each suburb are shown in Figure 6.

16 URBAN COOLING STRATEGY 2022 - 2052 WAGGA WAGGA CITY COUNCIL
Figure 6: Graph showing the median Land Surface Temperature (LST) values for each suburb.
Canopy cover by suburb
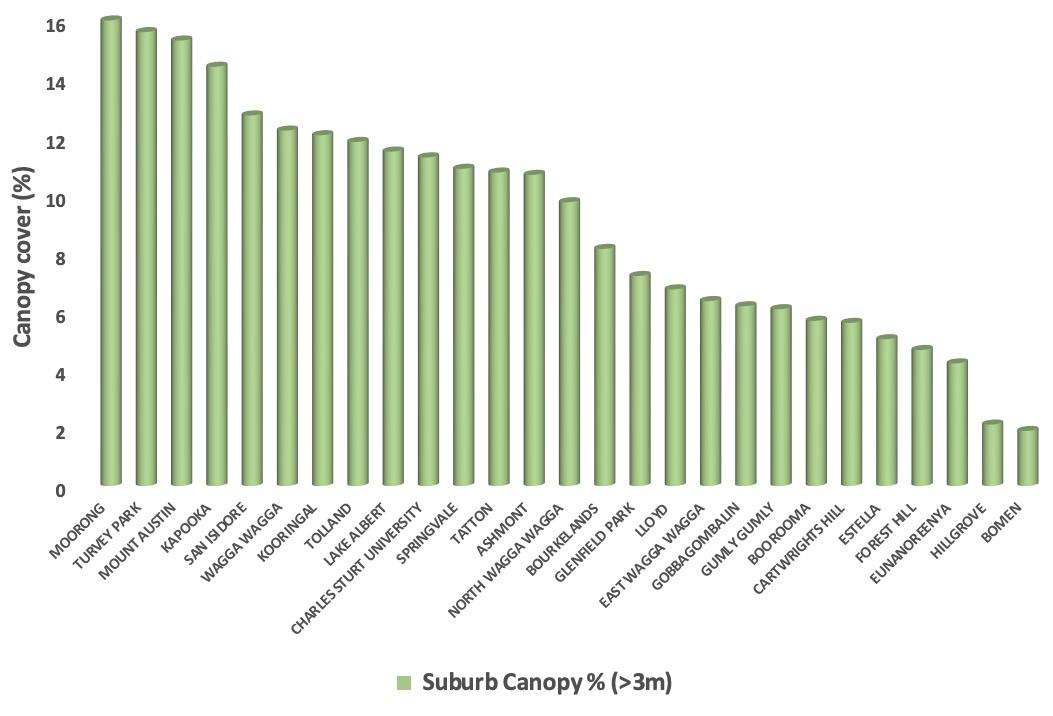
Canopy covered an area of 2,501 ha (7.9%) of the entire study area (including the surveyed rural areas). When the rural areas are excluded the average canopy, cover represents 10.8% of the remaining study area.
Height stratified vegetation cover was calculated for each of the 27 suburbs and ranked according to canopy cover (all vegetation greater than 3m in height) as a proportion of suburb area. Suburbs that contained higher areas of remnant vegetation, such as Turvey Park, Moorong, Mount Austin and Kapooka, recorded higher than average canopy cover, whilst suburbs containing large areas of industrial land, such as Bomen, and/or large areas of tilled farming land such as Hillgrove and Eunanoreenya, recorded lower than average canopy cover results.
Newer suburbs containing immature tree plantings providing little canopy, such as Estella and Boorooma, showed low canopy cover, whereas older, more established suburbs such as Central Wagga Wagga, Kooringal and Tolland revealed higher than average canopy cover rates as a proportion of total suburb area.
Canopy cover ranking for each suburb is shown in Figure 7.
Figure 7: Canopy cover of 27 suburbs of the study area as a proportion of total suburb area. Canopy cover is defined as all vegetation greater than 3m in height.
17 URBAN COOLING STRATEGY 2022 - 2052 WAGGA WAGGA CITY COUNCIL
Mapping and analysis
Canopy cover by land use
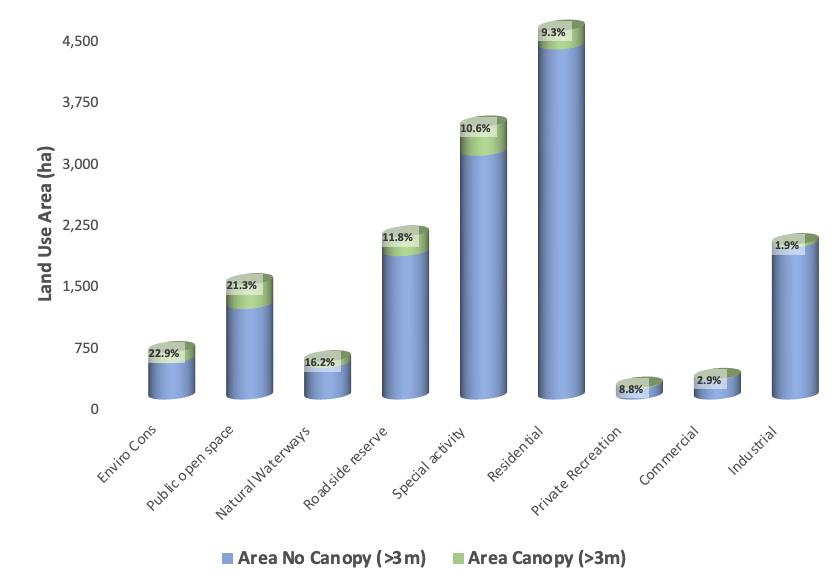
The total canopy cover area (1,592 ha) as a proportion of total land use area (not including Rural) is 10.8%. Canopy cover (>3m) was calculated for major land use areas throughout the study area. Land use areas were defined by Wagga Wagga LEP 2010 zones spatial datasets and proportion of canopy cover for each land use area were extracted for each zone.
The highest canopy cover proportion to land use area was Environmental Conservation, containing 132 ha (22.9%) of canopy cover within a total land use area of 575 ha. Environmental Conservation land use areas are mainly remnant vegetation corridors found in ridgetops and reserves within parts of Lloyd, Moorong, Bourkelands, Tatton, Springvale, North Wagga Wagga and Kapooka.
Industrial land areas are a combination of heavy, light and general industrial zones and includes the Bomen Special Activation Precinct, the East Wagga Wagga industrial area and also the Chaston Street and Saxon Street areas. Industrial land use contains the lowest proportion of canopy cover at 1.9% (37 ha).
Commercial land use includes retail and wholesale premises within the Wagga Wagga CBD and other business precincts such as Dobney Avenue, along the Sturt Highway, and suburban shopping malls and local centres. Commercial land use is the second smallest land use containing just 7ha (2.9%) of canopy cover.
Residential land use is a combination of all types and densities of residential zoned land. This land use type is by far the largest within the study area (excluding Rural) and contains 441ha (9.3%) of canopy cover.
Roadside reserve encompasses the land parcel inclusive of the road network, footpaths and adjoining nature strip. Roadside Reserves have a total area of 1,987 ha and contained 235ha (11.8%) of canopy cover.
18 URBAN COOLING STRATEGY 2022 - 2052 WAGGA WAGGA CITY COUNCIL
Public Open Space refers to all the land that can be accessed by the public for sport and recreation purposes. This land contained 299 ha (21.3%) of canopy cover. Major areas of Public Open Space include Pomingalarna Park, Willians Hill Reserve, Jubilee Park, Equex Exhibition Centre, Bolton Park and several smaller riverine reserves, sporting ovals and parkland.
Private Recreation is a small land use area including the Murrumbidgee Turf Club, Wagga Wagga Country Golf Club, Wagga Wagga Showground and the Wagga Wagga Pitch n Putt and Driving Range. Canopy cover in this land use is 8.8% (12 ha) of total land use area.
Land zoned as Natural Waterways is almost exclusively comprised of canopy cover from within the Murrumbidgee River corridor and smaller areas such as Wollundry Lagoon and Lake Albert. The total area of land classified as Natural Waterways is 462ha and this contains 75 ha (16.2%) of canopy cover.
Special Activity land use includes Government facilities such as Kapooka Army Barracks, Charles Sturt University, RAAF Defence Base, Department of Primary Industries research land, Hospitals and various Council operational facilities such as Sewage Treatment Plants. Special Activity land use contains 354ha (10.6%) canopy cover. Special Activity land use area has not been discussed at suburb level below due to lack of spatial data on breakdown of road reserve, residential and public open space within this land use.
Rural land use made up 54% (17,091 ha) of the captured data for the study area and contained 916ha (5.4%) canopy cover. This land use combines all primary production lots and land bordering on or transitioning from primary production to large lot residential.
Rural land use has not been displayed in Figure 8 below due to the very large area covered, the practicalities of increasing canopy cover in a land use designated for primary production, and the minimal amount of built up areas subject to urban heat island effect.
Figure 8 shows a breakdown of each land use size and how much of that area is canopy.
Figure 8: Canopy cover as a proportion of land use area. Total canopy cover over total land use area is 10.8%.
19 URBAN COOLING STRATEGY 2022 - 2052 WAGGA WAGGA CITY COUNCIL
Mapping and analysis
Public open space
The total canopy cover area (299 ha) as a proportion of total Public Open Space (POS) land use area is 21.3%.
Suburbs with the highest rates of canopy cover in POS generally contain large areas of remnant and/or riparian vegetation in parkland and reserves. North Wagga Wagga, Central Wagga Wagga, Turvey Park, Lake Albert and Moorong contain higher than average canopy cover. Cartwright’s Hill (26.7%) contains a high level of canopy cover due to a small strip of remnant vegetation adjacent to the Olympic Highway.
Wilks Park, Willans Hill, Victory Memorial Gardens, Collins Park, Botanical Gardens, Pomingalarna Reserve, and public reserves in and around Rawling’s Park and the Murrumbidgee River contribute to the high canopy rates in their corresponding suburbs.
Suburbs with lower canopy cover rates are typically industrial areas containing little POS such as Bomen and East Wagga Wagga. Others contain new subdivisions with immature plantings such as Lloyd. Suburbs with large areas of sporting ovals will contain high proportions of turf but very little canopy cover such as Jubilee Park in Bourkelands and the Equex Centre in East Wagga Wagga.
Figure 9 shows a breakdown of POS land use area and canopy cover by suburb.
Figure 9: Canopy cover as a proportion of POS land use area. Total canopy cover over total POS land use area is 21.3%

20 URBAN COOLING STRATEGY 2022 - 2052 WAGGA WAGGA CITY COUNCIL
Road reserves
The total canopy cover area (235 ha) as a proportion of total Road Reserve land use area is 11.8%.
The majority of Road Reserve area (58%) is made up of non-vegetated surfaces, namely roads and footpaths. Vegetation of less than 3m in height (including grass) makes up 30% of the Road Reserve area.
Suburbs containing a high proportion of canopy cover on the road reserve include Kapooka, Hillgrove, San Isidore, Moorong, and Gobbagombalin. This is due to larger more established trees remaining in the sparser areas which have not been cleared for utilities and development.
Older more established urban areas such as Lake Albert, Turvey Park, Central Wagga Wagga and Kooringal have higher than average canopy cover due to most trees being at full maturity.
Lower rates of road reserve canopy cover were found in suburbs containing new subdivisions such as Lloyd and Boorooma, as well as parts of Bourkelands and Tatton. Road reserves in Industrial areas such as East Wagga Wagga and Bomen were also below average.
Figure 10 shows a breakdown of Road Reserve land use area and canopy by suburb.
Figure 10: Canopy cover as a proportion of Road Reserve land use area. Total canopy cover over total road Reserve land use area is 11.8%

21 URBAN COOLING STRATEGY 2022 - 2052 WAGGA WAGGA CITY COUNCIL
Mapping and analysis
Residential
Residential refers to private land zoned for dwellings and excludes the road reserve (nature strip) area. The total canopy cover area (441 ha) as a proportion of the total Residential land use area is 9.3%.
Older suburbs such as Turvey Park, Lake Albert and Kooringal have higher than average canopy cover due to a larger number of established gardens on house and land lots suitable for tree plantings. Suburbs with large residential lots are also found in North Wagga Wagga, Springvale and San Isidore. These suburbs are also above the study area average.
Moorong (13.5%) has the highest residential canopy cover, however a large, uncleared remnant vegetation patch on an undeveloped lot zoned for residential use is included in the dataset.
Lower canopy cover suburbs are typically newer residential subdivisions such as Gobbagombalin, Lloyd, Estella, Bourkelands and Boorooma where the trend has been to build larger houses on smaller blocks.
Figure 11 shows a breakdown of Residential land use area and canopy by suburb.
Figure 11: Canopy cover as a proportion of Residential land use area. Total canopy cover over total Residential land use area is 9.3%

22 URBAN COOLING STRATEGY 2022 - 2052 WAGGA WAGGA CITY COUNCIL
Commercial
The total canopy cover area (7 ha) as a proportion of total Commercial land use area is 2.9%.
Commercial land use comprises a large majority of non-vegetated area (77.3%) which is predominantly made up of buildings, hardstand areas and carparking. Vegetation of less than 3m in height (including grass) makes up 19.7% of the total Commercial land use area.
Shopping centres in the suburbs of Forest Hill, Tolland, Kooringal, Turvey Park and takeaway stores in places like Bomen and North Wagga Wagga show higher than average canopy cover. Most planting that occurs on Commercial lots is in the carparking areas.
Boorooma, Lloyd, Bourkelands and Estella all have Commercial zoned lots that are not yet developed.
Figure 12 shows a breakdown of Commercial land use area and canopy by suburb.
Figure 12: Canopy cover as a proportion of Residential land use area. Total canopy cover over total Residential land use area is 9.3%

23 URBAN COOLING STRATEGY 2022 - 2052 WAGGA WAGGA CITY COUNCIL
Mapping and analysis
Industrial
The total canopy cover area (37 ha) as a proportion of total Industrial land use area is 1.9%.
Industrial land use comprises a non-vegetated area of 58.4%. Industrial land area is predominantly used for buildings, hardstands, carparking and other infrastructure associated with operations. Vegetation of less than 3m in height (including grass) makes up 39.7% of the total area for Industrial zoned land.
Higher than average canopy cover rates were seen in small pockets of industrial land areas in Kooringal, Forest Hill, Cartwright’s Hill and Glenfield Park. Bomen has very low cover (1.7%) comprising a small amount of remnant vegetation as a result of historical land clearing practices.
Figure 13 shows a breakdown of Industrial land use area and canopy by suburb.
Figure 13: Canopy cover as a proportion of Industrial land use area. Total canopy cover over total Industrial land use area is 1.9%

24 URBAN COOLING STRATEGY 2022 - 2052 WAGGA WAGGA CITY COUNCIL
Environmental conservation
The total canopy cover area (132 ha) as a proportion of total Environmental Conservation land use area is 22.9%.
Most of the land zoned as Environmental Conservation is located in the south of the study area.
The suburb of Moorong contains the highest canopy cover, resulting from vegetation located on the Soil Conservation Service land holdings, and Silvalite Reserve.
Smaller areas of Environmental Conservation land are located in riparian areas in North Wagga Wagga, the Willans Hill ridgeline through Tatton, Bourkelands and Springvale, and also the Birramal Conservation Area in Lloyd.
Figure 14 shows a breakdown of Environmental Conservation land area and canopy by suburb.
Figure 14: Canopy cover as a proportion of Environmental Conservation land use area. Total canopy cover over total Environmental Conservation land use area is 22.9%

25 URBAN COOLING STRATEGY 2022 - 2052 WAGGA WAGGA CITY COUNCIL
Mapping and analysis
Rural
Rural is the largest of the land use areas, representing 54% of the total study area. It is comprised of all lots zoned for primary production and some small areas zoned as transition where rural land and large lot residential are adjacent. The total canopy cover area (916 ha) as a proportion of total Rural land use area is 5.4%.
The largest areas of Rural land in the study area are found in the suburbs of Forest Hill, Eunanoreenya, Gobbagombalin and North Wagga Wagga.
Smaller Rural zoned land areas exist in urban fringe areas and these contain slightly higher rates of canopy due to a lack of large-scale farming practices taking place. Bomen and Hillgrove contain lower rates of canopy cover due to historic land clearing.
Figure 15 shows a breakdown of Rural land use area and canopy by suburb.
Figure 15: Canopy cover as a proportion of Rural land use area. Total canopy cover over total Rural land use area is 5.4%

26 URBAN COOLING STRATEGY 2022 - 2052 WAGGA WAGGA CITY COUNCIL
Suburb profiles
This section contains the canopy cover and heat profiles for each of the 27 suburbs of the study area.

27 URBAN COOLING STRATEGY 2022 - 2052 WAGGA WAGGA CITY COUNCIL
Ashmont
10.7% Canopy cover
• Ashmont covers an area of 242 ha with relatively high canopy cover of 26 ha
• Most of Ashmont is made up of low and medium density residential land, covering 124 ha, 10% of which contributes to canopy
• Public recreation areas, including Best Reserve and Webb Park, contribute 7 ha of canopy cover in Ashmont
• Roadside reserves make up a quarter of land area in Ashmont and contains 6 ha of canopy cover
30.2°C Land surface temp
Ashmont SEIFA: 779
Priorities
UCS7
UCS9
UCS10
UCS11
UCS12
UCS14
• Although Ashmont has higher than average canopy cover, urban heat islands such as industrial areas of Dobney Avenue and the primary schools contribute to raising the median temperature of the suburb. 1,554 homes 27% of population more vulnerable to heat
28 URBAN COOLING STRATEGY 2022 - 2052 WAGGA WAGGA CITY COUNCIL
3,747 people
•
•
•
•
•
•
•
• UCS6
UCS16 • UCS17 • UCS22 • UCS24


29 URBAN COOLING STRATEGY 2022 - 2052 WAGGA WAGGA CITY COUNCIL
Figure 16: High resolution aerial photograph of Ashmont (February 2021)
Figure 17: Land surface temp of Ashmont taken from airborne thermal camera (February 2021)
Bomen
1.9% Canopy cover
• Bomen covers an area of 2,741 ha and has the lowest canopy cover of all suburbs at 52 ha
• Bomen contains Wagga Wagga’s major industrial area which houses solar farms, manufacturing and Council’s Livestock Marketing Centre
• Few trees currently exist to contribute to canopy due to historic large-scale farming activities
29.0°C
Land surface temp
• Whilst Bomen had the lowest level of canopy cover, the temperature of the suburb was measured to be 29.0ºC which is the average for all suburbs
• Lower reflectance temperatures appear from large bodies of storage water for industrial and farming purposes, and proportionally lower levels of paddocks that have recently tilled or stubble-filled paddocks
• Solar farms are emitting less heat than surrounding land due to the efficiency of panels absorbing light energy to convert to electricity, rather than emitting it as heat
30 URBAN COOLING STRATEGY 2022 - 2052 WAGGA WAGGA CITY COUNCIL
12
40
homes 30% of population more vulnerable to heat
people
Priorities Bomen SEIFA: 1054
• UCS1 • UCS7 • UCS8 • UCS20 • UCS23 • UCS25


31 URBAN COOLING STRATEGY 2022 - 2052 WAGGA WAGGA CITY COUNCIL
Figure 18: High resolution aerial photograph of Bomen (February 2021) Figure 19: Land surface temp of Bomen taken from airborne thermal camera (February 2021)
Boorooma
5.7% Canopy cover
• Boorooma covers area of 157 ha with a canopy cover of 9 ha
• Most of Boorooma is made up of newly developed subdivisions, with residential properties accounting for 69% of land use
• Whilst roadsides contribute 37ha, canopy cover in these spaces are due to the immature age of trees currently planted
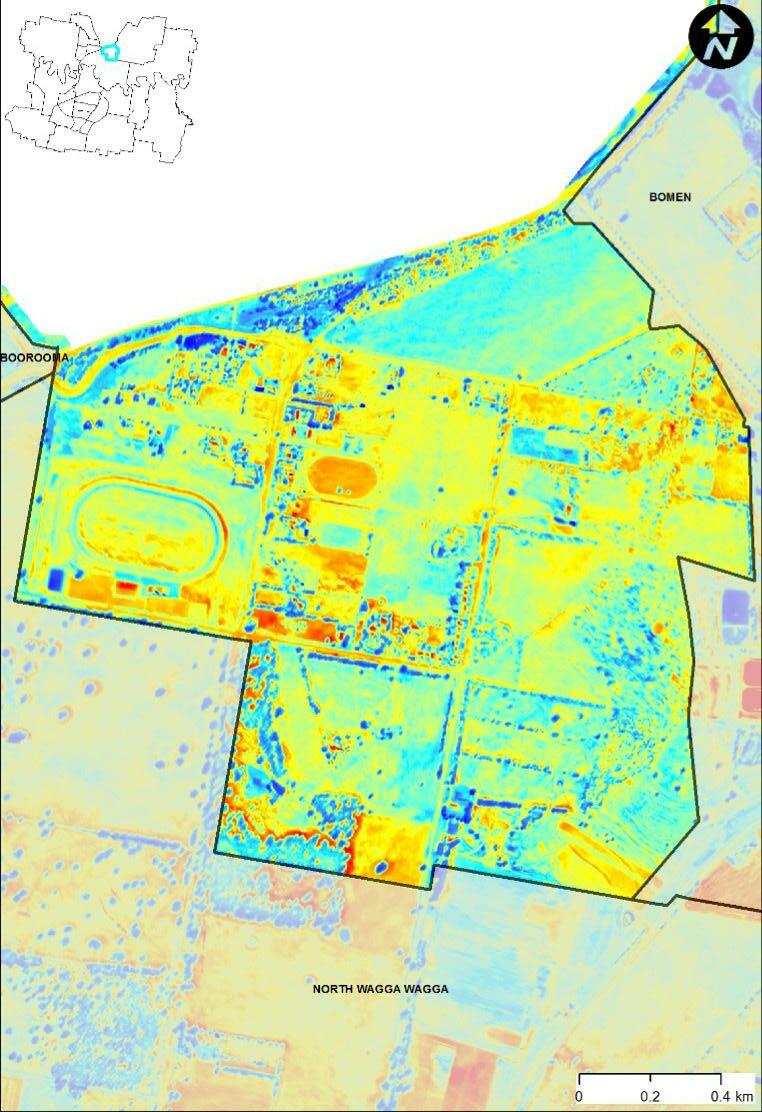
29.1°C Land surface temp
• Boorooma has a median temperature of 29.1ºC, on average for all suburbs
• Low canopy cover and higher absorption of heat in darker coloured rooves causes higher urban temperatures
Boorooma SEIFA: 1071 • UCS6 • UCS7
Priorities
UCS9 • UCS11 • UCS12
• UCS15 • UCS16 • UCS19 • UCS22
32 URBAN COOLING STRATEGY 2022 - 2052 WAGGA WAGGA CITY COUNCIL
585
1,741
homes 16% of population more vulnerable to heat
people
•


33 URBAN COOLING STRATEGY 2022 - 2052 WAGGA WAGGA CITY COUNCIL
Figure 20: High resolution aerial photograph of Boorooma (February 2021)
Figure 21: Land surface temp of Boorooma taken from airborne thermal camera (February 2021)
Bourkelands
8.1% Canopy cover
• Bourkelands covers an area of 213 ha with a slightly above average canopy cover of 17 ha
• Older residential areas with higher levels of canopy cover mix with newly developed subdivisions of lower levels of canopy cover
• Public recreation land use makes up 24% of Bourkelands, mostly associated with Jubilee Park
• A ridge of zoned Environmental Conservation remnant vegetation is located on the eastern edge of the suburb
29.9°C Land surface temp
• Bourkelands has a median LST of 29.9ºC, which is a higher than average LST compared to all suburbs
• The older residential area to the northern end of the suburb experiences lower LST levels compared to the newer subdivisions due to lower rates of canopy cover
UCS7
UCS15
34 URBAN COOLING STRATEGY 2022 - 2052 WAGGA WAGGA CITY COUNCIL
1,121 homes 18% of population more vulnerable
3113 people
•
•
•
•
•
•
•
•
•
•
•
•
•
•
to heat
Priorities Bourkelands SEIFA: 1091
UCS6
UCS8
UCS9
UCS10
UCS11
UCS12
UCS14
UCS16
UCS17
UCS18
UCS19
UCS22
Figure


35 URBAN COOLING STRATEGY 2022 - 2052 WAGGA WAGGA CITY COUNCIL
Figure 22: High resolution aerial photograph of Bourkelands (February 2021)
23: Land surface temp of Bourkelands taken from airborne thermal camera (February 2021)
Cartwrights Hill
5.6% Canopy cover
• Cartwrights Hill covers an area of 277 ha with 15.5 ha total canopy cover
• The suburb contains a mix of large and small properties for primary production, and large lot residential
• Grasses and pasture dominate the suburb, with remnant vegetation on larger properties accounts for most of the canopy cover
29.4°C Land surface temp
• Cartwrights Hill has a median temperature of 29.4ºC, on average for all suburbs
• Tilled paddocks and cleared land for farming reveals areas of high heat, with remnant vegetation and large area of grasses and pasture in industrial areas comparatively cooler
Cartwrights Hill SEIFA: 1091
Priorities
• UCS8 • UCS9
• UCS11 • UCS12 • UCS14 • UCS22
36 URBAN COOLING STRATEGY 2022 - 2052 WAGGA WAGGA CITY COUNCIL
64 homes 7% of population more vulnerable to heat 169 people
Figure 24: High resolution aerial photograph of Cartwrights Hill (February 2021)
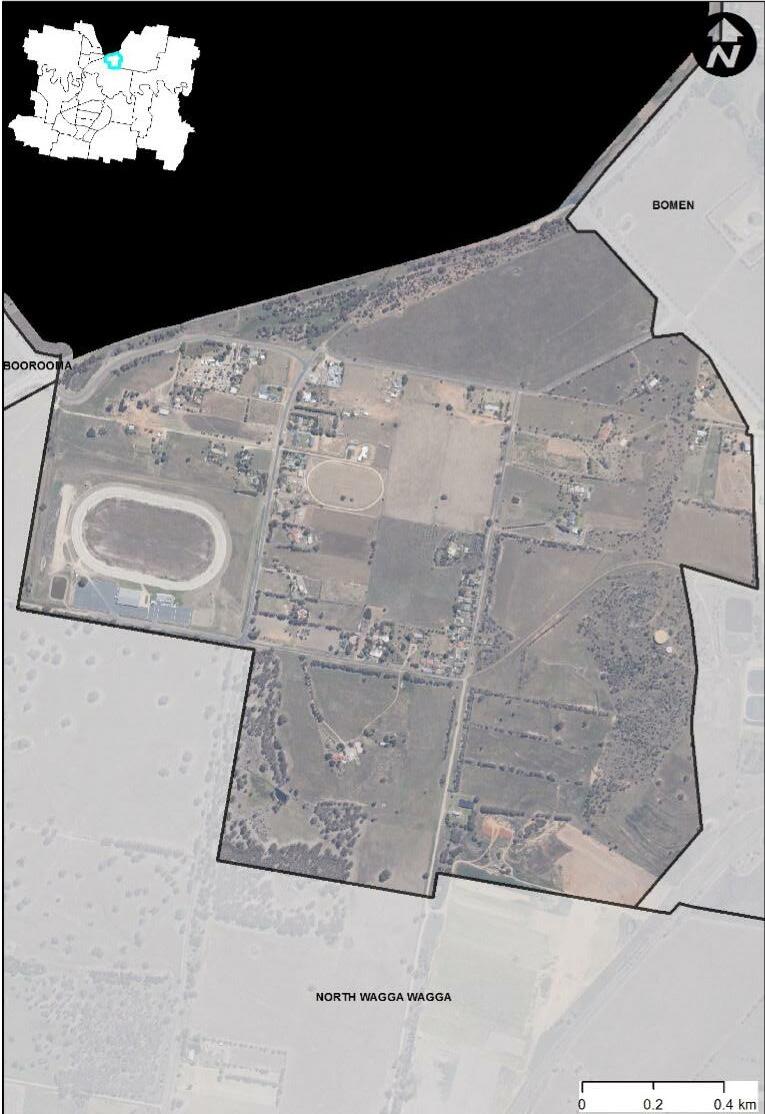
Figure 25: Land surface temp of Cartwrights Hill taken from airborne thermal camera (February 2021)
37 URBAN COOLING STRATEGY 2022 - 2052 WAGGA WAGGA CITY COUNCIL
Charles Sturt University
11.3% Canopy cover
• CSU covers an area of 346 ha with 39 ha of canopy cover
• The University’s central hill has large areas of remnant vegetation proportionate to the total suburb area with much of the suburb’s buildings spread throughout this vegetation
• CSU is predominantly zoned as Special Activity land
29.5°C Land surface temp
• Irrigated sporting ovals, large areas of remnant vegetation, pasture and irrigated grassed areas within the University grounds create areas of cooler surface temperatures
Charles Sturt University SEIFA: 1071
Priorities
• UCS7
• UCS8
• UCS14 • UCS20 • UCS22
433 people
• Large areas of tilled paddocks for farming over a relatively small suburb impact on higher than average temperatures 0 homes 0% of population more vulnerable to heat (excludes on campus accommodation)
38 URBAN COOLING STRATEGY 2022 - 2052 WAGGA WAGGA CITY COUNCIL


39 URBAN COOLING STRATEGY 2022 - 2052 WAGGA WAGGA CITY COUNCIL
Figure 26: High resolution aerial photograph of CSU (February 2021)
Figure 27: Land surface temp of CSU taken from airborne thermal camera (February 2021)
East Wagga Wagga
6.4%
Canopy cover
• East Wagga covers an area of 1049 ha with 67 ha of canopy cover
• Mixed land use of East Wagga includes industrial (233 ha), rural (479 ha), commercial (71 ha), public recreation (113 ha) and a small area of residential houses
• Rural land has the greatest tree cover (37 ha) and much of it located in the riverine floodplain adjacent to the Murrumbidgee River and Marshall’s Creek
• A mix of land use types including irrigated pastures, riverine canopy, industrial areas and bare earth paddocks result in an overall average temperature of 29C
Priorities
UCS16
40 URBAN COOLING STRATEGY 2022 - 2052 WAGGA WAGGA CITY COUNCIL
29.0°C Land surface temp
99 homes 12% of population more vulnerable to heat 213 people
East Wagga Wagga SEIFA: 997 • UCS6 • UCS7 • UCS8 • UCS9 • UCS10 • UCS11 • UCS12 • UCS14 •
• UCS18 • UCS19 • UCS21 • UCS22 • UCS23


41 URBAN COOLING STRATEGY 2022 - 2052 WAGGA WAGGA CITY COUNCIL
Figure 28: High resolution aerial photograph of East Wagga Wagga (February 2021)
Figure 29: Land surface temp of East Wagga Wagga taken from airborne thermal camera (February 2021)
Estella
5.0% Canopy cover
• Estella covers an area of 205 ha with 10 ha of canopy cover
• Most of Estella is residential land (135 ha), with older housing to the northern half of the suburb and newer subdivisions to the south
29.1°C
Land surface temp
Estella SEIFA: 1071
Priorities
2,541 people
• UCS1 • UCS6 • UCS7 • UCS8 • UCS9 • UCS10 • UCS11 • UCS12
• UCS14 • UCS15 • UCS16 • UCS18 • UCS19 • UCS22
• Estella shows a lower heat in the northern half of the suburb where canopy cover from more mature trees exists, whereas warmer heat is shown in the southern half of the suburb where newer less established housing is the norm 970 homes 27% of population more vulnerable to heat
42 URBAN COOLING STRATEGY 2022 - 2052 WAGGA WAGGA CITY COUNCIL


43 URBAN COOLING STRATEGY 2022 - 2052 WAGGA WAGGA CITY COUNCIL
Figure 30: High resolution aerial photograph of Estella (February 2021)
Figure 31: Land surface temp of Estella taken from airborne thermal camera (February 2021)
Eunanoreenya
4.2% Canopy cover
• Eunanoreenya (Eunony) covers an area of 3601 ha with 152 ha of canopy cover
• The suburb contains primary production land use, with the majority of the suburb having been cleared for farming practices
• Most canopy is located along the Murrumbidgee River and in small pockets of remnant vegetation in areas not cleared for farming practices
29.9°C Land surface temp
• Higher temperatures in the southern part of the suburb result from areas of tilled paddocks exposing bare earth ready for planting
• Areas to the north show slightly cooler temperatures than the south and appear to have more grasses and pasture and less area of tilling
Eunanoreenya SEIFA: 1046
Priorities
• UCS7
• UCS8
• UCS9
• UCS22
165 people
• The time of year the imagery was taken may influence temperatures due to cropping schedules 56 homes 16% of population more vulnerable to heat
44 URBAN COOLING STRATEGY 2022 - 2052 WAGGA WAGGA CITY COUNCIL


45 URBAN COOLING STRATEGY 2022 - 2052 WAGGA WAGGA CITY COUNCIL
Figure 32: High resolution aerial photograph of Eunanoreenya (February 2021)
Figure 33: Land surface temp of Eunanoreenya taken from airborne thermal camera (February 2021)
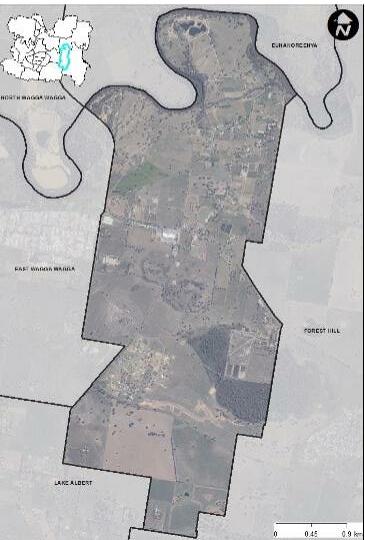
Forest Hill
4.7% Canopy cover
• Forest Hill covers an area of 4,257 ha with 199 ha of canopy cover
• Most of Forest Hill is rural land use (3,601 ha), containing 150 ha of canopy
• Most canopy is found adjacent to the Murrumbidgee River floodplain corridor on the northern suburb boundary and small pockets of remnant vegetation in areas not cleared for farming practices
• The residential area (121 ha) is divided into older housing to the eastern part of the residential area and expanding newer subdivisions to the west
• Central to Forest Hill is the Wagga Wagga Airport and RAAF Defence Base, both Special Activity land use areas
31.0°C Land surface temp
• Forest Hill showed the highest average temperature of the study area suburb at 31.0°C
• Large areas of tilled paddocks across the entire suburb contributes to higher temperatures, as does the large hard stand areas found at the airport and RAAF base
• The time of year the imagery was taken may influence temperatures for Forest Hill due to cropping schedules
Forest Hill SEIFA: 1046
Priorities
UCS6
UCS15
UCS16
UCS17
UCS18
UCS19
UCS21
UCS22
46 URBAN COOLING STRATEGY 2022 - 2052 WAGGA WAGGA CITY COUNCIL
890
3,081
homes 14% of population more vulnerable to heat
people
•
•
•
•
•
•
•
•
•
•
•
•
•
•
•
•
• UCS1
UCS7
UCS8
UCS9
UCS10
UCS11
UCS12
UCS14
UCS20
Figure


47 URBAN COOLING STRATEGY 2022 - 2052 WAGGA WAGGA CITY COUNCIL
Figure 34: High resolution aerial photograph of Forest Hill (February 2021)
35: Land surface temp of Forest Hill taken from airborne thermal camera (February 2021)
Glenfield Park
7.2% Canopy cover
• Glenfield Park covers an area of 297 ha with 21 ha of canopy cover
• The suburb is made up of mostly residential land use (157 ha) containing 8 ha of canopy
• The 45 ha of public recreation reserves and corridors found throughout the suburb contain mostly remnant vegetation
• In Glenfield Park, 18% of the land area is classified as road reserve with canopy cover of 4 ha 30.4°C Land surface temp
• Glenfield Park recorded the second highest average temperature of the study area suburbs
• Temperature hotspots exist at the central shopping centre and the industrial area
• Newer housing to the west may have higher than average temperatures due to immaturity of tree plantings, in comparison to older housing in the east.
UCS1
UCS6
UCS7
UCS14
UCS15
48 URBAN COOLING STRATEGY 2022 - 2052 WAGGA WAGGA CITY COUNCIL
2,123 homes 23% of population more vulnerable to
5,078 people
•
•
•
•
•
•
•
•
•
•
•
•
•
•
heat
Priorities Glenfield Park SEIFA: 1004
UCS8
UCS9
UCS10
UCS11
UCS12
UCS16
UCS18
UCS19
UCS22


49 URBAN COOLING STRATEGY 2022 - 2052 WAGGA WAGGA CITY COUNCIL
Figure 36: High resolution aerial photograph of Glenfield Park (February 2021)
Figure 37: Land surface temp of Glenfield Park taken from airborne thermal camera (February 2021)
Gobbagombalin
6.2% Canopy cover
• Gobbagombalin covers an area of 3,941 ha with 243 ha of canopy cover
• The majority of the suburb is rural farmland with most canopy cover (163 ha) in the form of remnant vegetation and riverine floodplain vegetation located along the Murrumbidgee River
• Special Activity land use makes up 25% of Gobbagombalin in the form of agricultural research and educational facility land which contains 44 ha of canopy
• The suburb contains newly developed subdivisions (167 ha) with low canopy cover (currently 1 ha) due to immature age of trees planted
• Gobbagombalin has 162 ha classified as roadside reserve land use with 23 ha of canopy cover
29.3°C Land surface temp
• Gobbagombalin has a median temperature of 29.3ºC, on average for all suburbs
• Gobbagombalin’s temperature is influence by farming activities such as tilled paddocks and irrigated pastures
• Greater absorption of heat in darker coloured roofing materials causes higher median temperatures in the newly developed residential areas
50 URBAN COOLING STRATEGY 2022 - 2052 WAGGA WAGGA CITY COUNCIL
735 homes
2,184 people
•
•
•
•
•
•
•
•
•
•
•
•
19% of population more vulnerable to heat
Priorities Gobbagombalin SEIFA: 1071
UCS1
UCS6
UCS7
UCS8
UCS9
UCS11
UCS12
UCS14
UCS15
UCS16
UCS19
UCS22


51 URBAN COOLING STRATEGY 2022 - 2052 WAGGA WAGGA CITY COUNCIL
Figure 38: High resolution aerial photograph of Gobbagombalin (February 2021)
Figure 39: Land surface temp of Gobbagombalin taken from airborne thermal camera (February 2021)
Gumly Gumly
6.1% Canopy cover
• Gumly Gumly covers and area of 1,237 ha with 75 ha of canopy cover
• Greatest land use in Gumly Gumly is rural (855 ha), with most canopy cover remnant vegetation not cleared for farming practices and riverine corridors along the Murrumbidgee River
• An area designated for existing and future large lot residential (207 ha) contains 13 ha of canopy, with public recreation area (57 ha) containing 6 ha of canopy
• A commercial land use corridor (42 ha) adjacent to the Sturt Highway contains 1 ha of canopy cover
30.3°C Land surface temp
• Gumly Gumly showed the third highest average temperature of the study area
• Large areas of tilled paddocks across the entire suburb contributes to higher temperatures
• Pockets of irrigated crops and pasture of cooler temperatures are shown mainly in the north
• A large wetland to the SE produces cooler conditions as does the riverine floodplain corridor
• Hotspots can be seen on land recently cleared for housing
Gumly Gumly SEIFA: 1071
Priorities
450 people
• UCS7 • UCS8 • UCS9 • UCS15 • UCS16 • UCS18 • UCS22
• The time of year the imagery was taken may influence temperatures due to cropping schedules 142 homes 21% of population more vulnerable to heat
52 URBAN COOLING STRATEGY 2022 - 2052 WAGGA WAGGA CITY COUNCIL

53 URBAN COOLING STRATEGY 2022 - 2052 WAGGA WAGGA CITY COUNCIL
Figure 40: High resolution aerial photograph of Gumly Gumly (February 2021)
Figure 41: Land surface temp of Gumly Gumly taken from airborne thermal camera (February 2021)
Hillgrove
2.1% Canopy cover
• Hillgrove has a total area of 544 ha containing 11 ha of total canopy cover, one of the lowest canopy cover rates of all the suburbs (57% of Hillgrove are non-vegetated surfaces)
• The suburb contains rural land use, with majority of the suburb cleared for farming practices, with small pockets of remnant trees and paddock boundary corridors left to provide canopy.
• Hillgrove has a small roadside reserve area of 1% (7 ha of total suburb area) containing 1 ha of canopy cover.
29.7°C Land surface temp
• Higher temperatures exist in Hillgrove due to large areas of tilled paddocks exposing bare earth prepared for farming practices
• Untilled paddocks show cooler temperatures compared to recently ploughed earth
• The time of year the imagery was taken may influence temperatures due to cropping schedules
54 URBAN COOLING STRATEGY 2022 - 2052 WAGGA WAGGA CITY COUNCIL
17
30
homes 0% of population more vulnerable to heat
people Priorities Hillgrove SEIFA: 1052 • UCS1 • UCS7 • UCS9 • UCS20


55 URBAN COOLING STRATEGY 2022 - 2052 WAGGA WAGGA CITY COUNCIL
Figure 42: High resolution aerial photograph of Hillgrove (February 2021)
Figure 43: Land surface temp of Hillgrove taken from airborne thermal camera (February 2021)
Kapooka
14.4% Canopy cover
• Kapooka covers an area of 1,982 ha with 285 ha of canopy cover, one of the highest canopy cover rates of all the suburbs
• Much of Kapooka (1291 ha) is zoned as Special Activity containing 226 ha of canopy.
• The high rates of canopy cover are due to large areas of remnant vegetation used for army training purposes
• 70 ha of council roadside reserves contains 18 ha of canopy cover which achieves a very healthy 25% canopy cover rate
• Rural land use (556 ha) contains 32 ha of canopy and Environmental Conservation area (66 ha) contains 9 ha of canopy
27.3°C Land surface temp
• Kapooka has the lowest average temperature of the study area suburb at 27.3°C
• This low temperature is a reflection of the high canopy cover rate in the suburb
56 URBAN COOLING STRATEGY 2022 - 2052 WAGGA WAGGA CITY COUNCIL
51 homes
more vulnerable
395 people
Kapooka SEIFA: 1052 •
•
•
•
•
•
•
•
•
11% of population
to heat
Priorities
UCS7
UCS8
UCS9
UCS10
UCS11
UCS15
UCS16
UCS20
UCS22


57 URBAN COOLING STRATEGY 2022 - 2052 WAGGA WAGGA CITY COUNCIL
Figure 44: High resolution aerial photograph of Kapooka (February 2021)
Figure 45: Land surface temp of Kapooka taken from airborne thermal camera (February 2021)
Kooringal
12.0% Canopy cover
• Kooringal covers an area of 477 ha with 57 ha of canopy cover
• The suburb contains a majority of older residential area (253 ha) with higher levels of canopy due to maturity of tree plantings (30 ha)
• Kooringal has 19% of the land area is classified as road reserve with canopy cover of 11 ha
• A ridge of remnant vegetation exists on the south west boundary of the suburb (Willan’s Hill) and to the north (Rocky Hill)
• Parkland contributes to this public recreation area (77 ha) containing 12 ha of canopy in Kooringal
29.0°C Land surface temp
• Kooringal has a median temperature of 29.0ºC
• Hotspots areas include large surface areas of low reflectivity roofing of schools and medium density housing as well bare earth land such as some public recreational reserves, the War Memorial Cemetery and detention basins
• The eastern side of Rocky Hill due to shallow soils reveals hotter than average temperatures for the suburb
Priorities
58 URBAN COOLING STRATEGY 2022 - 2052 WAGGA WAGGA CITY COUNCIL
3,170 homes 24% of population more vulnerable to heat 7,404 people
Kooringal SEIFA: 1052 • UCS6 • UCS7 • UCS8 • UCS9 • UCS10 • UCS11 • UCS14 • UCS15 • UCS16 • UCS18 • UCS19 • UCS20 • UCS22


59 URBAN COOLING STRATEGY 2022 - 2052 WAGGA WAGGA CITY COUNCIL
Figure 46: High resolution aerial photograph of Kooringal (February 2021)
Figure 47: Land surface temp of Kooringal taken from airborne thermal camera (February 2021)
Lake Albert
11.5% Canopy cover
• Lake Albert covers an area of 2,469 ha with 283 ha of canopy cover
• General and large lot residential (1067 ha) contains almost half of the canopy (132 ha)
• Older residential areas have higher levels of canopy due to the maturity of tree plantings
• Rural land use area contains 61 ha of canopy over 823 ha
• Lake Albert has 8% of the land area is classified as road reserve with canopy cover of 32 ha
• Lake Albert has 179 ha of public recreation area containing 49 ha of canopy cover in public open space areas
28.4°C Land surface temp
• Lake Albert has a median temperature of 28.4ºC, cooler than average LST for all suburbs
• Most of the warmer temperatures in Lake Albert come from the farming practices of the small lot rural land uses
• Cooler areas are shown in the remnant vegetation corridors of public open space such as Rawlings Park and linked reserves and remnant vegetation of large lots residential in the south western corner, including the golf club
• The water body of Lake Albert and its foreshores contributes to cooler overall temperatures
Lake Albert SEIFA: 1052
Priorities
UCS1
UCS6
UCS7
UCS8
UCS9
UCS10
UCS11
UCS12
UCS13
UCS14
UCS15
UCS16
UCS18
UCS19
UCS22
60 URBAN COOLING STRATEGY 2022 - 2052 WAGGA WAGGA CITY COUNCIL
6,291
2,446 homes 25% of population more vulnerable to heat
people
•
•
•
•
•
•
•
•
•
•
•
•
•
•
•


61 URBAN COOLING STRATEGY 2022 - 2052 WAGGA WAGGA CITY COUNCIL
Figure 48: High resolution aerial photograph of Lake Albert (February 2021)
Figure 49: Land surface temp of Lake Albert taken from airborne thermal camera (February 2021)
6.8% Canopy cover
• Lloyd covers an area of 506 ha with 34 ha of canopy cover
• Lloyd has an increasing area of new subdivisions in residential zones (191 ha), with canopy cover of 3 ha that is mainly in the north eastern corner of the suburb
• Most canopy in Lloyd is contained where remnant vegetation still exists, that is the Environmental Conservation area (24 ha canopy) and rural areas (3 ha of canopy) yet to be cleared for development
• The roadside reserve area of 57 ha contains 2 ha canopy, the lowest total proportion of canopy cover in roadside areas across all suburbs partly due to immature plantings
• Lloyd West has control plans limiting impervious surfaces, with high artificial turf use
29.4°C Land surface temp
• Lloyd overall shows areas of high temperatures in areas cleared or recently cleared to make way for new subdivisions
• The older residential area to the north west is slightly cooler due to maturity of tree plantings
• Much of the cooler areas of Lloyd exist where remnant vegetation still exists, either in the Environmental Conservation areas and rural areas yet to be cleared for development
Priorities
UCS7
UCS15
UCS16
62 URBAN COOLING STRATEGY 2022 - 2052 WAGGA WAGGA CITY COUNCIL
Lloyd
575
1,509
homes 18% of population more vulnerable to heat
people
•
•
•
•
•
•
•
•
•
Lloyd SEIFA: 1119 • UCS1 • UCS6
UCS8
UCS9
UCS11
UCS12
UCS13 • UCS14
UCS19 • UCS22


63 URBAN COOLING STRATEGY 2022 - 2052 WAGGA WAGGA CITY COUNCIL
Figure 50: High resolution aerial photograph of Lloyd (February 2021)
Figure 51: Land surface temp of Lloyd taken from airborne thermal camera (February 2021)
Moorong
16% Canopy cover
• Moorong covers an area of 1,858 ha with 297 ha of canopy cover
• Moorong has the greatest canopy cover as a proportion of total suburb area and is bounded in the north by the Murrumbidgee River, the riparian vegetation which contributes to canopy
• Environmental Conservation land use areas (177 ha) and rural areas (1088 ha) contain a high proportion 57 ha and 111 ha of canopy respectively
• Public recreation land use areas (317 ha) including Pomingalarna Reserve and Wagga City Golf Course contribute 80 ha of canopy
• Residential land use (93 ha) contains 12 ha of canopy
27.8°C Land surface temp
• Moorong revealed to be one of the coolest suburbs in terms of median temperature (27.8ºC)
• Moorong had the highest proportional canopy of all the suburbs within the study area, driving the low median temperature
• The suburb contains a small amount of large residential blocks and only a small amount of light industrial area
Moorong SEIFA: 999
Priorities
64 URBAN COOLING STRATEGY 2022 - 2052 WAGGA WAGGA CITY COUNCIL
Lorem ipsum
52
175
homes 11% of population more vulnerable to heat
people
• UCS7 • UCS8 •
•
•
•
UCS9
UCS17
UCS18
UCS22


65 URBAN COOLING STRATEGY 2022 - 2052 WAGGA WAGGA CITY COUNCIL
Figure 52: High resolution aerial photograph of Moorong (February 2021)
Figure 53: Land surface temp of Moorong taken from airborne thermal camera (February 2021)
Mount Austin
15.3% Canopy cover
• Mount Austin covers an area of 263 ha with 40 ha of canopy cover
• A mix of residential (126 ha containing 12 ha of canopy) and public recreation land use (80 ha) characterises the suburb
• Public recreation, including the large area of remnant vegetation of Willian’s Hill reserve makes up 22 ha of canopy cover in Mount Austin
• Roadside reserves (56 ha) contain 7 ha of canopy cover which is relatively high due to suburb containing mature roadside tree plantings
28.3°C Land surface temp
• Mount Austin has a relatively high canopy within the study area, a likely driving factor behind the lower temperatures of the suburb
• Hotspots are mainly found in the western half of the suburb where medium density housing, aged care facility and nursing home are located
• Cooler areas can clearly be seen over remnant vegetation areas and irrigated sports ovals
66 URBAN COOLING STRATEGY 2022 - 2052 WAGGA WAGGA CITY COUNCIL
1,704 homes 29% of population more vulnerable to heat 4,035 people
Mount Austin SEIFA: 841 •
•
•
•
•
•
•
•
•
•
•
•
•
Priorities
UCS6
UCS7
UCS8
UCS9
UCS10
UCS11
UCS12
UCS14
UCS15
UCS16
UCS17
UCS19
UCS22

67 URBAN COOLING STRATEGY 2022 - 2052 WAGGA WAGGA CITY COUNCIL
Figure 54: High resolution aerial photograph of Mount Austin (February 2021)
Figure 55: Land surface temp of Mount Austin taken from airborne thermal camera (February 2021)
North Wagga Wagga
9.7% Canopy cover
• North Wagga Wagga covers an area of 1,838 ha with 179 ha of canopy cover
• Most of the land use in North Wagga Wagga is rural land use containing 119 ha canopy
• The majority of canopy cover is located along the Murrumbidgee River floodplain and as remnant vegetation located in the rural areas
• 135 ha of North Wagga Wagga’s total area is roadside reserve, containing 15 ha of total canopy cover with small to large residential lots contains 6 ha of canopy cover
29.6°C Land surface temp
• North Wagga Wagga showed an above average temperature of the study area at 29.6°C.
• Large areas of bare earth and recently tilled paddocks across North Wagga Wagga contributed to higher temperatures
• Pockets of irrigated crops and pasture contribute to cooler temperatures mainly in the southern part of the suburb close to the river, as well as floodplain vegetation and sand and gravel quarry storage ponds
North Wagga SEIFA: 1054 • UCS6
Priorities
UCS7
UCS8
UCS9
UCS10
UCS11
UCS15
UCS16
UCS17
UCS19 • UCS22
679 people
UCS12
• The time of year the imagery was taken may influence temperatures for North Wagga Wagga due to cropping schedules 262 homes 19% of population more vulnerable to heat
UCS14
68 URBAN COOLING STRATEGY 2022 - 2052 WAGGA WAGGA CITY COUNCIL
•
•
•
•
•
•
•
•
•
•
•


69 URBAN COOLING STRATEGY 2022 - 2052 WAGGA WAGGA CITY COUNCIL
Figure 56: High resolution aerial photograph of North Wagga Wagga (February 2021)
Figure 57: Land surface temp of North Wagga Wagga taken from airborne thermal camera (February 2021)
San Isidore
12.7% Canopy cover
• San Isidore covers an area of 498 ha with 63 ha of canopy cover
• The suburb contains mostly large lot residential (415 ha) containing 45 ha of canopy and rural land use (37 ha) containing 9 ha of canopy
• Most of the San Isidore’s large lot residential area is older with higher levels of canopy due to maturity of tree plantings
• A large area of remnant vegetation is present in a primary production area in the north eastern corner of the suburb as well as roadside vegetation adjacent to the Sturt Highway corridor
• San Isidore has one of the highest rates of vegetation cover as a proportion of the total suburb area at 70%
28.4°C Land surface temp
• San Isidore has a median temperature of 28.4ºC, cooler than average temperatures for all suburbs
• Most of the higher temperature areas in San Isidore come from small scale farming practices of tilled paddocks
• Cooler areas are shown in areas of remnant vegetation and paddock boundary corridors of large lot residential areas
• Water storages along natural drainage lines are also present as cooler temperatures
San Isidore SEIFA: 995
Priorities
349 people
118 homes 20% of population more vulnerable to heat
• UCS7 • UCS8 • UCS9 • UCS11 • UCS15 • UCS16 • UCS18 • UCS22
70 URBAN COOLING STRATEGY 2022 - 2052 WAGGA WAGGA CITY COUNCIL


71 URBAN COOLING STRATEGY 2022 - 2052 WAGGA WAGGA CITY COUNCIL
Figure 58: High resolution aerial photograph of San Isidore (February 2021)
Figure 59: Land surface temp of San Isidore taken from airborne thermal camera (February 2021)
Springvale
10.9% Canopy cover
• Springvale includes Glenoak, and covers an area of 1,198 ha with 130 ha of canopy
• The suburb contains majority large lot residential (727 ha) containing 83 ha of canopy cover, rural (325 ha) containing 29 ha of canopy cover and environmental conservation (53 ha) containing 12 ha of canopy cover
• Remnant vegetation exists on the ridgeline to the north of the suburb and corridors adjacent to natural drainage lines
• Springvale has 7% of the land area is classified as road reserve with canopy cover of 5 ha, making it one of the lowest rate canopy cover in roadside reserves as a proportion of total vegetation
27.8°C Land surface temp
• Springvale has one of the lowest median temperatures of all suburbs at 27.8ºC
• This low temperature can be attributed to low rates of non-vegetated surfaces across the suburb and above average rates of canopy cover
• Cooler areas can be seen across the suburb, especially in the north and eastern parts of the suburb, due to lot boundary tree plantings, turf, and some remnant vegetation
Priorities
• UCS7 • UCS8 • UCS9 • UCS11 • UCS16 • UCS22
72 URBAN COOLING STRATEGY 2022 - 2052 WAGGA WAGGA CITY COUNCIL
1,851
548 homes 13% of population more vulnerable to heat
people
Springvale SEIFA: 1119


73 URBAN COOLING STRATEGY 2022 - 2052 WAGGA WAGGA CITY COUNCIL
Figure 60: High resolution aerial photograph of Springvale (February 2021)
Figure 61: Land surface temp of Springvale taken from airborne thermal camera (February 2021)
Tatton
10.8% Canopy cover
• Tatton covers an area of 178 ha with 19 ha of canopy cover
• The older areas have more canopy cover with more mature tree than the newer areas
• Tatton is mostly made up of residential land use (109 ha) with 8 ha of canopy cover
• Environmental conservation land use (27 ha) of ridgeline remnant vegetation on Willian’s Hill reserve contributes 7 ha of canopy cover
• Roadside reserve makes up 30 ha (17% of the total area) and contains 2 ha of canopy
• Public recreation (12 ha) contains 2 ha of canopy cover
29.5°C Land surface temp
• Tatton has an above average temperature of 29.5 ºC when compared to all suburbs
• Hotspots are spread across Tatton due to lower reflectance roofing materials
• Higher temperatures from low roadside reserve canopy cover may also be a factor in Tatton especially in the newer areas to the south
UCS9
UCS10
74 URBAN COOLING STRATEGY 2022 - 2052 WAGGA WAGGA CITY COUNCIL
918 homes
2,560 people
•
•
•
•
21% of population more vulnerable to heat
Priorities Tatton SEIFA: 1091 • UCS6
UCS7 • UCS8
UCS11 • UCS12 • UCS14 • UCS15 • UCS16 • UCS17 • UCS18 • UCS19 • UCS22


75 URBAN COOLING STRATEGY 2022 - 2052 WAGGA WAGGA CITY COUNCIL
Figure 62: High resolution aerial photograph of Tatton (February 2021)
Figure 63: Land surface temp of Tatton taken from airborne thermal camera (February 2021)
Tolland
• Tolland covers an area of 205 ha with 24 ha of canopy cover
• Most of Tolland is made up of low and medium density residential land covering 121 ha with 12 ha of canopy
• Public recreation areas including Willans Hill and Kunming Grove, contribute 33 ha of canopy in Tolland
• Roadside reserve makes up 47 ha of Tolland and contains 5 ha of canopy cover
• Tolland has an average temperature of 28.8ºC which aligns with overall city average
• Hotspots centre around hard stand surfaces of the local shopping centre, arterial roadside reserves such as Bruce St, Glenfield Rd and Bourke St, as well as large public recreational areas
• Cooler temperatures can be seen over remnant vegetation and residential areas of Willian’s Hill
76 URBAN COOLING STRATEGY 2022 - 2052 WAGGA WAGGA CITY COUNCIL
11.8% Canopy cover
28.8°C Land surface temp
1,406 homes 26% of
more vulnerable
3,459 people
Tolland
848 •
•
•
•
•
•
•
•
•
•
•
•
•
•
population
to heat
Priorities
SEIFA:
UCS6
UCS7
UCS8
UCS9
UCS10
UCS11
UCS12
UCS14
UCS15
UCS16
UCS17
UCS18
UCS19
UCS22


77 URBAN COOLING STRATEGY 2022 - 2052 WAGGA WAGGA CITY COUNCIL
Figure 64: High resolution aerial photograph of Tolland (February 2021)
Figure 65: Land surface temp of Tolland taken from airborne thermal camera (February 2021)
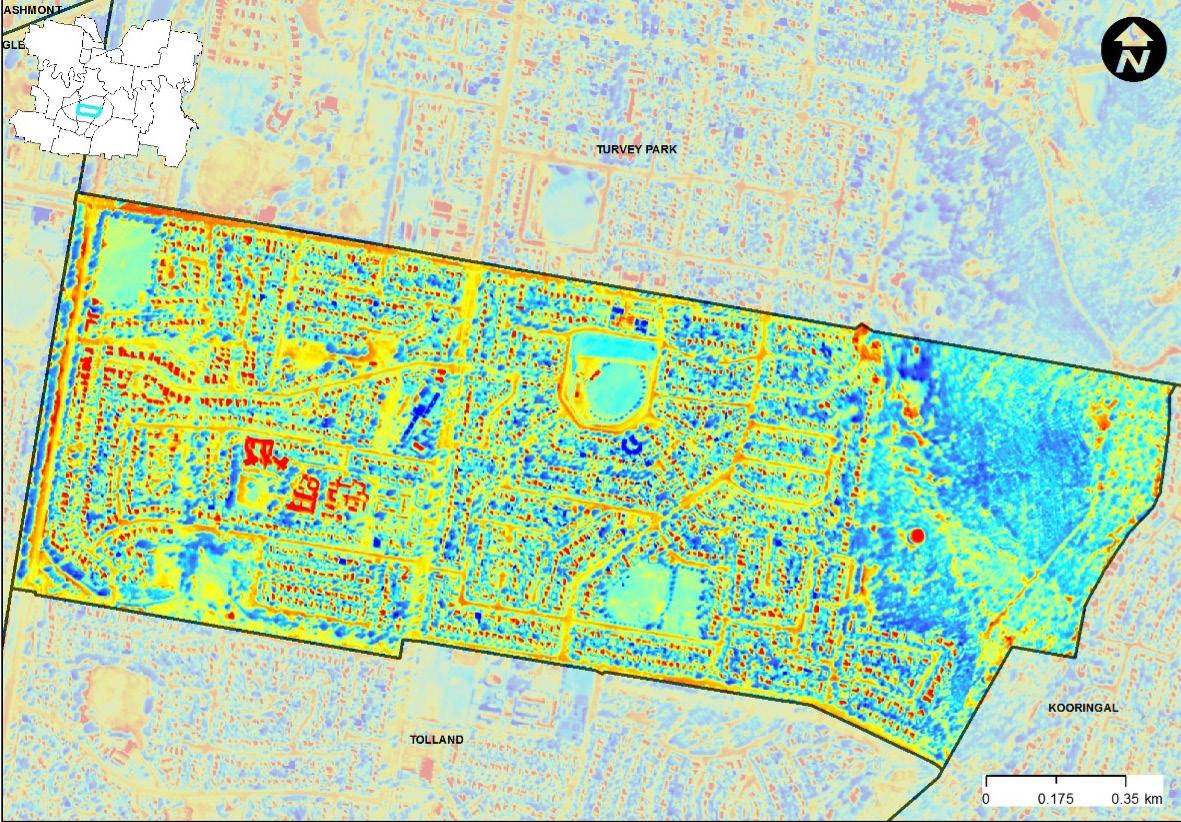
Turvey Park
15.6% Canopy cover
• Turvey Park covers an area of 376 ha with 59ha of canopy cover, one of the highest levels of canopy cover of all suburbs
• Turvey Park is a mix of older residential (158 ha containing 20 ha of canopy cover), public recreation and special activity (educational facility, correctional centre) land uses
• Public recreation (80 ha), including the large area of remnant vegetation of Willian’s Hill reserve and Wagga Wagga Botanical Gardens on the eastern side of the suburb, make up 22 ha of canopy cover
• Roadside reserve makes up 74 ha (20% of the total area) of Turvey Park containing 11 ha of canopy cover, relatively high due to majority of the suburb containing mature roadside tree plantings
28.9°C Land surface temp
• Cooler areas are found in central and eastern parts of the suburbs due to remnant vegetation of Willan’s Hill reserve and older residential housing containing mature tree plantings on roadsides and within established residential gardens
• Hotspots are found in large areas west of Bourke St including a new residential subdivision, Wagga Wagga Showgrounds, a correctional facility and an educational facility containing carparks and buildings
78 URBAN COOLING STRATEGY 2022 - 2052 WAGGA WAGGA CITY COUNCIL
1,487 homes 19% of
more
3,572 people
•
•
•
•
•
•
•
•
•
•
•
•
•
•
population
vulnerable to heat
Priorities Turvey Park SEIFA: 1025
UCS6
UCS7
UCS8
UCS9
UCS10
UCS11
UCS13
UCS14
UCS15
UCS16
UCS17
UCS18
UCS19
UCS22


79 URBAN COOLING STRATEGY 2022 - 2052 WAGGA WAGGA CITY COUNCIL
Figure 66: High resolution aerial photograph of Turvey Park (February 2021)
Figure 67: Land surface temp of Turvey Park taken from airborne thermal camera (February 2021)
Wagga Wagga
12.2% Canopy cover
• Wagga Wagga (Central) covers an area of 887 ha with 108 ha of canopy cover
• Contains the CBD (89 ha containing 2 ha of canopy cover), residential (229 ha: 21 ha), public open space (119 ha: 32 ha) and private recreation (76 ha: 3 ha), industrial (38ha: 1 ha), environmental conservation (19 ha: 5 ha) and special activity zones (hospitals, sewerage treatment plant, major highways) (71 ha: 10 ha)
• Public recreation includes vegetation along the Murrumbidgee River and the Murrumbidgee Turf Club and a pitch and putt golf facility
• Roadside reserve makes up 192 ha (22% of the total area) of Central WW containing 26 ha of canopy cover, relatively high proportion of canopy cover due to majority of the suburb containing mature roadside tree plantings
28.8°C Land surface temp
• Hotspots exist in the industrial areas and in non-irrigated areas of the golf driving range and Murrumbidgee Turf Club
• Lots cleared for medium density housing in Kincaid and Spring St, as well as site remediation following industrial land use in Chaston St also appear as warmer areas
• Wide roadside reserves with high temperatures include Kincaid St, Chaston St, Shaw St, Albury St, Small St, Day St, Murray St and Fitzhardinge St
• Cooler spots are located in areas adjacent to the Murrumbidgee River, Wollundry Lagoon, irrigated parks, reserves and sporting ovals and older residential housing areas containing mature trees on roadsides and in residential gardens
Wagga Wagga SEIFA: 1000
Priorities
UCS7
UCS8
UCS9
UCS10
UCS11
UCS14
UCS15
UCS16
UCS17
UCS18
UCS19
UCS20
UCS21
UCS22
UCS24
80 URBAN COOLING STRATEGY 2022 - 2052 WAGGA WAGGA CITY COUNCIL
3,704 homes 25% of
7,198 people
population more vulnerable to heat
•
•
•
•
•
•
•
•
•
•
•
•
•
•
•
• UCS6
Figure 68: High resolution aerial photograph of Central Wagga Wagga (February 2021)

Figure 69: Land surface temp of Central Wagga Wagga taken from airborne thermal camera (February 2021)

81 URBAN COOLING STRATEGY 2022 - 2052 WAGGA WAGGA CITY COUNCIL
Cooling Mechanisms
This section outlines opportunities to increase canopy cover and reduce urban heat island effects across the study area.
82 URBAN COOLING STRATEGY 2022 - 2052 WAGGA WAGGA CITY COUNCIL
Cool by design
As our population grows there is a need to decrease the size of lots in new developments. This means that an increased emphasis must be placed on street design and landscaping to provide green cover and utilise the existing green and blue infrastructure (vegetation and water) within the landscape.
The Urban Heat Planning Toolkit (McAuley, 2021) details the planning principles and approaches to build more resilient neighbourhoods. Some of these include:
Increasing green cover: Vegetation reduces heat by increasing evapotranspiration and shading adjacent surfaces. This is a major focus area for good urban design.
Artificial shade: Where provision of shade through vegetation (trees) cannot be practically achieved artificial shade structures should be considered. Depending on the location this could be shade in the form of shade sails, bus shelters, awnings, pergolas etc. While they do not have the same additional benefits of vegetation, they still provide effective shelter from the sun.
Using cool materials: Roofing, wall and paving materials with greater reflectance, less capacity to store heat, such as concrete and tiles which have a high thermal mass. Cool paving has high albedo (high solar reflectance) and/or high thermal emittance (which releases heat quickly) and is useful where there is limited opportunity to establish canopy cover. Cool paving also has the potential to cause glare and is not suitable where glare could be problematic for vehicles and pedestrians.
Minimising impervious surfaces: Impermeable surfaces capture and store heat and take a long time to cool down. Permeable pavements, on the other hand, can reduce an area’s heat sink, allowing it to cool off more quickly. Porous paving allows water to drain through naturally, cooling the pavement. Additional cooling takes place when the absorbed water evaporates back up through the voids in the paving (called the wicking effect) with the evaporating moisture continuing to cool the surrounding air. In areas prone to urban salinity this must be carefully considered. A lighter coloured pavement is recommended as more heat is reflected back, reducing radiation from the surface.
Using water in the landscape: Water can be used to increase evapotranspiration. This could include water features and irrigated vegetation. Vegetation with access to water can evapotranspire and reduce heat more effectively. Local provisions for water sensitive urban design can be improved to include a greater emphasis on reducing runoff and retaining water in the landscape. This could include harvesting rainwater and stormwater as a sustainable supply for irrigation, filtering and storing runoff in vegetated stormwater treatment systems, and encouraging infiltration (where appropriate) by including wetlands and rain gardens in the landscape.
Artificial water features: Where there is no opportunity to utilise natural water, other options can be considered to help to alleviate urban heat related issues in public spaces. This can include things such as fountains, splash parks, water misting stations and of course drink bubblers. Often this infrastructure can be expensive to install and maintain.
83 URBAN COOLING STRATEGY 2022 - 2052 WAGGA WAGGA CITY COUNCIL
Cooling mechanisms
Cooler roofs
Roof colour
In 2021, the NSW government announced lighter coloured roofs will be a mandatory part of the planning controls for a major growth area in south western Sydney, in an effort to reduce the urban heat island effect in new subdivisions.

There are also several alternative roofing materials that are cooler than traditional roofs such as reflective roof tiles, light coloured metal roofing and cool membranes. Cooler roofing designs tend to stay within 6 - 11°C of air temperature, unlike many traditional roofs that can be 30 - 45°C hotter than air temperatures (US, EPA, 2008).
Cooler roofing design will reduce internal temperature of the building, reducing air conditioning energy costs in the summer months. Lower surface temperatures of the roof will also decrease the urban heat effect of the area. Cool roofs are designed to increase reflection of sunlight while maintaining the aesthetic of more traditional non-white roofs. Figure 70 shows the difference roof colour can make. Retrofitting of existing roofs should be encouraged, though it can be costly.
Solar panels
Apart from the economic and environmental cost benefit of renewable solar energy, studies have shown that shading large areas of heat-absorbing roofing materials with solar panels also has the benefit of reducing the temperature of the building below. Solar panels absorb solar energy to produce energy usable in buildings, either directly in the form of heat or as electricity. In doing so, they modify the energy balance of the urban surface in contact with the atmosphere and change the radiation received by the roof. Separate studies by Dominguez (2011) and Masson (2014) showed that a large deployment of solar panels in metropolitan areas, in shading the roof, can reduce the energy needed for air-conditioning by 12-38% during summer months and also lead to a reduction in the urban heat island effect.
84 URBAN COOLING STRATEGY 2022 - 2052 WAGGA WAGGA CITY COUNCIL
Figure 70: Comparison in solar reflectance and emissivity between roofing colour and design in Gobbagombalin. Darker colour roofing retaining higher radiant heat (red) than lighter colour roofing (green/yellow).
Green roofs and walls

The ‘NSW Urban Green Cover Technical Guidelines’ (OEH, 2015) provides best practice applications of urban green cover in a built environment to minimise urban heat impacts. The guidelines include practical information for Local and State Government planning on implementing green cover, in consultation with urban design and engineering professionals. This information can also be used by local government for integration into strategic plans, development controls to influence development outcomes in a local government area. This includes provisions for:
Green roofs: Vegetated roofs constructed on the concrete or metal roof deck. Research in Adelaide shows that a 300mm vegetated profile reduces roof surface temperature by 41% in summer (Hopkins & Goodwin 2012).
Green facades: A green facade is a system that mimics the self-clinging plant but uses a trellis system of either cables or mesh to support the climbing plant off the building surface. Modular systems can be secured to, or integrated into, the design of the building facade. Green facades can cool the surface of the façade by 8°C (Hopkins et al. 2012 (b)).
Green walls: These systems can be constructed from pre-vegetated panels that hold growing media to support the plant material or planted blankets with planting pockets filled with plants and growing media. These systems are fixed to a structural framework or to a wall. Research has shown a green wall can reduce the surface of the wall temperature by 9°C and air temperature by 4-5°C (Hopkins & Goodwin 2011).
85 URBAN COOLING STRATEGY 2022 - 2052 WAGGA WAGGA CITY COUNCIL
Figure 71: Urban green cover examples as shown in cool green rooftops (left) and a green façade in an urban setting (right). Photos: iStock
Cooling mechanisms
Increasing the urban canopy
There are opportunities across the entire urban area to increase canopy cover. While new developments will be subject to best practice urban design principles, there are also a great number of existing areas with poor canopy coverage that needs to be bolstered. Therefore, the discussion below focuses predominantly on existing urban areas.
The primary characteristic to achieve urban cooling is of course maximising the selection of large ‘canopy-creating’ trees that will grow to the maximum height and width practical for the space. As an example, planting a species that will grow to 6m in height and produce a canopy of up to 30m2 should not be selected if a species that grows to 10m in height and produces a canopy of up to 80m2 can fit in that location. Even if two of the 6m trees are planted, they still will not achieve the same canopy coverage and shading as the one 10m tree.


86 URBAN COOLING STRATEGY 2022 - 2052 WAGGA WAGGA CITY COUNCIL
Figure 72: an example of the canopy cover produced from a mature ornamental pear (left) and a mature urbanite ash (right).
The right tree in the right place
There is no such thing as the perfect tree that suits every scenario.
Above ground and below ground site conditions can sometimes change significantly within the space of a few metres. Tree planting plans need to consider the constraints and needs of a specific site to determine what the most important features are.
This may include things such as selecting a species that is:
• Drought tolerant: Trees planted in an unmanaged reserve or natural area will generally not be watered after planting and need to be able to cope with our hot, dry summers.
• Fire retardant: Trees planted in bushland that abuts urban areas need to be carefully selected to not add excessively to fire risk for adjacent properties.
• Low pollen: In areas of high activity such as schools, playgrounds and sportsgrounds relatively allergy friendly and asthma friendly species should be given preference.
• Infrastructure friendly: Trees in urban settings are often planted close to footpaths, houses, overhead powerlines and underground services. Species selection needs to consider the root and branch structure of the tree and any likely issues once the tree reaches maturity. This may also include over-shadowing of solar panels.
• Solar access: While we have very hot summers, we still experience cold winters, and being able to utilise the winter sun is highly beneficial. Selecting deciduous trees (trees that lose their leaves in the colder months) for planting on north-facing aspects of properties allows winter warming in addition to summer cooling.
87 URBAN COOLING STRATEGY 2022 - 2052 WAGGA WAGGA CITY COUNCIL
Deciduous tree blocks sun to keep house cool in winter
Deciduous tree allows sun to warm house in winter
Figure 73: Deciduous trees can have seasonal benefits of providing summer shade and allowing exposure to winter sun.
Cooling mechanisms
Residential
The land zoned for residential purposes (excluding road reserves) represents by far the biggest portion of land use in the Wagga Wagga Urban Study Area. This represents the greatest opportunity for canopy increases, but also the most challenging as this falls under the purview of individual landholders to plant, not Council.
Therefore, raising awareness across the community on the cost benefits of tree shade on buildings, and the benefits of reducing reliance on air-conditioning on hot days is necessary. As trees block incoming solar radiation, they have the potential to reduce the energy requirement for artificial cooling of residential buildings as well as the associated heat-related health risk that is posed to occupants.
Council can implement campaigns similar to the ‘One Tree For Me’ tree planting to provide free seedlings that will grow to between 3-5m in height and be suitable for the majority of urban backyards.
Where residents are not the owner of the dwelling it can be difficult for them to act on increasing urban canopy cover. Council should advocate with agencies such as the Department of Housing to increase planting of climate ready tree species within government owned residential housing lots. Raising awareness of climate resilience through the increasing of canopy cover and reduction of urban heat islands could be a collaborative education program between State and Local government authorities.
Commercial and Industrial
Canopy cover proportions in commercial and industrial land use areas in Wagga Wagga are currently 2.9% and 1.9% respectively, the lowest of all land uses. Like residential, this land is under the control of individual landholders.
Council can encourage private landholders in commercial and industrial areas on the benefits of planting large canopy, climate resilient trees on boundary lot perimeters, particularly where underutilised large areas of land between public roadside reserve and the building footprint exist (see Figure 74 for a local example).
Strategically planted trees should ideally provide natural afternoon shade structure, reducing land surface temperatures on buildings and hard surfaces, lowering energy costs and providing amenity in areas of low canopy cover.
88 URBAN COOLING STRATEGY 2022 - 2052 WAGGA WAGGA CITY COUNCIL
Figure 74: Boundary planting of large canopy trees in East Wagga Wagga industrial area, avoiding overhead powerlines, otherwise preventing roadside reserve planting of large trees.
Car parks
Carparks are large hard stand heat sinks that are predominantly found in commercial and industrial areas and generate high levels of LST in the urban landscape (see Figure 75 for an example of a large suburban car park in Glenfield).

Requirements for shade in all new developments that have car parking shall be reviewed and increased. This shade could be in the form of trees or shade sails and should result in much cooler carparks in future. For existing carparks, this is more difficult and up to individual owners.
Roadside reserves
Council has control of roadside reserves and could look to increase the ratio of street tree plantings per house lot or by planting larger species. Plantings should be climate ready, emphasising larger canopy tree species to increase canopy cover in nature strips. This is particularly important in suburbs with low water use requirements because of salinity (such as Lloyd). Reducing urban heat effects from impervious surfaces such as roads and artificially turfed areas can be achieved through a denser canopy.
One limitation for increasing canopy in roadside reserves is the presence of overhead powerlines resulting in decreased canopy cover through lack of plantings and ongoing pruning. Priority plantings should be in suburbs where underground utilities exist, allowing for larger, higher density canopy plantings. Many new subdivisions fit this description as can be seen in Figure 76.
Promotion of water-wise landscaping for nature strips should also occur, especially where large canopy cannot be provided due to easement requirements for utilities and overhead powerlines.
In industrial areas containing low canopy cover (such as East Wagga Wagga), large lot frontages and wide road reserves can support more than the current tree density per lot.
Canopy figures for land use shows that a total of 11.8% of total roadside reserve area contained canopy cover. This means that all suburbs ultimately need more coverage, however suburbs below this proportion should be prioritised to increase canopy cover via additional plantings over the next 10 years.
89 URBAN COOLING STRATEGY 2022 - 2052 WAGGA WAGGA CITY COUNCIL
Figure 75: Mature tree canopy cover in car park shown as green (left) and blue in heat mapping (right).
Cooling mechanisms
Suburbs to prioritise for roadside plantings include:


• Ashmont
• Boorooma
• Bourkelands
• East Wagga Wagga
• Estella
• Forest Hill
• Gobbagombalin
• Lloyd
• Mount Austin
• Tatton
• Tolland
Traffic islands
Council can also investigate increasing existing canopy cover within traffic islands. This is not suitable in many settings, particularly where there is an established road and minimal corridor width.
When building new roads or reconstructing existing roads of significant width this option could be explored. Road temperature from the thermal imagery dataset taken on the image below range 35.6ºC in the unshaded road (Figure 77B) to 23.3ºC on the shaded roads section (Figure 77A).
Opportunities for central island large canopy tree plantings would also have a positive effect on the amenity of a street scape.
90 URBAN COOLING STRATEGY 2022 - 2052 WAGGA WAGGA CITY COUNCIL
Figure 76: Examples of high and low roadside reserve canopy plantings in Lloyd (left, A) and Kooringal (right, B)
Figure 77: Traffic island tree plantings such as those in Tatton (left), could be used to cool the urban heat islands of wide roadways such as Central Wagga Wagga (right).
Active travel paths
Opportunities exist for increase canopy plantings alongside the recently developed active travel paths (ATP) around Wagga suburbs. To encourage a healthier community and increase path usage in the warmer months, large native plantings should be located on the western or north western side of the paths in order to provide maximum shade from the hot afternoon sun. Active travel corridors between schools, shopping centres and open space recreation areas should be prioritised for selection. To be considered suitable, the road reserve area will need to be wide enough for the canopy plantings to go in aside the new ATP and still allow traffic flow and utilities to remain unaffected.

Bus stops
Bus stops throughout the urban area vary greatly. Some have a formal bus shelter; some have shade from trees and others have neither. Council should undertake an audit of all bus stop locations to identify which bus stops require shade. Shade at bus stops can enhance the thermal comfort of waiting bus users and can encourage new passengers, thereby reducing air pollution and traffic congestion.
Priority should be given to areas where reliance on public transport is high and based on busier (passenger number) bus routes, including school routes. Typically, neighbourhoods with a higher socio-economic disadvantage show higher reliance on public transport due to lower rates of households with access to a private vehicle.
Tree shading (or artificial cover) adjacent to bus stops ideally should be located on the western side of the bus stop to take advantage of shading from the afternoon sun. Canopy area should be large enough to provide shade for seating (if present) or to accommodate multiple passengers standing beneath the canopy comfortably (Figure 79).

91 URBAN COOLING STRATEGY 2022 - 2052 WAGGA WAGGA CITY COUNCIL
Figure 78: New active travel paths in Kooringal and Bourkelands (left, centre), with recent tree plantings on western side of path in Glenfield (right).
Figure 79: Good example of canopy coverage providing shade for bus stop in Mount Austin (right) and an exposed bus stop and seating in Tolland (left).
Cooling mechanisms
Public open space
Council has over 800ha of developed open space. Canopy figures for this land use shows that a total of 21.3% of POS area consisted of canopy cover. While there should be an assessment of all Council open space areas such as parks and sportsgrounds the suburbs below this proportion should be prioritised for large canopy plantings over the next few years. Council will review and revise elements the Wagga Wagga Recreation & Open Space Strategy and the Wagga Wagga Street Tree Strategy & Masterplan to develop an Urban Tree Management Plan
Suburbs containing no residential area and/or where the POS consists mainly of riparian or riverine reserves have been excluded. Priority suburbs for planting are shown below:
• Ashmont
• Boorooma
• Bourkelands
• East Wagga Wagga
• Estella
• Forest Hill
• Gobbagombalin
• Glenfield Park
• Lloyd
• Tatton
Within the broad category of open space there are several different focus areas that should be considered as a priority for planting.
Parks and sportsgrounds
Councils Recreation, Open Space and Community Strategy (ROSC) provides a comprehensive overview of Council’s recreational areas. Council owns and maintains over 100 developed parks in the open space network, including over 90 playgrounds and 65 sports facilities.
Parks in particular present an important opportunity to increase urban cooling. Radiant temperatures in urban parks are often 2-4C cooler than adjacent built up areas, and this can be even higher if there is a large percentage of canopy cover.
Council is conducting a shade audit of all parks and playgrounds and has set a benchmark of 40% shade for the playground area of each park in the LGA. Where trees are not a suitable option artificial shade solutions (shade sails) will be considered to ensure that playgrounds re safe and usable as temperatures increase over time.
Sportsgrounds also offer opportunities for Council to increase the urban canopy, however the actual area of fields/courts obviously cannot be planted. There will need to be careful site by site planning to determine where trees can go to maximise shade for spectators and participants without impacting on the playing surface and its maintenance.
Detention basins
Council owns and maintains a large number of detention basins to manage urban stormwater. Traditionally these are largely void of any canopy to allow ease of maintenance and uninhibited water flow- though many now house small playgrounds within the basin.
A recent case study in Rosemeadow, Campbelltown by the NSW Government demonstrates how to improve urban cooling by increasing tree canopy cover in a public open space while maintaining the dual function as a detention basin. The study found there are significant achievements that can be made by applying updated approaches to dual-purpose open space and stormwater management that do not compromise hydraulic flow. This could be applied to all future developments.
92 URBAN COOLING STRATEGY 2022 - 2052 WAGGA WAGGA CITY COUNCIL
These existing open spaces across Wagga Wagga generally have high LST (as many are bare earth year round and during the summer months) and low canopy rates. Planting large native trees with high canopy cover would increase urban cooling, encourage outdoor recreation (especially in the warmer months), support urban biodiversity, and provide alternatives for stormwater captured (such as irrigation).
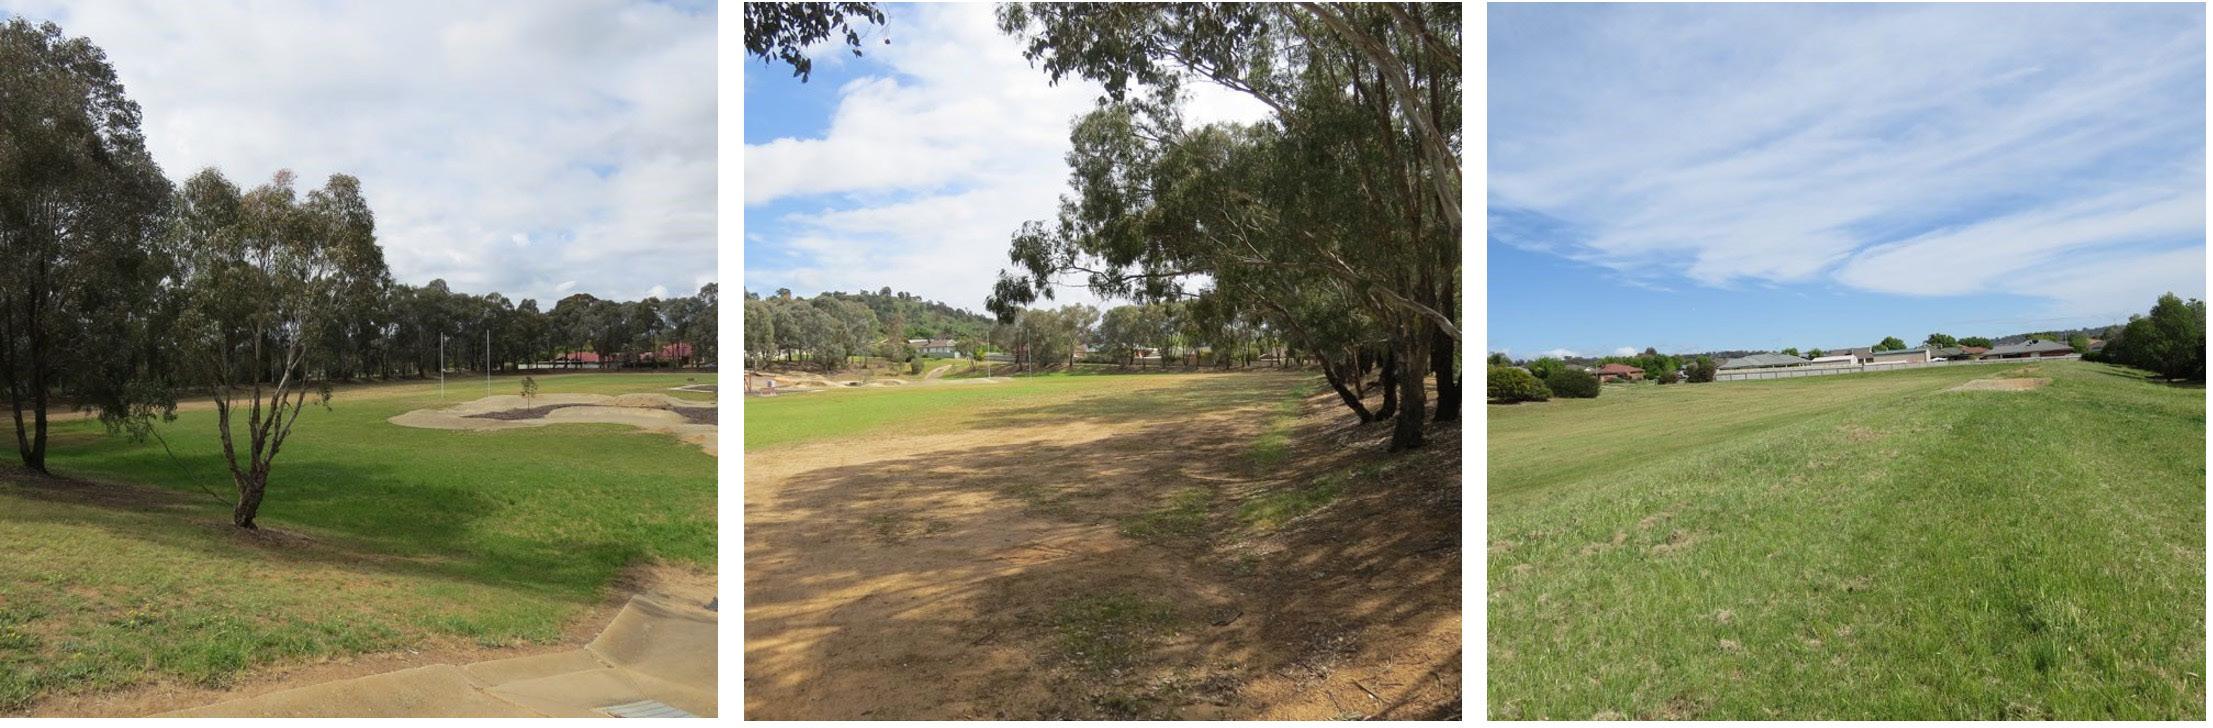
All plantings should be designed to have no impact on the integrity of the detention basin itself and its primary role in local floodwater mitigation. Figure 80 shows two detention basins in Wagga Wagga containing a border of remnant vegetation that provides some canopy cover, and one without canopy cover.
Community nominated locations
There are examples in other local government areas where the Council encourages community involvement in nominating tree planting locations.
Where a community member notices that a place they frequent would benefit from the addition of a tree, they can submit a request or suggestion via an app or online. Sites are identified via a ‘drop a pin’ style user interface containing basic street map overlays. Submissions would need to be assessed to determine feasibility and effectiveness of future tree planting, taking into a range of factors from general space and utility locations to planning restrictions. Council would have discretion as to whether to undertake the planting or not on this basis and select a tree with appropriate characteristics and canopy size for that location.
93 URBAN COOLING STRATEGY 2022 - 2052 WAGGA WAGGA CITY COUNCIL
Figure 80: Canopy cover from remnant vegetation on banks of existing detention basin in Kooringal (left and centre) compared to no canopy cover in detention basin in Glenfield (right).
Action Summary
This section covers the actions that Council need to take to meet the objectives of the Urban Cooling Strategy

94 URBAN COOLING STRATEGY 2022 - 2052 WAGGA WAGGA CITY COUNCIL
The following table summarises a number of actions that Council and the community can take to help reduce the impact of increasing temperatures and heat waves on the community. These strategies are conceptual only, and will be subject to available funding and resources, as well as site specific feasibility.
Item Activity Description
Responsible Area
UCS1 Council to implement planning controls for increased heat resilience in all new developments City Strategy
UCS2 Council to avoid and minimise tree removal in public and private spaces Development Assessment Parks & Strategic
UCS3 Council to develop an offset policy for tree removal Environment & City Strategy
UCS4 Council to develop an Urban Tree Management Plan to replace the Street Tree Master Plan & Strategy Parks & Strategic Operations
UCS5 Council to make available and promote the online Urban Heat Mapping Tool to the community Environment & ICT
UCS6 Council to develop a Community ‘drop a pin’ program for suggested tree planting locations Environment
UCS7 Council to educate the community on the benefits of trees and encourage owners to plant on their residential, commercial or industrial property
UCS8 Council to enhance remnant vegetation in priority Environmental Conservation and natural reserve areas
UCS9 Council to encourage and assist residents to plant trees and tall shrubs in urban yards through the ‘One Tree for Me’ program
Environment
Environment
Environment
UCS10 Council to continue community programs for tree planting in schools Environment
UCS11 Council to encourage the community to landscape nature strips with waterwise native plants Environment
UCS12 Council to increase existing road reserve canopy planting in priority suburbs Parks & Strategic Operations
UCS13 Council to consider areas for traffic island plantings in the road reserve Operations
UCS14 Council to survey the active travel path network and identify opportunities to increase plantings Parks & Strategic Operations
UCS15 Council to audit playgrounds and identify opportunities to increase shade through plantings or shade sails
UCS16 Council to audit the bus stop network and identify opportunities to increase shade through plantings or shelters
City Strategy
City Strategy
UCS17 Council to investigate additional shade options for Council owned carparks Operations
Table 1: Action items to increase urban cooling in the Wagga Wagga urban area.
95 URBAN COOLING STRATEGY 2022 - 2052 WAGGA WAGGA CITY COUNCIL
Action summary
Item Activity Description
UCS18 Council to evaluate sportsgrounds and identify opportunities to increase shade through plantings, shade sails or shelters as appropriate
Responsible Area
Parks & Strategic Operations
UCS19 Council to consider perimeter planting around existing detention basins Operations
UCS20 Council to evaluate SP1 (Special Activities) and SP2 (Infrastructure) land use areas for large canopy planting opportunities
Operations
UCS21 Council to investigate white roofs or green roof and wall options for existing Council buildings Environment
UCS22 Council to educate the community on white roof benefits and advocate to the NSW Government for retrofit funding
Environment
UCS23 Council to prioritise the use of cool materials and surfaces for all new facilities and assets developed PMO
UCS24 Council to consider the feasibility of installing artificial water features in suitable public open spaces
City Strategy
UCS25 Council to encourage green roofs, walls and facades on high density developments City Strategy & Development Assessment
UCS26 Council to conduct future high-resolution mapping of canopy and land surface temperature to monitor changes
Environment & ICT
UCS27 Council to promote heatwave preparedness for residents Environment
UCS28 Council to lobby for increased thermal standards for rental housing City Strategy
UCS29 Council to advocate for bundling of power cables to reduce street tree pruning Operations
96 URBAN COOLING STRATEGY 2022 - 2052 WAGGA WAGGA CITY COUNCIL
References
• Bureau of Meteorology. Weather station ID: 072150 WAGGA WAGGA AMO.
• Department of Planning and Environment (2022). Sustainable Buildings SEPP Overview. DPE, Sydney.
• Department of Planning, Industry and Environment (2020). Greener Places, a design framework for urban green infrastructure. DPIE, Sydney.
• Department of Planning, Industry and Environment (2021). Greener neighbourhoods guide. DPIE, Sydney.
• Dominguez A, Kleissl J, Luvall J (2011). Effects of solar photovoltaic panels on roof heat transfer, Solar Energy, Volume 85, Issue 9. Available at http://maeresearch.ucsd. edu/kleissl/pubs/DominguezetalSE2011.pdf
• Hopkins, G. and Goodwin, C (2012). ‘Green roof trials monitoring report’, The Government of South Australia and Aspen Developments.
• Hopkins, G. and Goodwin, C, Milutinovic, M. and Andrew, M. (2012 b), ‘Postconstruction monitoring report: Living wall system for multi-storey buildings in the Adelaide climate’, The Government of South Australia and Aspen Developments.
• Hopkins, G. and Goodwin, C (2011). Living Architecture: Green Roofs and Walls, CSIRO Publishing Collingwood, Victoria.
• Intergovernmental Panel on Climate Change (2018). Global warming of 1.5°C. Summary for policymakers, IPCC, Geneva.
• Masson V, Bonhomme M, Salagnac J-L, Briottet X, Lemonsu A (2014). Solar panels reduce both global warming and urban heat island. Frontiers in Environmental Science Volume 2. Available at https://www.frontiersin.org/article/10.3389/ fenvs.2014.00014
• McAuley A, Osmond P, Bartesaghi C, Stoller P (2021). Urban Heat Planning Toolkit. Western Sydney Regional Organisation of Councils’
• Office of Environment and Heritage (2014). Murray Murrumbidgee Climate change snapshot. State of NSW and OEH.
• Office of Environment and Heritage (2015). Urban Green Cover in NSW Technical Guidelines. State of NSW and OEH.
• Office of Environment and Heritage (2016). Minimising the impacts of extreme heat: A guide for local government. State of NSW and OEH.
• Osmond, P and Sharifi, E (2017). Guide to Urban Cooling Strategies. Low Carbon Living CRC.
• United Nations Environment Programme (2021). Beating the Heat: A Sustainable Cooling Handbook for Cities. UNEP, Nairobi.
• United States Environmental Protection Agency (2008) Reducing urban heat islands: compendium of strategies. U.S. Environmental Protection Agency, Washington DC.
• Western Sydney Regional Organisation of Councils (2018). Turn down the heat strategy and action plan, WSROC, Sydney.
• Western Sydney Planning Partnership (2020). Western Sydney Street Design Guidelines. Aspect Studios, Sydney
97 URBAN COOLING STRATEGY 2022 - 2052 WAGGA WAGGA CITY COUNCIL
References

Contact us PO Box 20, Wagga Wagga NSW 2650 Cnr Baylis and Morrow Streets, Wagga Wagga NSW Visit our website wagga.nsw.gov.au Email us council@wagga.nsw.gov.au Follow us on Twitter @WaggaCouncil Like us on Facebook City of Wagga Wagga Follow us on Instagram @WaggaCouncil Talk with us 1300 292 442
