
2 minute read
Data Dashboards


One of the early responses by the space sector to the pandemic was a joint project between ESA and the European Commission (EC) called Rapid Action on Coronavirus and EO (RACE), which produced a free dashboard-style tool, launched in early June 2020.
Advertisement
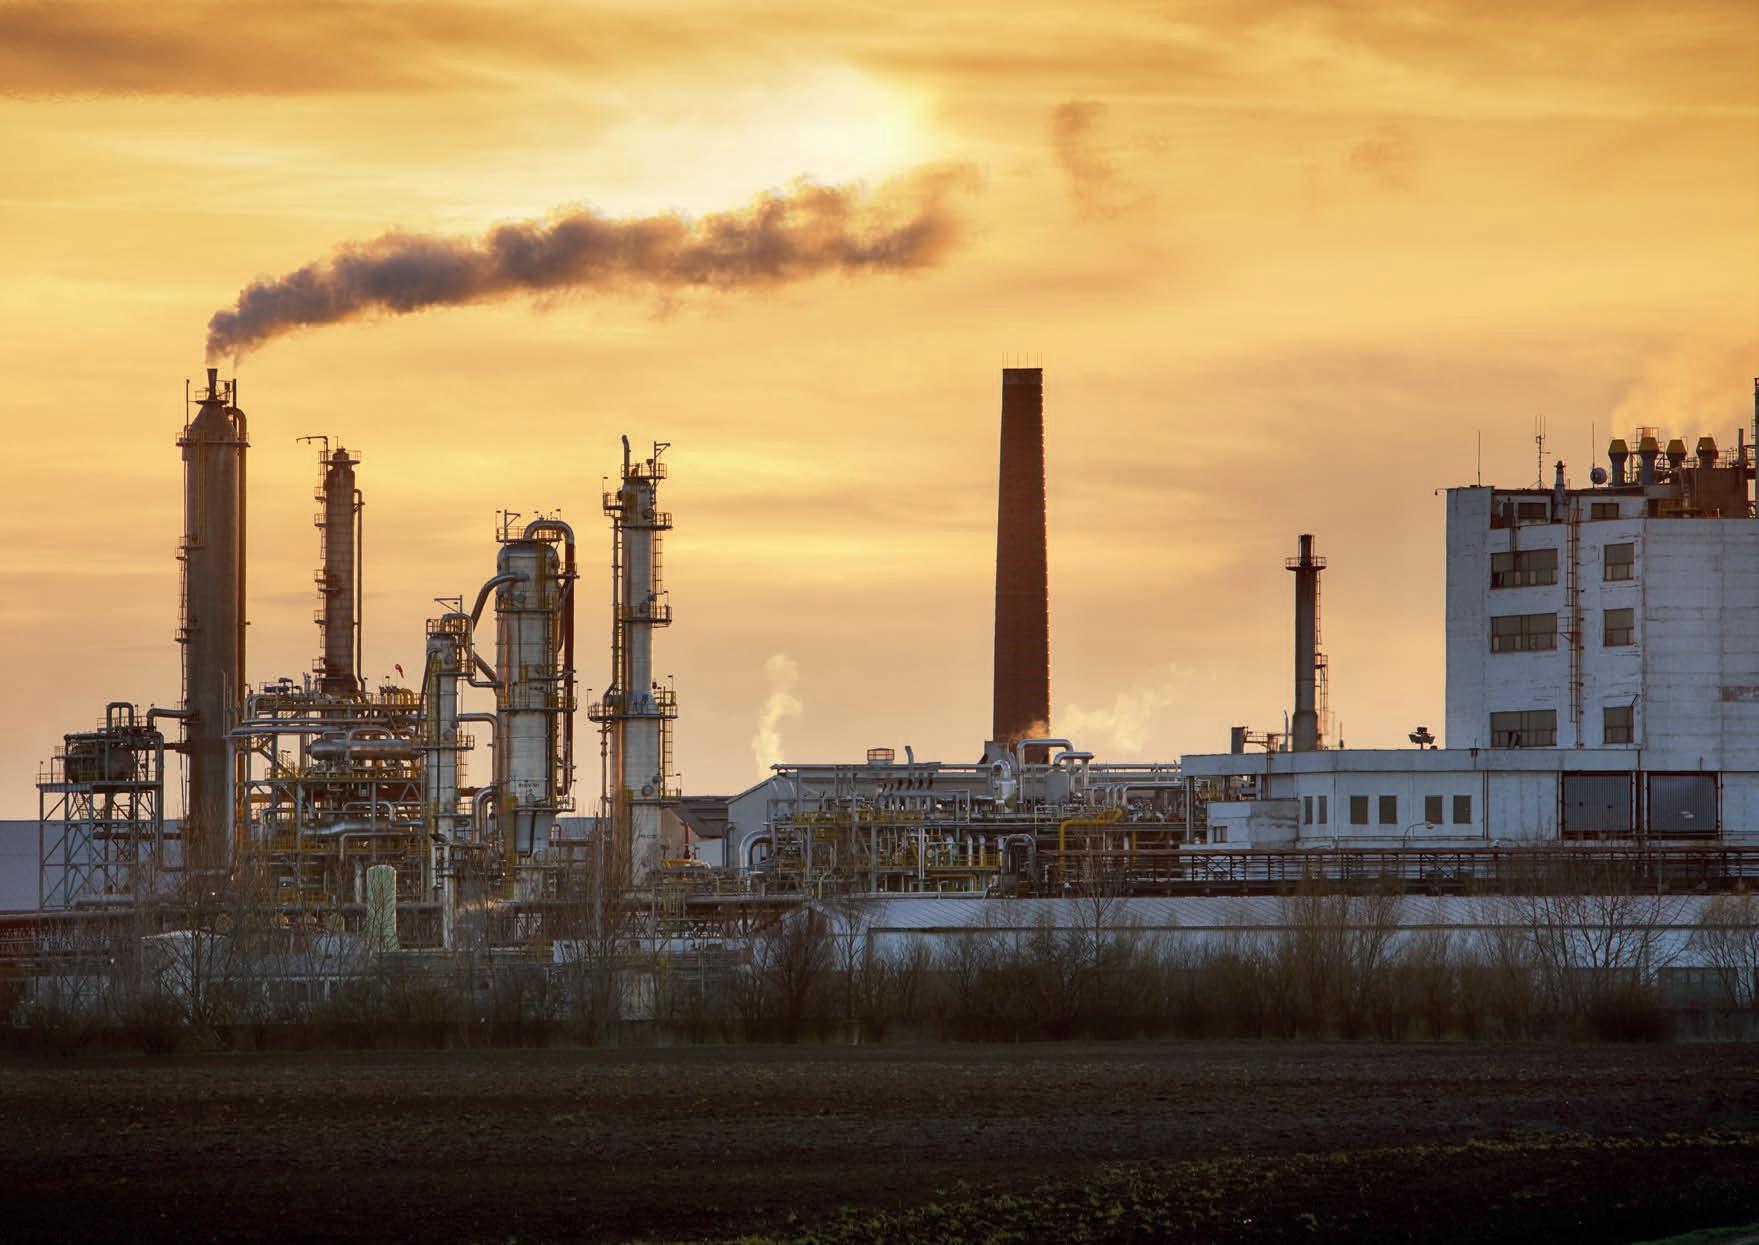
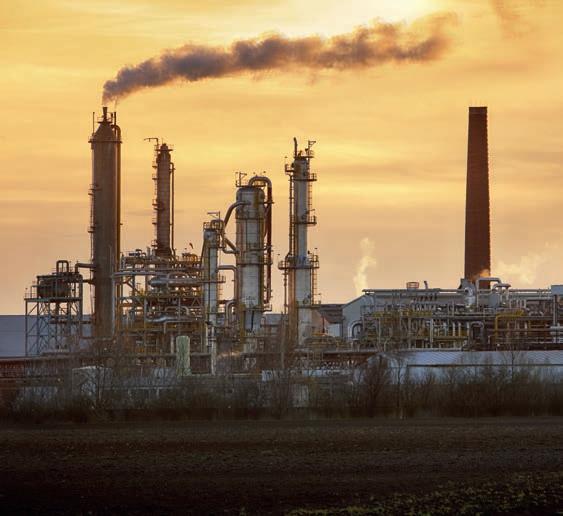
RACE uses EO data from Copernicus Sentinel satellites and third party missions to monitor key environmental parameters, such as air and water quality, and human activities including industry, shipping, traffic, construction and agricultural activity.
Over 20 industrial and academic partners worked with ESA and the EC to create and populate the platform, including RHEA Group. We provided expertise to RACE on a number of topics, including artificial intelligence (AI). The RACE project enlisted strong public feedback. Citizens and organizations from 26 countries submitted ideas for the portal, with the two winning ideas from the public added to the RACE dashboard later in 2020, both of which used Sentinel-2 imagery:
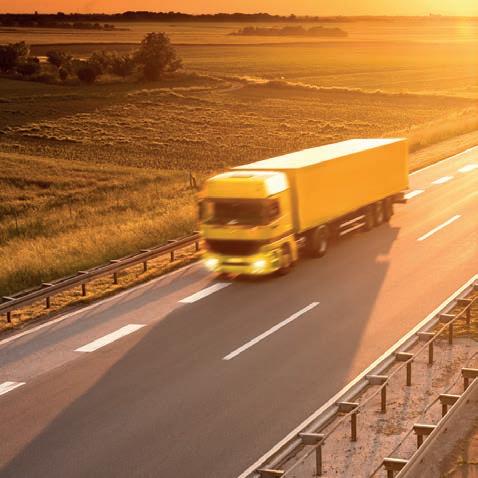
• detecting and quantifying the number of trucks moving on roads in the EU
• air traffic monitoring in Europe by applying AI to detect flying planes and compare numbers with the previous year.

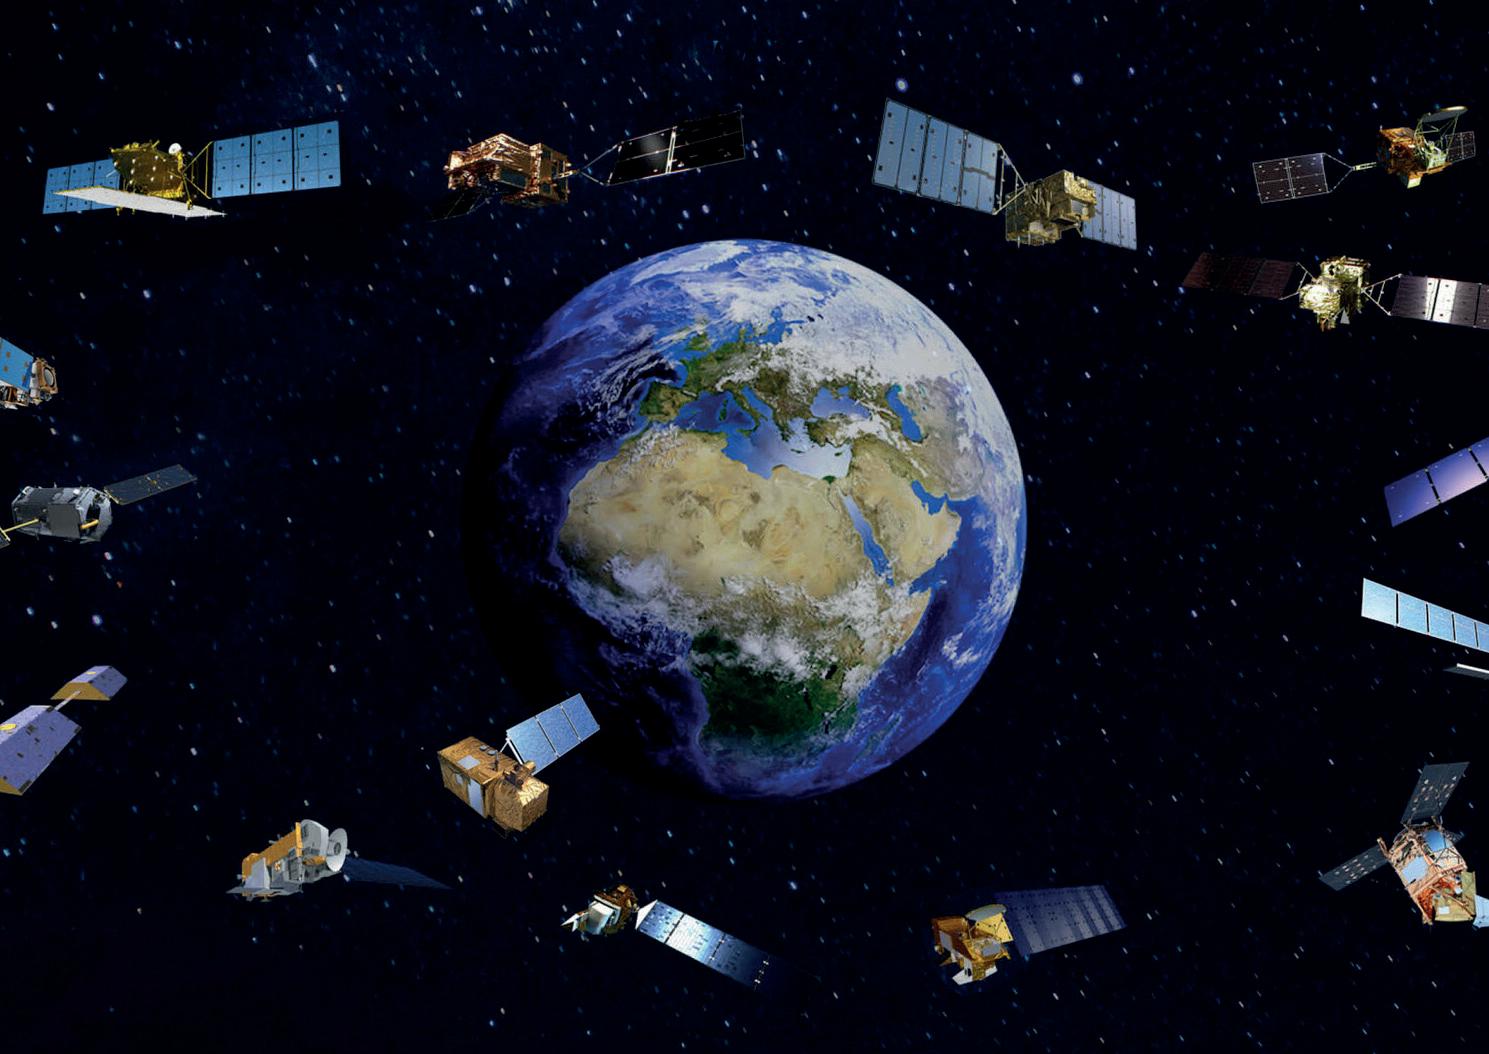
At the end of June, NASA, ESA and the Japan Aerospace Exploration Agency (JAXA) launched the global COVID-19 Earth Observation Dashboard, which offers similar data to RACE. This brings together new and historical datasets for global and targeted regional monitoring, using data from NASA, JAXA, European Sentinel and US satellites.
The United Nations World Food Programme forecast that the COVID-19 pandemic would push millions more people into chronic hunger. Dashboards such as these could prove extremely valuable in tackling such challenges and supporting agriculture-related activities.
RHEA Group and RACE
RHEA Group supported the RACE programme by providing satellitebased information about the effects of COVID-19 on some European key economic and commercial hotspots.
RHEA’s experts, with support from our artificial intelligence team in Frascati, led a team to analyse very high resolution images from Planetscope and Pleiades accessible via the Euro Data Cube. They performed an automated, fast and scalable quantitative analysis of changes in truck and cargo ship traffic in port areas, truck and car traffic in industrial sites and car traffic around supermarkets. This was then used to extract indicators on the activity levels of such sites, ultimately providing information on 11 different hotspots.


