
5 minute read
Monitoring and the Value of Space Data


Despite the news stories that started to emerge in January 2020 about an unknown virus, few foresaw just how quickly the world would change due to COVID-19. Yet by the end of March 2020, most countries in Europe and many in the rest of the world had implemented lockdown restrictions.
Even before the virus had spread across Europe, data from the Copernicus Sentinel-5P satellite showed drastic falls in emissions of NO2 in China’s Hubei province coinciding with lockdown. This indicated a significant fall in man-made pollution, which was later also seen over major cities and regions in Europe as they had quarantine measures implemented. The European Space Agency (ESA) did not simply continue with its Earth observation (EO) programme as before. Instead, along with other international and national space agencies, ESA quickly explored how it could best use its technology and expertise to support organizations and individuals through the crisis.
Advertisement


Near real-time, large scale monitoring is something satellites are uniquely positioned to do – and particularly monitoring of the atmosphere. In June, for example, ESA released the Copernicus Sentinel-5P Mapping Portal that provides maps of NO2 and carbon monoxide concentrations across the globe, enabling anyone to view trends in atmospheric pollutants. Sentinel-5P data was also used to identify falls in sulphur dioxide concentrations over India during the early months of the pandemic and, perhaps surprisingly, increases in methane emissions over known hotspots.
Provision of targeted EO data rapidly proved its worth, as did satellite location data provided by Galileo, Europe’s global navigation satellite system (GNSS).
Copernicus EO data was used from March to monitor traffic congestion at borders between EU Member States caused by national lockdowns, helping national authorities to make informed decisions about easing congestion to help reduce the spread of the virus. This was later supported by the Galileo Green Lane app from the European GNSS Agency (GSA), designed to support freight traffic
movement by providing real-time maps to enable efficient transit of critical goods.
Even weather forecasts were affected by the pandemic. Commercial aircraft are equipped with sensors that supply data on temperature, wind speed and wind direction but the drastic reduction in passenger flights affected the availability of these measurements – a gap that is being partially bridged by ESA’s Aeolus satellite mission.
Why does measuring atmospheric gases matter?
The composition of gases in the atmosphere determines the air we breathe – and therefore our health – and the Earth’s climate. For this reason, some of the Copernicus Sentinel satellites carry instruments specifically designed to detect a variety of gases. The Tropomi spectrometer already flying on Sentinel-5P, for example, maps trace gases including nitrogen dioxide, ozone, formaldehyde, sulphur dioxide, methane, carbon monoxide and aerosols.
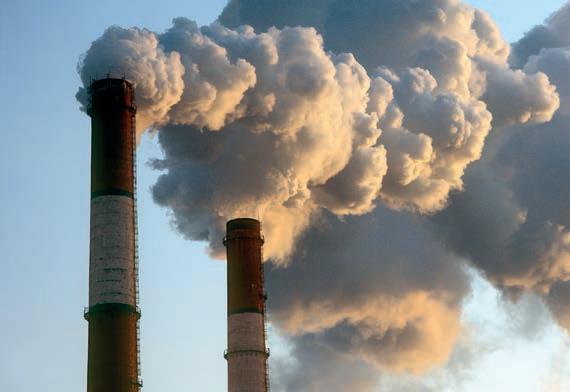
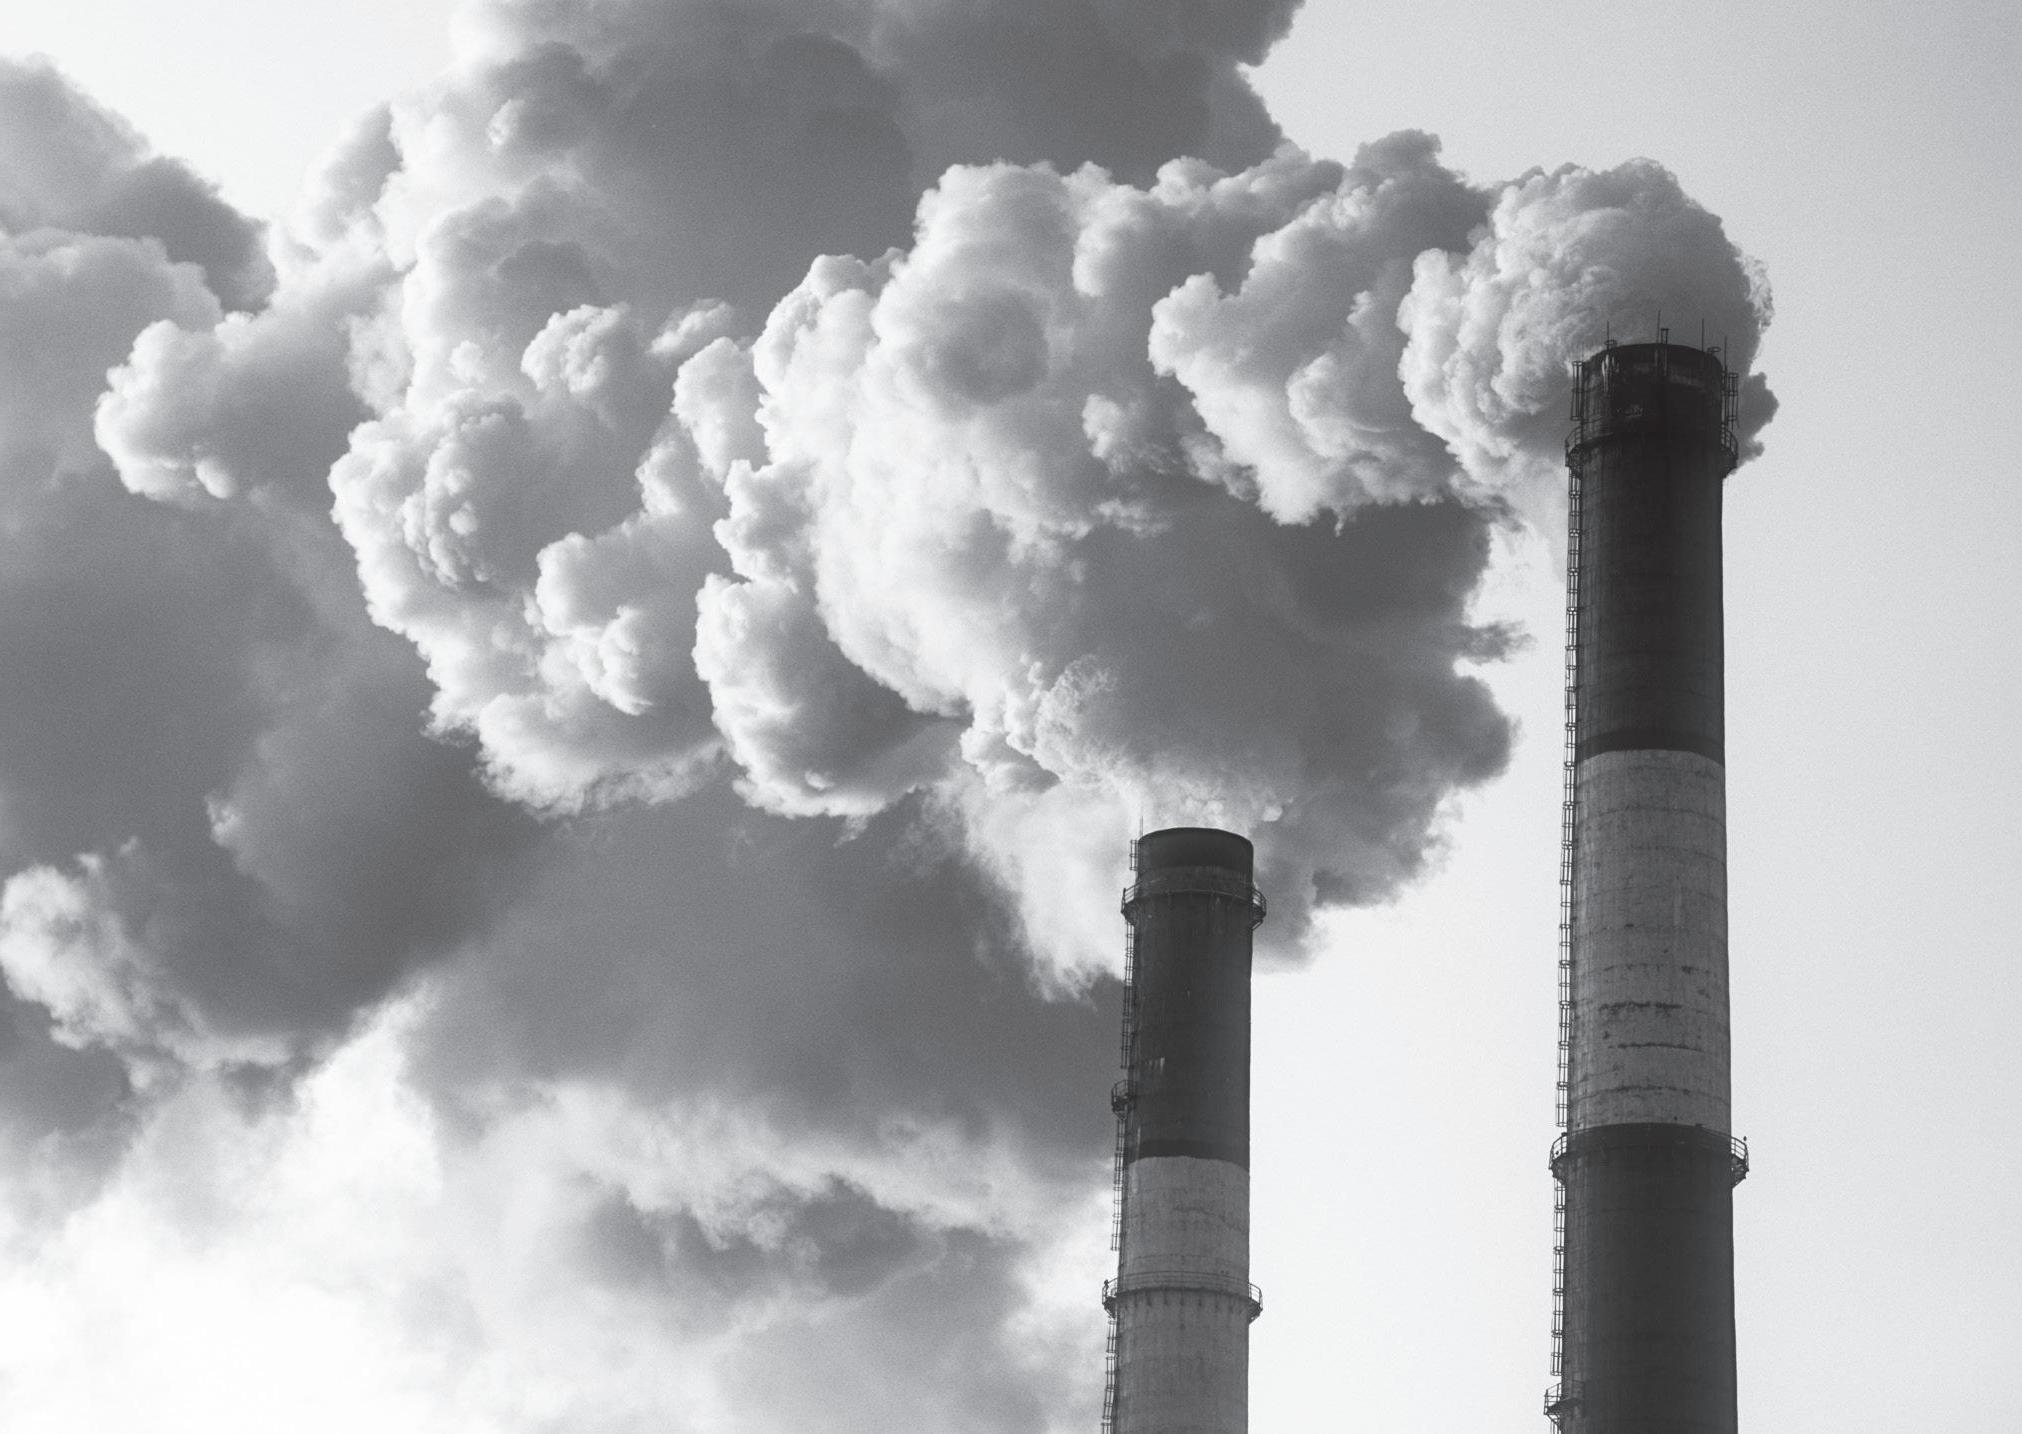
1 Carbon dioxide (CO2 ) – CO2 is dynamic and in a constant exchange with the biosphere, but was generally stable until the industrial revolution. Generated from sources such as traffic, power plants and factories, its concentration since then has steadily increased. Once released, CO2 stays in the atmosphere for thousands of years. Anthropogenic (man-made) emissions tend to be intense but only over a small area and can change quickly, making them hard to spot.
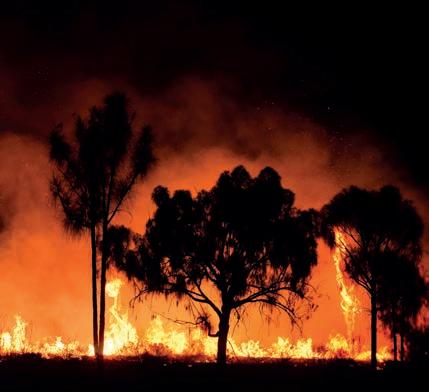
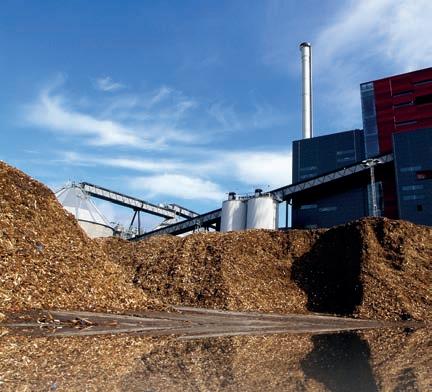
Carbon monoxide (CO) – Forms whenever carbon-based fuels (such 2 as coal, oil, natural gas and wood) are burned incompletely. Many human activities emit carbon monoxide, but biomass burning is one of the main causes. Contributes to the formation of tropospheric ozone and affects the abundance of methane and carbon dioxide.
Formaldehyde (HCHO) – Released from forest fires and activities 3 such as wood processing. Although short-lived in the atmosphere, it is an intermediate gas in the oxidation of methane and other hydrocarbons, and reacts chemically to become a major source of carbon monoxide.
1

2 4
3

5
7
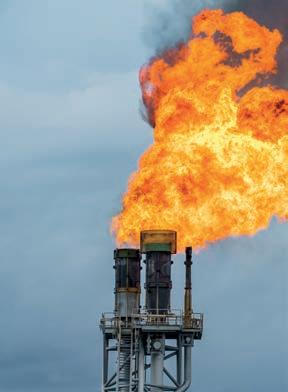
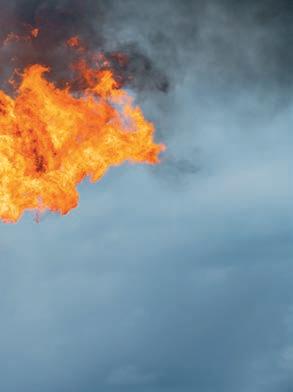
4 Methane (CH4 ) – The second strongest greenhouse gas released due to human activities and around 30 times more potent than CO2 as a heat-trapping gas. One of the largest sources is fossil fuel production. An increase in methane concentrations over known hotspots during the pandemic may have been due to less demand for gas, leading to it being vented and burned.
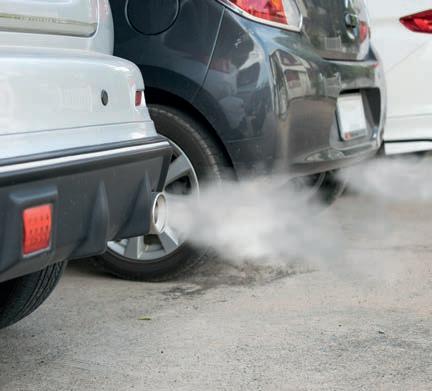
5 Nitrogen dioxide (NO2 ) – A short-lived air pollutant, which forms as part of high-temperature combustion of fuels and leads to the formation of ozone. NO2 is an indicator of pollution in any given area as its source is primarily the burning of fuel. It acts as a signpost showing where to look for CO2 emissions.
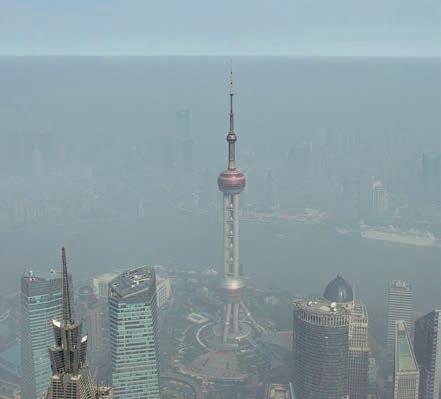
6 Ozone (O3 ) – Atmospheric ozone absorbs solar ultraviolet radiation; this heats the stratosphere and protects living things from the damaging effects of ultraviolet radiation. It also absorbs infrared radiation emitted by the Earth’s surface, effectively trapping heat in the troposphere. The climate impact therefore varies with the altitude at which any ozone changes occur. Tropospheric (ground-level) ozone – the main ingredient in ‘smog’ – can trigger a variety of health problems in humans and affect sensitive vegetation and ecosystems.
7 Sulphur dioxide (SO2 ) – Although volcanic activity was once the primary source of SO2, the majority now comes from industrial processes and motor vehicle emissions. It can result in breathing problems, is a precursor to acid rain and can have an effect on climate.


