International Journal of Civil and Structural Engineering Research ISSN 2348-7607 (Online) Vol. 9, Issue 2, pp: (27-37), Month: October 2021 - March 2022, Available at: www.researchpublish.com
THE STUDY OFTHE EFFECT OF USING SEAWATER IN FLAT SLABS REINFORCED WITH FIBER REBARS
Usama Ali Ali Ebead1 , Magdy.M.M Genidi2
, Adel M. Soliman Asem Elsayed Ali M.Selem41Professor of Reinforced Concrete in Qatar University
3 ,
2Associate Professor - Department of Structural Engineering. Faculty of Engineering - Helwan University 3Assistant Professor of Reinforced Concrete in Obour High Institute for Engineering & technology 4 B. Sc. Civil Engineering 2016 Obour High Institute for Engineering & technology
Abstract: Freshwater, will be scarce and could be very difficult to obtain in some regions of the world. According to the report of the World Meteorological Organization (WMO), more than half of the world’s population will not be able to get enough drinking water by 2025. In the concrete industry, several billion tons of freshwater are used annually in mixing, curing, and cleaning around the world and to saving freshwater, using seawater as the mixing water in concrete should be investigated seriously. So, in this research, we made several mixtures. So, in this research, we made mixtures with different proportions (0%, 50%, 100%) of seawater, and the use of ordinary cement and sulfate-resistant cement, as well as fresh water and seawater in the treatment, and using glass fiber rebar replace steel rebar. The pattern of cracks, final mode of failure, and deformational characteristics (deflection, and steel tensile strain) were recorded. Finally, analysis of test results and recommendations were reported.
Keywords: GFRP; seawater; freshwater; and OPC & SRC cement.
1. INTRODUCTION
The construction industry and concrete manufacturers realized that they will need to of concrete mixed with seawater use to make an ideal concrete suitable for all Coastal cities.
The study found that when seawater is used for mixing or curing concrete, it changes the pace of strength gain. When compared to similar concrete specimens prepared and cured with fresh water at 90 days, the strength of concrete made with seawater was found to be roughly 15% lower. [1].
“Early-age strength performance of seawater concrete was somewhat greater than that of freshwater-mixed counterpart until Day 7, followed by a strength performance that was 7–10 % lower to freshwater concrete after 28 days or later. In addition, seawater concrete shrank slightly more than freshwater concrete, with a difference of 5% recorded after 56 days of mixing.” [2]
Seawater is currently forbidden from being used in concrete mixtures due to its high chloride concentration, which promotes reinforcing steel corrosion. The average total salinity of seawater is 3.5 %, with sodium chloride (NaCl) accounting for roughly 78 %. Despite the popular perception that seawater is unsuitable for structural concrete, seawater concrete (seawater-mixed concrete and seawater concrete are used interchangeably in the text) was successfully employed to construct a number of structures during the last century or even earlier.
This can be viewed as intuitive proof for the use of seawater in the production of long-lasting concrete. Steel corrosion can be avoided by employing seawater in non-reinforced concrete applications or by reinforcing concrete structures with
International Journal of Civil and Structural Engineering Research ISSN 2348-7607 (Online) Vol. 9, Issue 2, pp: (27-37), Month: October 2021 - March 2022, Available at: www.researchpublish.com
non-corrosive materials such as rebar reinforced polymer (FRP).FRP bars, in addition to being lightweight and strong, have the capacity to resist corrosion, and as a result, good durability performance has been observed for FRP-reinforced concrete exposed to seawater. [3]
1.1. Behavior of concrete made of seawater
The study found that when seawater is used for mixing or curing concrete, it changes the pace of strength gain. The tensile strength of concrete produced with seawater When compared to the previous year, there was a 15% decrease in water concrete specimens created with pure water and cured for 90 days When compared to lesser strength concrete that was cured with seawater, the greater strength concrete showed less resistance to strength loss. In addition, the concrete building with seawater had a lower strength than the qualities of concrete stability [1]
The compressive strength of concrete, as well as other associated strengths, increased for specimens mixed and cured in seawater at early ages up to 14 days, while the respective strengths decreased for ages greater than 28 days and up to 90 days.
As exposure duration increases, the strength loss increases, which could be attributed to salt crystallization impacting the strength growth. [4]
This paper presents the findings of an experimental investigation that compared the strength, shrinkage, and permeability of freshwater- and seawater-mixed concretes.
The following were part of the experimental program
I) Compressive strength test (at ages 3, 7, 28, and 56 days) ,ii) concrete shrinkage test (4, 7, 14, 21, 28, and 56 days after mixing); and permeability test.iii) rapid chloride permeability and water absorption at Days 28 and 56 following mixing) According to the findings, seawater concrete had slightly better early-age (i.e., till Day 7) strength than its freshwatermixed equivalent The strength performance is 7–10% lower than freshwater concrete after 28 days or longer, In addition, seawater concrete shrank slightly more than freshwater concrete, with a difference of 5% recorded after 56 days of mixing. Finally,[5]
1.2. Mechanical properties of concrete mixed with seawater.
Experimental results for compressive strength (Fc) are shown in Table 2-11. Cubes tested were weighted and their weights are tabulated in Table 2-12. Tensile splitting strength (ft) and flexural strength (ff) are shown in Table 2-13 Water penetration depth and UPV are presented in Table 2-14[6]
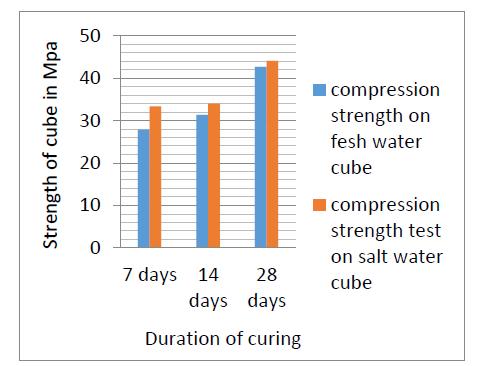
Following graph shows Figure (1) the comparison between compressive strength of fresh water and saltwater cubes
1 .From the above graph the compressive strength of saltwater cubes after 7 days increased by 19.99% as compared to freshwater cubes
2. Similarly the compressive strength of saltwater cubes after 14 days and 28 days increased by 11.91 % and 3.25%.[7]
2. EXPERIMENTAL WORK
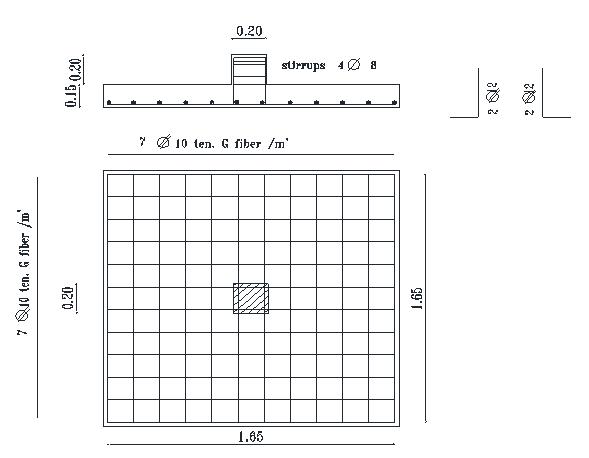
Eight R.C. slabs, sized 1650mm x 1650mm x 150mm, were manufactured and tested as shown in Figure (2).
Three parameters were considered in this study; is the type and ratio of Water for mixing, water used in the treatment, and cement type. Details of tested specimens with different parameters are shown in Table (1).
The behavior of reinforced concrete slabs with different seawater (0%, 50%, and 100% by weight) is the main objective of the study. Therefore, a total of eight slabs were classified into three groups as shown in Table (1).
Classified into three groups as shown in Table (1). The first group has three tested specimens that contained seawater ratios equal to0, 50%, and 100%. and the second group have tested specimens with seawater ratio equal to 50%,100% and have different in the type of cement. And, the third group A1, A2, and A3have six tested specimens with seawater ratios equal to 0, 50%, and 100%and different types of water treatment.
The concrete mix used to cast the tested RC slabs has concrete compressive strength 25MPa consisted of Portland cement, or Portland Sulphate- resisting cement, natural aggregates, and natural water or seawater.
International Journal of Civil and Structural Engineering Research ISSN 2348-7607 (Online) Vol. 9, Issue 2, pp: (27-37), Month: October 2021 - March 2022, Available at: www.researchpublish.com
Mixing is performed using a concrete drum mixer with a maximum capacity of 0.125 m3. Sand, gravel, and cement were dry mixed for about until a homogenous color.
Then the water was gradually added while mixing was continued for two minutes. The concrete was cast in the molds and cured at about 95 percent relative humidity.
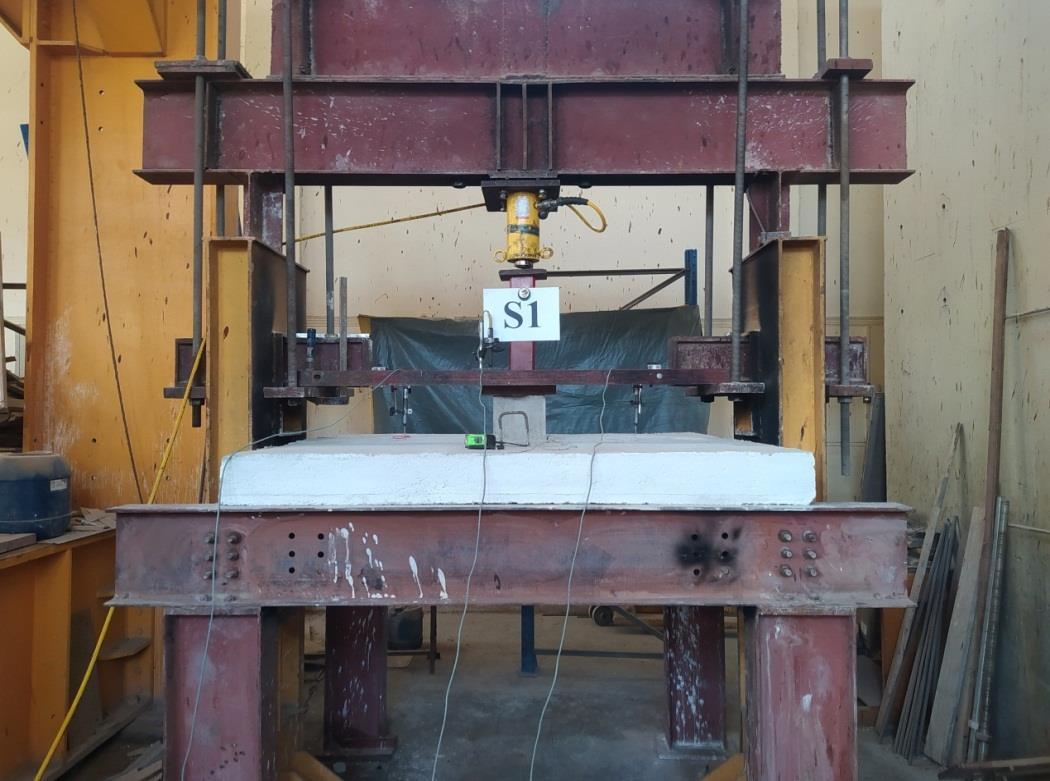
The testing frame consisted of steel I-beams rested on four steel columns. as shown in figure 3. The cantilever I-beam was rested in two supports. One of them is the tested beam to create load acting at the center of the tested beam and the anther support is hinged as shown in Figure 5. The acting reaction is generated in the center of a tested beam by the cube's load, this acting reaction is considered as the working load (30% from ultimate load).
A Digital Load cell of the capacity of 550 KN with an accuracy of 0.1 KN was adopted to measure the applied loads. The values of the applied loads were recorded from the monitor connected to the load cell. The beams were tested using an incremental loading procedure. The vertical displacement of the tested beams was recorded using two electric dial gauges, one at the middle of beams and the other at distance equal to one-fourth length from the support. During tests, after 30% from the applied load, the displacement was kept constant at each load stage for measuring and observing.
3. TEST RESULTS AND ANALYSIS
In this part, the behavior RC slab under is analyzed. Comparing between cracks patterns and load-deflection curves are discussed. The values of ultimate loads are analyzed
3.1. Crack Patterns and Modes of Failure
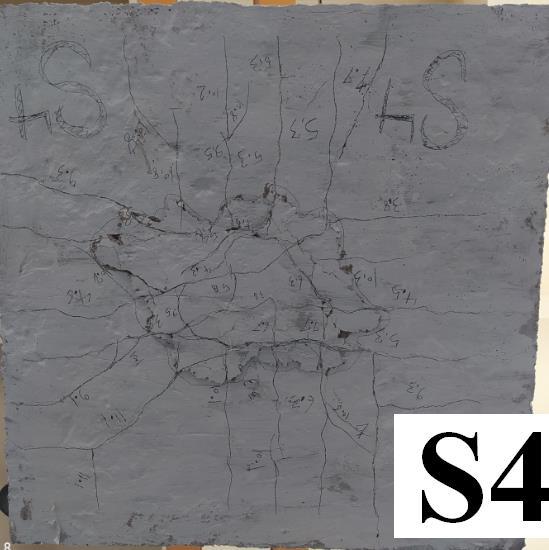
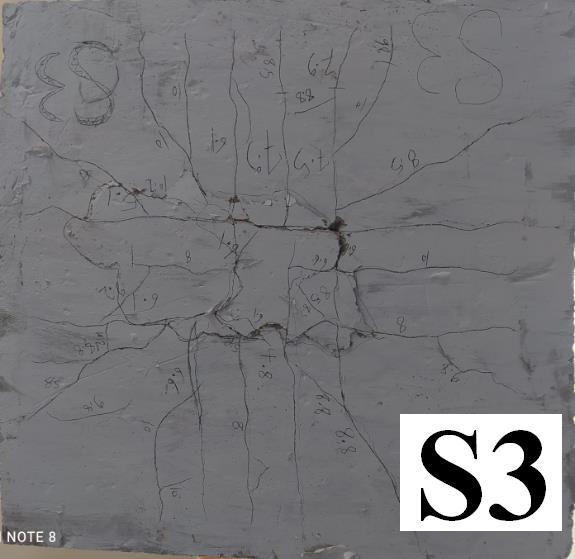
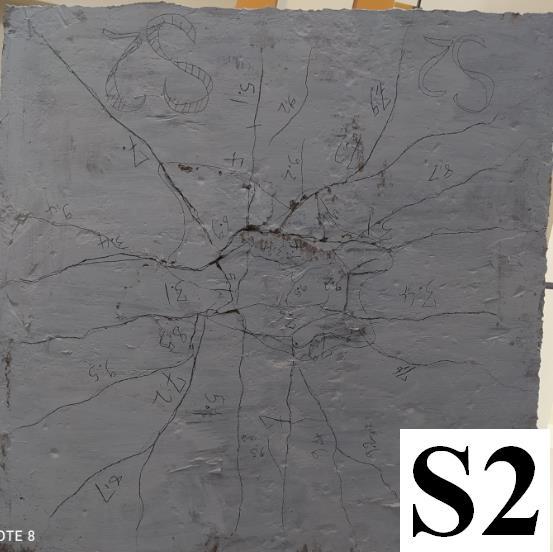
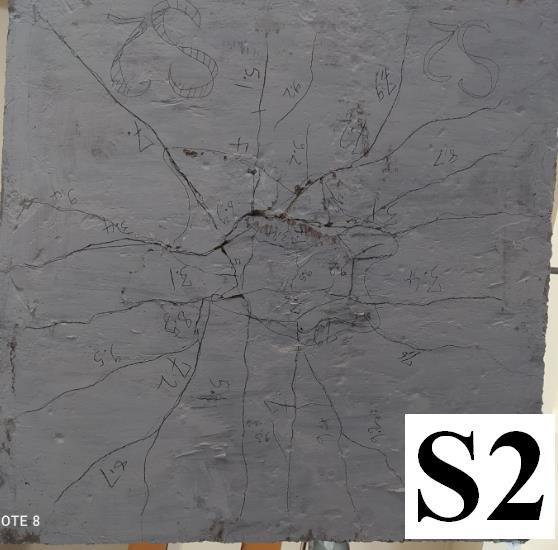
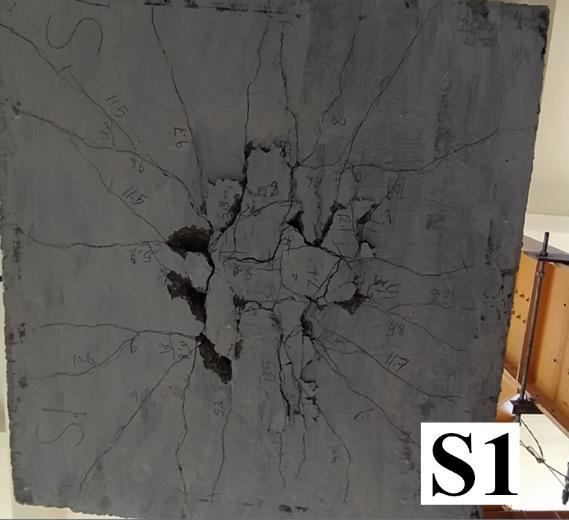
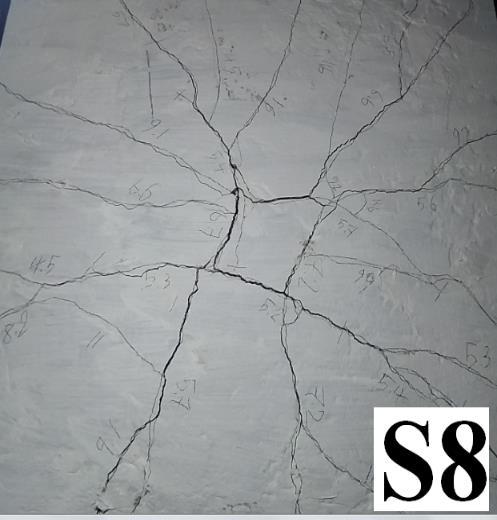
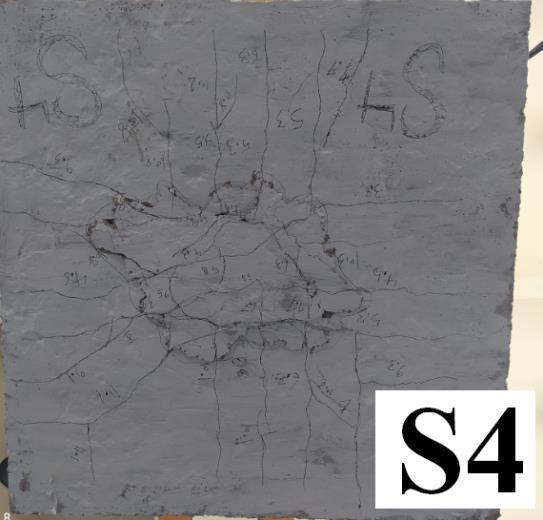
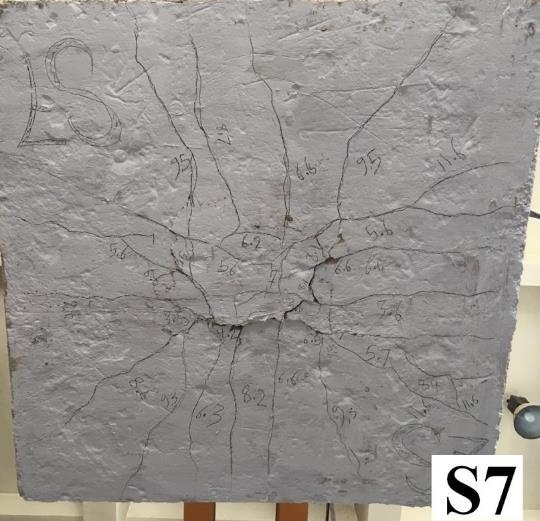
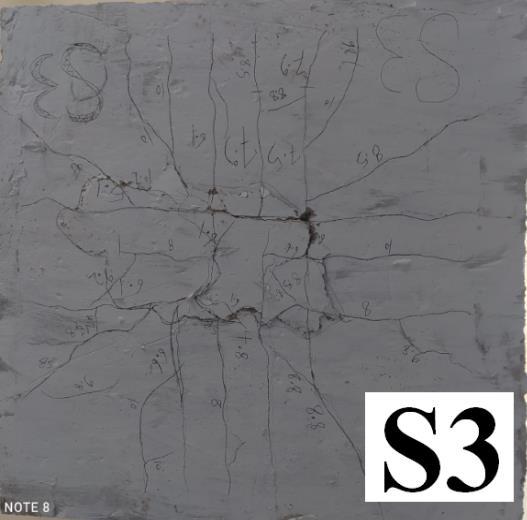
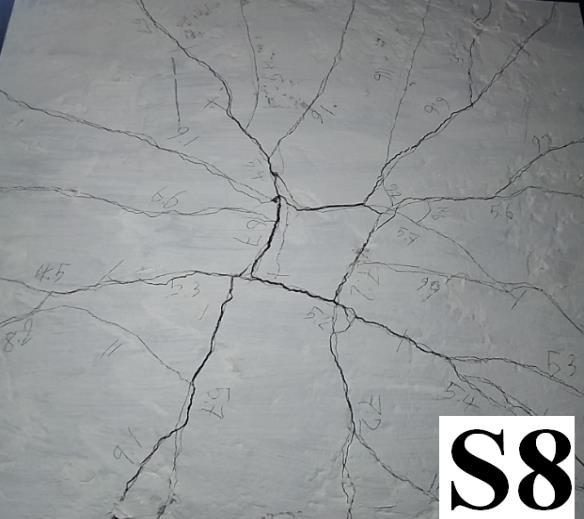
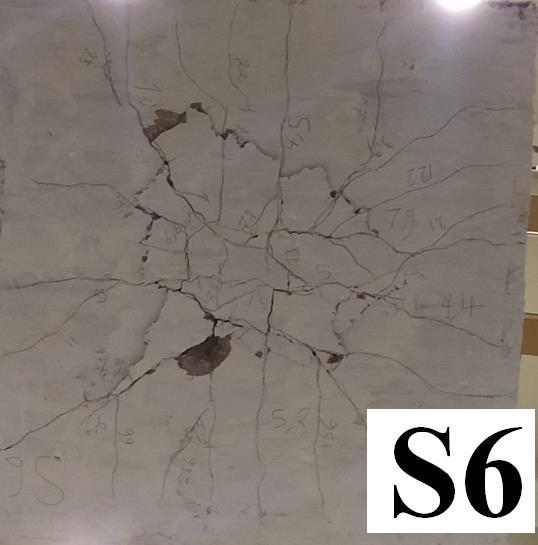
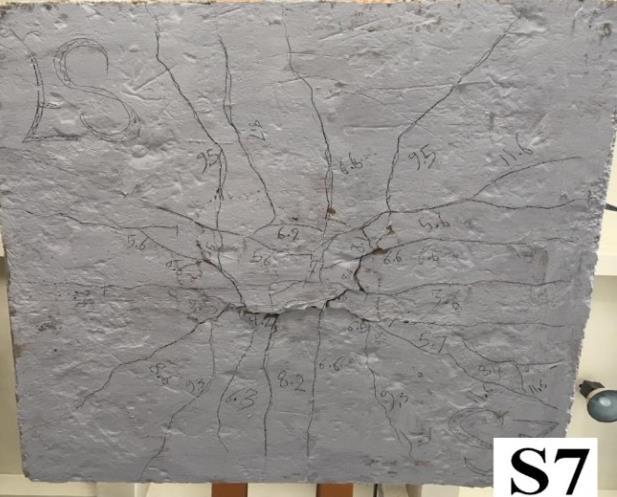
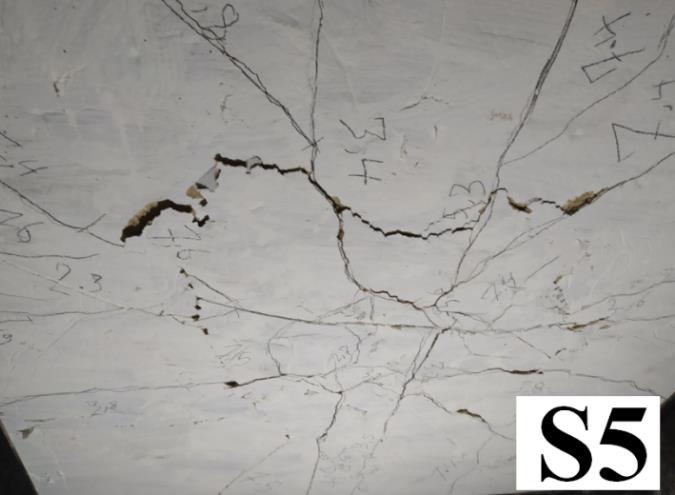
The crack patterns and mode of failures show in figure 4 for groups 1, and as shown in Figures 5 and 6 for groups 2, and as shown in Figures 7,8, and 9 for groups 3 the failures are Punching shear.
3.2. Load Deflection Curved
From groups 1,2and 3, The measured values of the deflection at the bottom surface of the tested Flat slabs at mid-span and a distance of 0.5 from the column center to the end slab were plotted vs the applied load from zero loadings to failure Results indicated that " S1-O-0%-cf " has the maximum deflection while " S5-sr-50%-cf " gives minimum deflection than the other slabs see Fig. (10).
3.3. Failure Load
Crack patterns and modes of failure are illustrated. See in, Fig. (11) through Fig. (16), and fig (4) through fig (9).
It is clear from the results of the tested slabs the control slab" S1-O-0%-cf " is the first crack under the column at midspan but the large major crack punching mode has four large cracks around the column see fig (4). The slab gave way underweight of 13.52 tons The slab with 100% seawater"S4-O-100%-cs" is shown in Fig. (4) The slab failed at load 7.60 ton
4. CONCLUSIONS
Based on the analysis of the experimental results of the tested RC slabs contained seawater, the following conclusions can be drawn: -
1. All slabs fall when they are punched, and the fracture pattern takes on a rounded appearance with many curves. The optimum ratio of polymer in concrete is 10% by cement weight.
2. The curves of the cracks rise as the proportion of seawater increases, hence the "S6-100," which has a 100% seawater percentage, has the most curved cracks of all the slabs.
3. In all specimens containing seawater, the Fcu concrete compressive strength diminishes as the percentage of saltwater decreases compared to the control slab.
4. In general, seawater can be successfully utilized in concrete at various percentages; however, the ideal proportion is 100 percent, which provides maximum load and minimal deflection.
International Journal of Civil and Structural Engineering Research ISSN 2348-7607 (Online) Vol. 9, Issue 2, pp: (27-37), Month: October 2021 - March 2022, Available at: www.researchpublish.com
REFERENCES
[1] Guo, Q., Chen, L., Zhao, H., Admilson, J., & Zhang, W. (2018). The effect of mixing and curing seawater on concrete strength at different ages. In MATEC Web of Conferences (Vol. 142, p. 02004). EDP Sciences.


[2] Younis, A., Ebead, U., Suraneni, P., & Nanni, A. (2019, January). Strength, shrinkage, and permeability performance of seawater concrete. In 10th International Structural Engineering and Construction Conference, ISEC 2019. ISEC Press
[3] Younis, A., Ebead, U., Suraneni, P., & Nanni, A. (2018). Fresh and hardened properties of seawater-mixed concrete. Construction and Building Materials, 190, 276-286

[4] Wegian, F. M. (2010). Effect of seawater for mixing and curing on structural concrete. The IES Journal Part A: Civil & Structural Engineering, 3(4), 235-243
[5] ] Nishida, T., Otsuki, N., Ohara, H., Garba-Say, Z. M., & Nagata, T. (2015). Some considerations for applicability of seawater as mixing water in concrete. Journal of Materials in Civil engineering, 27(7), B4014004
[6] Abdel-Magid, T. I., Osman, O. M., Ibrahim, O. H., Mohammed, R. T., Hassan, S. O., & Bakkab, A. A. H. (2016). Influence of seawater in strengths of concrete mix design when used in mixing and curing. In Key Engineering Materials (Vol. 711, pp. 382-389). Trans Tech Publications Ltd
[7] Landage, O. S., Shaikh, A. Y., Nanaware, P. A., Naik, V. N., & Tatikonda, M. V. (2019). Replacement of freshwater by saltwater in making concrete. Int. Res. J. Eng. Technol.(IRJET), 6, 3435.
APPENDIX - A
List of Tables
Table (1) Average compressive strength test results
Table (2) Average cubes weights .kg
Table (3) Average tensile and flexural strengths test results
Table (4) Water penetration depth and ultra-pulse velocity

International Journal of Civil and Structural Engineering Research ISSN 2348-7607 (Online) Vol. 9, Issue 2, pp: (27-37), Month: October 2021 - March 2022, Available at: www.researchpublish.com
Table (5): different parameters
Group 1 S2-O-0%-cs S3-O-50%-cs S4-O-100%-cs
Group 2 a S3-O-50%-cs S7-sr-50%- cs b S4-O-100%-cs S8-sr-100%- cs
Group 3
a S1-O-0%-cf S2-O-0%-cs b S5-sr-50%-cf S7-sr-50%-cs c S6-sr-100%-cf S8-sr-100%-cs
List of Figures
Figure (1) comparison between compressive strength of fresh water and saltwater cubes [7]
Fig. (2): Details of the Flat Slab.
Research Publish Journals
Figure (3): Test Setup Fig (4): The Crack Patterns for Group1
International Journal of Civil and Structural Engineering Research ISSN 2348-7607 (Online) Vol. 9, Issue 2, pp: (27-37), Month: October 2021 - March 2022, Available at: www.researchpublish.com
Fig (5): The Crack Patterns for Group 2 (a)
Fig (6): The Crack Patterns for Group 2 (b)
Fig (7): The Crack Patterns for Group 3(a)
International Journal of Civil and Structural Engineering Research ISSN 2348-7607 (Online) Vol. 9, Issue 2, pp: (27-37), Month: October 2021 - March 2022, Available at: www.researchpublish.com
Fig (8): The Crack Patterns for Group 3(b)
Fig (9): The Crack Patterns for Group 3(c)
Fig
International Journal of Civil and Structural Engineering Research ISSN 2348-7607 (Online) Vol. 9, Issue 2, pp: (27-37), Month: October 2021 - March 2022, Available at: www.researchpublish.com
Load *10 (t)
10
8
6
4
2
0
Load *10( t )
12 0 2 4 6 8 10 12 14 16 18 20 22 24 26 28
Deflection (mm)
Load Deflection at mid span for group one S2-O-0%-cs S3-O-50%-cs S4-O-100%-cs
Fig.(11): Load Deflection curves at mid-span under column center for group one
Load deflection at mid span for group two (a)
S3-O-50%-cs S7-sr-50%- cs
10
5
0
15 0 2 4 6 8 10 12 14 16 18 20 22 24 26 28
Deflection (mm)
Fig.(12): Load Deflection curves at mid-span under column center for group two(a).
International Journal of Civil and Structural Engineering Research ISSN 2348-7607 (Online) Vol. 9, Issue 2, pp: (27-37), Month: October 2021 - March 2022, Available at: www.researchpublish.com
Load deflection at mid span for group two (b)
Load *10( t )
Load *10( t )
10
S4-O-100%-cs
5
15 0 2 4 6 8 10 12 14 16 18 20 22 24 26 28
0
Deflection (mm)
Fig.(13): Load Deflection curves at mid-span under column center for group two(b).
Load deflection at mid span for group three (a)
10
S1-O-0%-cf
S2-O-0%-cs
S8-sr-100%- cs 0
15 0 2 4 6 8 10 12 14 16 18 20 22 24 26 28
5
Deflection (mm)
Fig.(14): Load Deflection curves at mid-span under column center for group three (a).
International Journal of Civil and Structural Engineering Research ISSN 2348-7607 (Online) Vol. 9, Issue 2, pp: (27-37), Month: October 2021 - March 2022, Available at: www.researchpublish.com
Load deflection at mid span for group three (b)
Load *10( t )
10
S5-sr-50%-cf
Load *10( t )
15 0 2 4 6 8 10 12 14 16 18 20 22 24 26 28
5
0
Deflection (mm)
Fig.(15): Load Deflection curves at mid-span under column center for group three (b).
Load deflection at mid span for group tree (c)
10
S6-sr-100%-cf
S8-sr-100%-cs
S7-sr-50%-cs 0
15 0 2 4 6 8 10 12 14 16 18 20 22 24 26 28
5
Deflection (mm)
Fig.(16): Load Deflection curves at mid-span under column center for group three (c).
