ISSN 2348-1196 (print)
International Journal of Computer Science and Information Technology Research ISSN 2348-120X (online) Vol. 8, Issue 1, pp: (99-105), Month: January - March 2020, Available at: www.researchpublish.com
ISSN 2348-1196 (print)
International Journal of Computer Science and Information Technology Research ISSN 2348-120X (online) Vol. 8, Issue 1, pp: (99-105), Month: January - March 2020, Available at: www.researchpublish.com
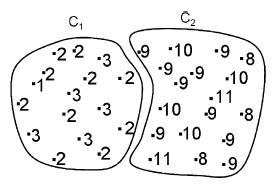
Abstract: This paper aims to analyse the traffic in 1800 MHz frequency band in the corresponding telecom circles and to find out which one has the highest traffic.There are 23 telecom circles in India and 19 out of them use 4G LTE (1800 MHz) band. Thus, chosen this band. Similarly, common network operators are: Jio, Airtel, Vodafone, Idea.
Traffic analysis enables you to determine the amount of bandwidth you need in your circuits for data and for voice calls. Traffic Measurements are conducted on a continuous basis and the results compiled into reports for management which are used in management decisions on various time scales. The busiest hour is defined as that four consecutive quarter hours whose traffic intensity is the greatest. Measurements taken outside the busy hour can be discarded. The reference intensity of traffic is then calculated by taking the average traffic intensity of the top thirty days in the year. Measurements taken on individual days can be discarded. This will give the normal high traffic intensity in the network, allowing network managers to make long-term strategic decisions.
Keywords: DBSCAN, Telecom, Frequency, Bandwidth, Traffic.
Traffic is defined as either the amount of data or the number of messages over a circuit during a given period of time. It also includes the relationship between call attempts on traffic-sensitive equipment and the speed with which the calls are completed. Traffic analysis enables you to determine the amount of bandwidth you need in your circuits for data and for voice calls and thus the need to study teletraffic engineering. The research paper comprises of eight pages. Five major sections have been covered here. These are: 1) Abstract
Various research papers were read on the subject as well as the technique used. Each of the papers helped elicit a valuable key point. Those, when amalgamated together, gave rise to this idea : to find out the highly congested telecom circle. Measurement of traffic within a network allows network managers and analysts to both make day-to-day decisions about operations and to plan for long-term developments. Traffic Measurements are used in many fundamental activities such as:
Identification of traffic patterns and trends
ISSN 2348-1196 (print)
International Journal of Computer Science and Information Technology Research ISSN 2348-120X (online) Vol. 8, Issue 1, pp: (99-105), Month: January - March 2020, Available at: www.researchpublish.com
Calculating the traffic intensity in a specific circuit or group
Monitoring the service
Dimensioning and managing the network
Calculating tariffs
Performing forecasting
Dimensioning and managing the SS7 network
Checking the performance of the common channel signalling network
o A paper titled „Distributed Dynamic Cluster-Head Selection and Clustering for Massive IoT Access in 5G Networks‟ by Yifeng Zhao, Kai Liu , Xueting Xu, Huayu Yang and Lianfen Huang is a significant research on the topic.
o It discussed the research direction of energy efficiency in cellular communication and summarized a concrete method for each direction. Then, Section 2 established a system model based on the random access process combined with the wireless resource block.
o But it does not properly help in the research prone discussion and to locate the desired area on the Indian map.
o In a paper titled „ST-DBSCAN: An Algorithm for Clustering Spatial-Temporal Data‟ , Di Qin discussed the need and discovery of implementation of DBSCAN algorithm on spatial-temporal data. It described the algorithm and showed an application. He applied the algorithm on seawater data –„The task is to discover the region that have similar seawater characteristic’
o It has solved various problems such as:
Identifying adjacent clusters
Comparing the average value of a cluster with new coming value.
If the absolute difference between Cluster_Avg() and Object_Value is bigger than �� , The object is not appended to the cluster.
o But it takes two distance parameters, eps1 and eps2 ; which makes the task a bit complex.
o In a paper titled „Multi-density DBSCAN Algorithm Based on Density Levels Partitioning‟ by Zhongyang Xiong, Ruotian Chen, Yufang Zhang, Xuan Zhang; proposed DBSCAN-DLP algorithm tries to achieve multi-density clustering via density levels partitioning according to the statistical characteristics of density variation.
o Excellent performance on both synthetic and real-word datasets confirms its effectiveness.
ISSN 2348-1196 (print)
International Journal of Computer Science and Information Technology Research ISSN 2348-120X (online) Vol. 8, Issue 1, pp: (99-105), Month: January - March 2020, Available at: www.researchpublish.com
o However, proposed algorithm needs k nearest neighbor distances and density variation values computed, stored as well. It‟s time and I/O consuming when input dataset is enormously large.
o To attack this problem, we can adopt sampling techniques before density levels partitioning for future research.
o In a paper titled „Multi-density DBSCAN Algorithm Based on Density Levels Partitioning‟ by Zhongyang Xiong, Ruotian Chen, Yufang Zhang, Xuan Zhang; proposed DBSCAN-DLP algorithm tries to achieve multi-density clustering via density levels partitioning according to the statistical characteristics of density variation.
o Excellent performance on both synthetic and real-word datasets confirms its effectiveness.
o However, proposed algorithm needs k nearest neighbor distances and density variation values computed, stored as well. It‟s time and I/O consuming when input dataset is enormously large.
o To attack this problem, we can adopt sampling techniques before density levels partitioning for future research.
o But these focus more on QoS factor, rather than identifying traffic or discussing the traffic removal.
o „An Overview of Indian Telecom Sector‟ by Zaraq Zahoor gives light on the advancement in economic and social sectors brought by Teleommunication and Information Technology.
o In „Traffic Network and Optimization a Future Subscriber‟s Mobile Telecom Operator in Train‟ by Allami J*, EzZahraouy H and Benyoussef A, We study a deterministic Mobility (subscribers in a cell in a train) by introducing a matrix of time slots of this model with the actual calculated probability of stationarity and transition are taken into account the number of subscribers, speed, time of association and movement stages for optimization and future planning of a cellular network by the technique of centroid (coordinate system) which gives a good prediction of the future position of Morocco operator : Inwi, Meditel and Telecom with integration a density of actual traces of GSM, GPRS, UMTS, WIMAX…, which leads us to predict a future telecom subscribers and control the future data telecom mobile signal and the operator will predict the future movement of the subscribers and will see if the destination area is saturated or not in terms of resources telecom for add resources to meet the needs of future subscribers.
Suitability of density based algorithm
Selection of any clustering technique is dependent on the type of data or application on which the analysis is to be applied. Seismic activity or earthquakes are event based activity. Going through the historical data pertaining to the seismic events it is easily visualized that earthquakes are not uniformly distributed. The clustering of the earthquake events is challenging since the information is available in the form of indistinct fault network based on the epicenters of the earthquake events. The faults too are not independent of each other and neighboring fault networks may interact with each other which further complicate the problem. Hence identification of seismic cluster boundaries is complex issue. Use of a density based algorithm aptly fits the requirement for the clustering of the seismic events as the events are localized pertaining to a network of fault and hence closely related. Amongst the density based clustering algorithms, Density based spatial clustering of applications with noise (DBSCAN) is one of the most popular density based algorithm which provides the following advantages:
a) They discover the cluster of the arbitrary shape.
b) Insensitive to the ordering of points.
c) It has a notion of noise and hence outliers are filtered out.
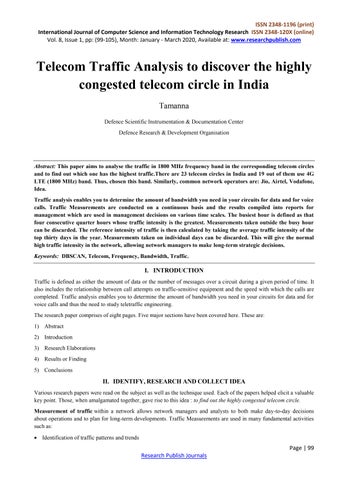
A. Density
DBSCAN combines the points in high dense region into clusters which can be of any arbitrary shape. DBSCAN algorithm requires two parameters:
a) MinPts,
b) Eps i.e. Epsilon
ISSN 2348-1196 (print)
International Journal of Computer Science and Information Technology Research ISSN 2348-120X (online) Vol. 8, Issue 1, pp: (99-105), Month: January - March 2020, Available at: www.researchpublish.com
MinPts is the minimum number of points in the cluster and Eps is the neighborhood criteria i.e. the radius of the cluster. DBSCAN forms the clusters based on the density reachability of the point.
Let D be the set of points and p and q be the two points in the set D. The Eps neighborhood of a point p, denoted by Eps (p), is defined by (1):
Eps(p) = {q ϵD | dist(p,q) <=Eps} (1)
A cluster C is defined as a non-empty subset of a database of points D with respect to Eps and MinPts
satisfying the following conditions:
a) p, q: if p ϵC and q is density-reachable from p wrt Eps and MinPts, then q ϵC.
b) p, q ϵ C: p is density-connected to q wrt. Eps and MinPts.
Thus, any point may be classified as one of the three types:
a) Core Point: A point which has minimum of MinPts, number of neighbors.
b) Boundary Point: A point which has minimum one core point as the neighbor but may not have the MinPts number of neighbours.
c) Noise or Outlier: A point which does not have MinPts number of neighbors.
The algorithm works by starting with any arbitrary point p under the considered dataset. All the points directly reachable from the point p are calculated. If the conditions are satisfied w.r.t Minpts and Eps then the point p is classified as Core Point and thereby cluster is discovered. If the point p is a border point, no further points are in the neighborhood and hence the next point p is picked and procedure is run again. At the end of the algorithm the points are grouped in clusters and noise is also detected.
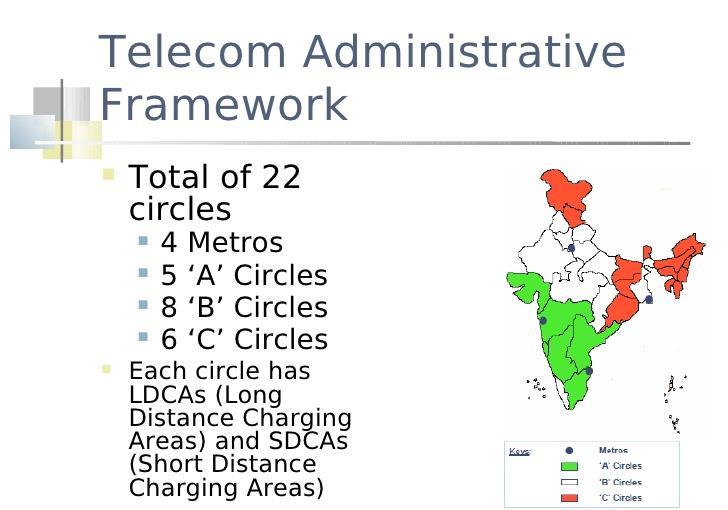
The area under consideration is India. The data taken for analysis is the Spectrum of frequency of October, 2016. The events are marked by frequencies ranging in the service area. The data is comprehensive. It has all the Uplink and Downlink frequencies, per telecom circle, per frequency band. We have chosen 1800 MHz.
For clustering, the values of basic parameters have been calculated. For the same, there is a data of cities with their respective Lat Long. The distance calculation for the determining the neighborhood between two points is calculated using Haversine formula. It calculates the great circle distance between two points on earth‟s surface.
ISSN 2348-1196 (print)
International Journal of Computer Science and Information Technology Research ISSN 2348-120X (online) Vol. 8, Issue 1, pp: (99-105), Month: January - March 2020, Available at: www.researchpublish.com
This table was used for calculating the distance:
Place Latitude Longitude
Tamil Nadu 11.05982 78.387451
Telangana 17.12318 79.208824
Madhya Pradesh 23.4733298 77.94794 Haryana 29.2384785 76.43188
Chhattisgarh 21.295132 81.828232 Haryana 29.065773 76.040497 Madhya Pradesh 25.794033 78.116531 Maharashtra 19.601194 75.552979
Tripura 23.745127 91.746826 Telangana 17.874857 78.100815 Karnataka 15.317277 75.71389
Kerala 10.850516 76.27108 Uttar Pradesh 28.207609 79.82666 Assam 26.244156 92.537842 Maharashtra 19.663280 75.300293 Tamil Nadu 11.127123 78.656891 West Bengal 22.978624 87.747803 Gujarat 22.309425 72.136230 Odisha 20.940920 84.803467 Rajasthan 27.391277 73.432617
Himachal Pradesh 32.084206 77.571167 Mumbai 18.987807 72.836447 Delhi 28.651952 77.231495 Kolkata 22.562627 88.363044
Andhra Pradesh 15.9129 79.74 Bihar 25.096073 85.313118 Punjab 31.147129 75.341217 Rajasthan 27.023804 74.217934 UP (East) 10.72237 -0.76848 UP (West) 10.32997 -2.1829 Jannu & Kashmir 33.88909 76.52844 North East 39.601082 -75.943031
eps eps Values of parameters calculated from kdist graph- ϵ =949.6 km, Minpts=5
Publish Journals
ISSN 2348-1196 (print)
International Journal of Computer Science and Information Technology Research ISSN 2348-120X (online) Vol. 8, Issue 1, pp: (99-105), Month: January - March 2020, Available at: www.researchpublish.com
Result of the DBSCAN run is as follows:
Cluster ID No. of events 1 236 2 212 3 277 4 277 5 236 6 236 7 200 8 277 9 161 10 161 11 171 12 88
The major clusters are 1, 3, 4, 5, 6, 8.
The highest frequency has been found in Idea in Maharashtra circle. Consequently, there is the least traffic.
The lowest frequency has been found in Vodafone in UP (West) circle. Consequently, it has the highest traffic.
So, UP(West) is the highly congested circle among the users of Vodafone. This can help improve the long-term development. It gives a clear determination of the bandwidth of the network operators in high usage.
Also, the places with the high bandwidth, like Maharashtra should be analysed to judge how to figure out the same. Teletraffic analysis will help discover and bring the fast communication in the country.
ISSN 2348-1196 (print)
International Journal of Computer Science and Information Technology Research ISSN 2348-120X (online) Vol. 8, Issue 1, pp: (99-105), Month: January - March 2020, Available at: www.researchpublish.com
This research was supported and directed by Mohd. Yousuf Ansari, Scientist „F‟, Defence Scientific Instrumentation & Documentation Center, Defence Research & Development Organisation. I thank him for providing insight and expertise that greatly assisted the research.
I would like to show my gratitude to Ms. Jyoti Sharma for sharing the pearls of wisdom during the course of this research. I am also immensely grateful to Erik Bohlin, Editor-in-Chief, Telecommunications Policy for reviewing the paper and helped me improving the content.
[1] Yifeng Zhao, Kai Liu , Xueting Xu, Huayu Yang and Lianfen Huang, “Distributed Dynamic Cluster-Head Selection and Clustering for Massive IoT Access in 5G Networks”, MDPI, Appl. Sci. 2019, 9, 132
[2] Di Qin, “ST-DBSCAN: An Algorithm for Clustering Spatial-Temporal Data”, University of North Carolina at Chapel Hill, Department of Statistics and Operations Research
[3] Zhongyang Xiong, Ruotian Chen, Yufang Zhang, Xuan Zhang, “Multi-density DBSCAN Algorithm Based on Density Levels Partitioning”, Journal of Information & Computational Science 9:10 (2012), 2739-2749
[4] Ioannis D. Moscholios ; Michael D. Logothetis ; Mariusz Glabowski, “Special Issue on Teletraffic Engineering in Communications Systems”, IET Netw., 2014, Vol.3, Iss. 1, pp. 1-3
[5] Zaraq Zahoor, “An Overview of Indian Telecom Sector”, Abhinav National Monthly Refereed Journal of Research in Commerce & Management, Volume 4, Issue 3 (March, 2015), pp.62-69
[6] Saurav Mishra, Manjusha Pandey, Gargi Srivastava, “A Survey on Traffic Analysis in Networks”, International Journal of Computer Science and Information Technology Research, Vol. 4, Issue 1, pp: (141-151), Month: January - March 2016
[7] Aliyu Ozovehe, Okpo U. Okereke and Anene E. C, “Litrature Survey of Traffic Analysis and Congestion Modeling In Mobile Network”, IOSR Journal of Electronics and Communication Engineering (IOSR-JECE) e-ISSN: 22782834,p- ISSN: 2278-8735.Volume 10, Issue 6, Ver. I (Nov - Dec .2015), PP 31-35
[8] Allami J*, Ez-Zahraouy H and Benyoussef A, “Traffic Network and Optimization a Future Subscriber‟s Mobile Telecom Operator in Train”, Journal of Generalized Lie Theory and Applications, J Generalized Lie Theory Appl ISSN: 1736-4337 GLTA, an open access journal, Volume 9 • Issue 1 • 1000219J
[9] Spectrum Auction October 2016, 700,800,900, 800, 2100, 2300 & 2500 MHz Band Public Report End of day 06-102016, Data for India
[10] http://www.tutorialspoint.com/Clustering/DBSCAN
[11] https://www.youtube.com/watch?v=sKRUfsc8zp4
[12] https://www.youtube.com/watch?v=6jl9KkmgDIw
[13] https://www.geeksforgeeks.org/dbscan-clustering-in-ml-density-based-clustering/
[14] https://en.wikipedia.org/wiki/DBSCAN