Vol. 9, Issue 4, pp: (1-7), Month: October - December 2021, Available at: www.researchpublish.com
INVESTIGATION OF LIQUID LOADING CONCEPT IN 0.37 INCH TUBING USING UAC EXCELLENCE FLOW LOOP
Udoaka, Mfon Godwill, 1 Dulu, Appah2 , Joseph, Amiebimbama3
1African Centre of Excellence, University of Port Harcourt, Rivers State, Nigeria
2University of Port Harcourt, Rivers State, Nigeria
3University of Port Harcourt, Rivers State, Nigeria
Abstract: The oil and gas industry is in need of more practical approach to support the understanding of liquid loading in gas wells in order to aid in the monitoring and solutions to the challenges posed by liquid loading in gas wells. In this paper, a practical facility ‘’UAC Excellence flow loop’’ for liquid loading experiment has been built, and used to study liquid loading concept on 0.37 inch tubing (Figure 1). Three stages of flow regimes have been achieved after 900 seconds of production of multiphase fluids (LPG and Water) (Figure 2). It was observed that downhole temperature is a critical factor to gas well loading. Liquid loading affect gas well pressure quicker at the onset, but gradually affect production rate (Figure 3). Annular flow was obtained at 300 seconds (Figure 5), mist flow at 600 seconds (Figure 6) and Slug flow at 900 seconds (Figure 7).The UAC Excellence flow loop, the first in Nigeria, will serve as practical equipment for the study of liquid loading in smaller diameter tubings
Keywords: Liquid loading, Tubing, UAC Excellence Flow loop, Downhole.
1. INTRODUCTION
Loading in gas well is the accumulation of water or liquid hydrocarbon that is co-produced with gas in the production tubing of gas wells which eventually leads to decline in production rate at the surface
Liquid loading in gas wells is not a new subject; it has been known for many years [8], [5], [11]. A gas well is said to be loaded when the gas velocity drops below a certain “gas critical velocity,” and the gas can no longer lift the liquids (hydrocarbon condensate liquid or reservoir water) up to the surface. The liquids fall back and accumulate at the bottom of the well and reduce gas production, or even “kill” the well.
Liquid loading causes decline in production rate and in most extreme cases may cause the well to stop flowing or die if not detected and manage early. When pressure drop in the wellbore increases, the gas flow velocity will decrease and the bottomhole pressure will increase. At this point, the effective gas permeability near the wellbore is reduced as water saturation increases. This would certainly hamper gas production rate due to the backpressure effect that renders the reservoir pressure negligible.
[4] Explained that a better understanding of liquid loading in gas wells could best be studied through the illustration of the various flow regimes of multiphase flow in pipes. The flow pattern in a vertical production conduit of a gas well is usually illustrated by four or five basic flow patterns or flow regimes The flow regimes are largely classified as annular, mist, slug-transition flow, slug and bubble, which are determined by the velocity of the gas and liquid phases and the relative amounts of gas and liquid at any given point in the flow stream.
At annular to mist, the well exhibit a relatively low gravity pressure drop, however, as the gas velocity begins to drop, the well flow regime changes from slug type to bubble flow. In these cases, a much larger fraction of the tubing volume is filled with liquid. A gas well may go through any or all of these flow regimes during its lifetime. Although the relation
International Journal of Engineering Research and Reviews ISSN 2348-697X (Online)
Vol. 9, Issue 4, pp: (1-7), Month: October - December 2021, Available at: www.researchpublish.com
between tubing, critical flow velocity and production rate have extensively been studied in various petroleum software‟s, water production still posed major challenge in gas wells, even with the efforts made toward the prediction of its onset and the remedial methods in used in the industry today.
According to [9], the process of liquid loading in gas wells starts with a gas flow rate that is sufficient enough to transport all liquids to surface without liquid fall-back in the well , as the gas velocity decreases or the liquid content in the well rises, it lead to insufficient energy in the well which reduces the liquids carrying capacity to surface and some of the liquid begins to flow backwards, the hydrostatic head downhole increases and the liquid column that has accumulated in the well re-enters the near-wellbore region of the reservoir. This result in the state that the well loadup in such a way that it can no longer lift the liquids to the surface. This process continues with an increasing volume of liquid in the wellbore.
[1] Developed empirical correlation which was for liquid loading prediction based on multiphase upward flow measurement in a long vertical pipe known as flow-pattern-dependent correlation. The empirical model designed to analysed and diagnosed liquid loading culmination process was observed in a study to have predicted liquid content and corresponding flowing bottomhole pressure before gas production ceased to flow in a well.
[10] Used both laboratory experiments and numerical simulation to described liquid loading process with reference to reservoir responses. The investigation focused only on transient flow. The existing u-shaped pressure profile method proposed by [12] was adopted. The results of the experimental and simulation shows a good pressure trend profile as proposed by [12]. The used of only consolidated sand sample limit the general application of this method. Similarly, homogenous and isotropic conditions were assumed which differ from real life [10], an approach which is based on the trend of u-shape curves with an idea that accumulated liquids in the wellbore could be reinjected into the vicinity of the payzone region is regarded as metastable. Some of the earliest scholars to work on this approach are [2], [6]
[12] Explained the concept of abnormal liquid loading in gas well with a direct identification method earlier proposed by [3]. A graphical representation of loading concept which is made up of monitoring instrument device and PLT Monitoring which can read seven parameters of natural gamma ray, casing collar, turbine flow, fluid temperature, water holdup, fluid density and pressure. For the case studied field, “Samandepe Gas field‟‟ he observed that during production, the temperature of the well always remained constant while the pressure decreases slightly which causes water vapour in the fluid phase to condense. [12] Method is good for monitoring and for liquid loading identification in gas wells. Routine periodic test recording is required, and again on the event of wrong calibration, the monitored variables could lead to errors which could put the well at risk of liquid loading when there are no proper intervention plans.
[7] Built an air-water flow loop called „Montana Tech flow loop‟ that consists of 2 inch, 1 inch, 0.75 inch and 0.5 inch tubing‟s designed for small diameter tubing liquid loading studies. It is a 47 foot vertical flow loop that is capable of flowing 4 to 40 gallons of water per minutes and air rate of 6 to 90 standard cubic feet per minutes at 10 to 90 psi. Unlike the TowerLab, the MTVFL has three viewing stations equipped with speed cameras to monitor the flow regimes.
2. METHODLOGY
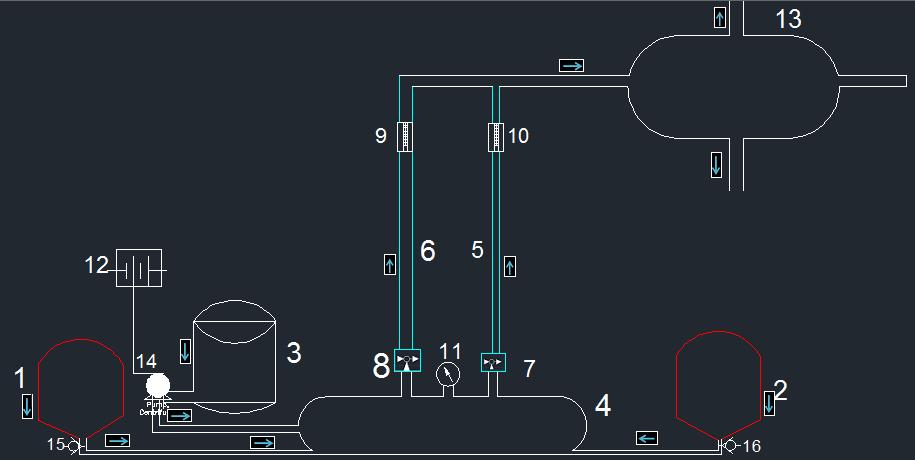
Unlike other flow loops built by researchers which uses air and water for liquid loading experiment, the UAC Excellence flow loop utilizes Liquefied petroleum gas (LPG) and water as a near reservoir fluids for multiphase flow experiment to study multiphase flow behaviours that lead to loading in gas wells. In doing this, certain production conditions experienced in gas wells were adopted to study flow behaviour in 0.37 inch tubing (Figure. 2). The flows of gas as a continuous phase followed by the introduction of water as entrained particle during the stabilized flow phase were adopted. The flow experiment started with the introduction of the LPG from the gas pressurized vessels into the wellbore section while keeping the inflow tubing valves closed for pressure to build up in the wellbore section. At 120 seconds, the inflow tubing valves were opened for gas to flow through the tubing to the flow meter and up to the vent section to obtain a stabilized annular flow in the tubing. At stabilized flow of 300 seconds with LPG, 16% of water cut, followed by 33 % and 50% were sprayed into the wellbore section to produce multiphase flow (gas and water) in the flowing system. The pressure of the wellbore at stabilized flow on multiphase flow was recorded. As the multiphase production continued, the flow regimes, the wellbore pressures and other noticeable conditions were recorded at 600 seconds and 900 seconds with camera, flow meters and pressure gauge until the end of the flow cycle as presented in the results.
.
Fig.1: UAC Excellence Flow Loop Schematic

Table .1: Summary of UAC Excellence Flow Loop 1
Gas Reservoir 1 2 Gas Reservoir 2 3 Water Reservoir 4 Wellbore Section 5 0.37 inch tubing 6 0.47 inch tubing 7 Wellbore control valves 1 8 Wellbore control valves 2 9 Flow Metre 1 10 Flow Metre 1 11 Downhole pressure gauge 12 12 Volt DC battery 13 Vent section 14 Centrifugal Pump 15 Gas reservoir 1 control Valve 16 Gas reservoir 2 control Valve
3. RESULTS
Fig.2: Flow Rate and Water Cut of Flow Time Interval for 0.37 inch Tubing
International Journal of Engineering Research and Reviews ISSN 2348-697X (Online)
Vol. 9, Issue 4, pp: (1-7), Month: October - December 2021, Available at: www.researchpublish.com
Figure 2 is the percentile result of the multiphase flow rate and the water cut obtained in 0.37 inch tubing during the flowing time of 0-300 seconds, 300-600 seconds and 600-900 seconds
PRESSURE (Psi)
2.5
2.3
2.1
1.9
1.7
1.5
2.7 0.24 0.25 0.26 0.27 0.28 0.29 0.3 0.31 0.32
FLOW RATE (SCF/m)
Fig. 3: Flow Rate and Downhole Pressure relationship for 0.37 inch Tubing
Figure 3 is the result of the flow rate and downhole Pressure relationship for 0.37 inch tubing obtained by plotting the experimental flow rates and downhole pressures variable
WATER CUT (%)
Fig.4: Temperature and Water cut relationship for 0.37 inch tubing
International Journal of Engineering Research and Reviews ISSN 2348-697X (Online) Vol. 9, Issue 4, pp: (1-7), Month: October - December 2021, Available at: www.researchpublish.com
Figure 4 is the result of the temperature and water cut relationship for 0.37 inch tubing obtained by plotting the experimental temperature and water cut variables.
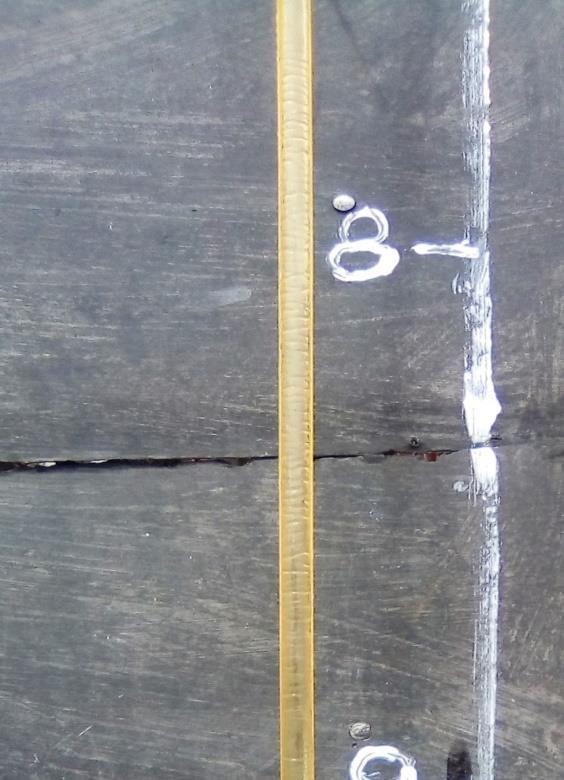
Fig.5: Experimental Visualized Annular flow
Figure 5 is the result of the experimental visualized annular flow obtained by close observation of the flow behaviour in the tubings at 0-300 seconds of production of the multiphase fluids.


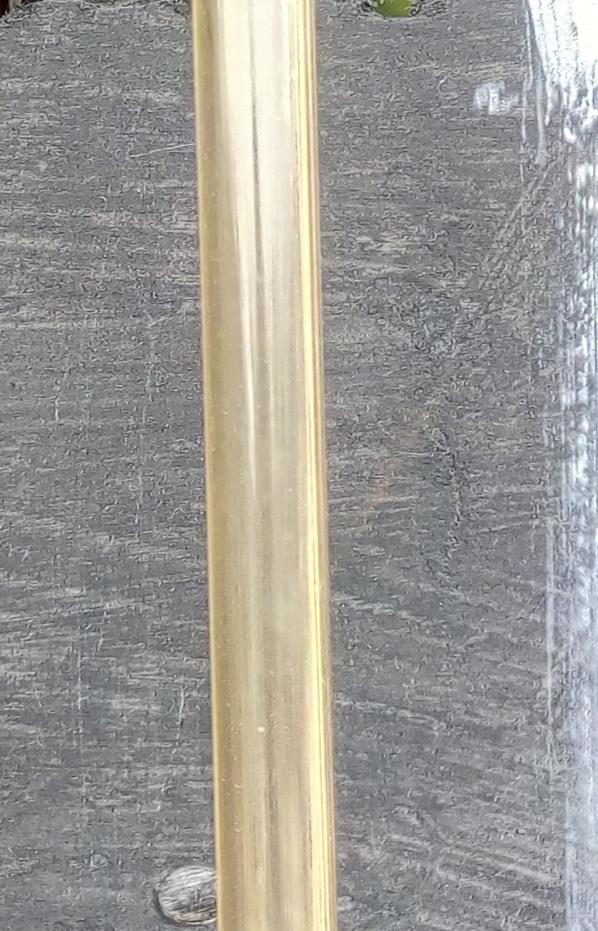
Fig.6: Experimental Visualized Mist flow
Figure 6 is the result of the experimental visualized Mist flow obtained by close observation of the flow behaviour in the tubing at 600 seconds of production of the multiphase fluids.
Research Publish Journals
Vol. 9, Issue 4, pp: (1-7), Month: October - December 2021, Available at: www.researchpublish.com
Fig.7: Experimental Visualized Slug flow
Figure 7 is the result of the experimental visualized slug flow obtained by close observation of the flow behaviour in the tubing at 900 seconds of production of the multiphase fluids
4. DISCUSSION
The discussion considers the analysis of the relationships of the data/variables obtained from the liquid loading experiment conducted on 0.37 inch tubing. They include; Flow Rate and Water Cut Relationship (Figure 2), Flow Rate and downhole Pressure Relationship (Figures 3), Temperature and Water Cut Relationship (Figure 4) and Experimental visualized flow regimes (Figures 5, 6 and 7).
The flow rate and water cut relationship depicts real time scenarios that are observed in a live producing field. From Figure 2, three stages of percentage ratio of the multiphase flow which spanned from 0-300 seconds, 300-600 seconds, and 600-900 seconds are identified. In stage 1, the flow rate is higher than the inflow water cut. In stage 2, the water cut in the system gradually equates the flow rate. In stage 3, the water cut is higher than the flow rate. These three stages also correspond in time intervals with the visualized flow regimes in Figures 5,6and 7 respectfully. Stage 2 shows the onset of liquid loading in the tubing accompanied with the collection of ring like liquid films on the wall of the tubing. Stage 3 indicates liquid loading in transition in the tubing accompanied with heavy downward fall of the liquid in cluster shapes. These stages represent the different flow regime a producing gas well goes through before it the effect of loading becomes noticeable.
The flow rate and down-hole pressure relationship were studied and the resulting plot is as shown in Figure 3. From the plot, a smooth decline in pressure is notice at the 2.5 psi and flow rate of 0.259 scf/m. This shows that liquid loading affect pressure significantly at the onset, but gradually affect production rate till a point it drops to a none economical level. Figure 3 also show increase in flow rate from 0.245scf/m to 0.294 scf/m between the pressures of 1.9 psi and 2.5 psi. Above these values, the curve exhibits decline trend which indicates the onset of liquid loading in tubing
From the Water cut and down-hole temperature relationship (Figure 4), the wellbore system was observed to display cooling behaviour as the water cut increases followed by temperature decreased to 5 0F. Again, Cooling was also observed in the vent section of the flow loop which changes to crystalline structure on deposition on the ground. During

International Journal of Engineering Research and Reviews ISSN 2348-697X (Online)
Vol. 9, Issue 4, pp: (1-7), Month: October - December 2021, Available at: www.researchpublish.com
the experiment, much turbulent flow was noticed in the tubing (Figures 6 & 7) as the temperature decreases. This shows that temperature of the production tubing is also a control parameter for liquid loading occurrence in tubing, and this also depend largely on the amount of water cut present in the well at a time interval.
Figures 5, 6 and 7 shows the three flow regimes that were captured during the experiment in 900 seconds, the annular flow regime was first observed, followed by the Mist flow and finally the slug flow. These flow regimes represent what happens in a producing gas well before it finally loadup to the point it seizes gas production.
5. CONCLUSION
The challenges posed by liquid loading in gas wells have gained wide attention, and the need for solutions for better understanding of the loading concept are in search of. To this end, the following conclusions are made from this paper;
1. Liquid loading facility for gas and water phases have been successfully built and used for studying multiphase flow behavours in 0.37 inch tubing
2. The gap created by the lack of facility for studying multiphase behaviours that leads to liquid loading in production tubing in Nigeria has been achieved in this paper (Figure 1)
3. The analysis of integrated multiple variables from the experimental study of the flow loop have provided a new approach to the understanding of the concept of liquid loading in gas well.
4. Three flow regimes that accompany liquid loading have been experimentally archived with UAC Excellence flow loop (Figures 5, 6 and 7)
5. The UAC Excellence flow loop facility built in this paper, the first in Nigeria, will serve as new practical equipment for the study of liquid loading in smaller diameter tubings.
REFERENCES
[1] Ardhi, H., Lumban G. (2016). Modeling Two-Phase Pipe Flow In Liquid Loading Gas Wells Using The Concept of Characteristic Velocity
[2] Dousi, N., Veeken, C.A.M. and Currie, P.K. (2006). Numerical And Analytical Modelling of The Gas Well Liquid Loading Process, SPE Production & Operations, Vol. 21, Issue 04, Pp. 475-482, Https://Doi.Org/10.2118/95282-PA
[3] Guo, B., Ghalambor, A., Xu, C. (2006). A Systematic Approach to Predicting Liquid Loading In Gas Wells SPE Production And Operation 21 (1): 81-88. SPE-94081-PA Http://Dx.Doi.Org/10.2118/94081-Pa
[4] Lea, J F., Nickens, H V., Wells, M. (2003). Gas Well Deliquification-Solution to Gas Well Liquid Loading Problems. Houston, Texas: Gulf Professional Publishing (Reprint).
[5] Lea, James F. And Nickens, Henry V (2004). Solving Gas‐Well Liquid‐Loading Problems,”Paper SPE 72092, Distinguished Author Series, JPT
[6] Limpasurat A., Valko, P. And Falcone G (2015). A New Concept of Wellbore-Boundary Condition For Modeling Liquid Loading In Gas Wells, SPE Journal, Vol. 20, Issue 03, Pp. 550-564, Https://Doi.Org/10.2118/166199-PA.
[7] Matt, M. (2019). An Investigation into the Mechanism Of Liquid Loading in Small-Diameter Vertical Pipes
[8] Turner, R G., Hubbard, M G., Dukler, A E. (1969). Analysis and Prediction of Minimum Flow Rate For Continuous Removal Of Liquids From Gas Wells Paper SPE 2198. JPT
[9] Veeken, K. Bakker, E And Verbeck, P. (2003). Evaluating Liquid Loading Field Data and Remedial Measures, Presented at the 2003 Gas Well De-Watering Forum Denver, 10, March 3-4.
[10] Xiaolei Liu, Gioia Falcone And Catalin T. (2017). Liquid Loading In Gas Wells: From Core-Scale Transient Measurements to Coupled Field-Scale Simulations, Journal of Petroleum Science And Engineering Pp 1056-1066.
[11] Xiuli Wang, Michael Economides (2010). Advanced In Natural Gas Engineering, Pp 115-169
[12] Zhang, H., Falcone, G., Teodoriu, C. (2010). Modeling Fully-Transient Two-Phase Flow in The Near-Wellbore Region During Liquid Loading in Gas Wells, Journal Of Natural Gas Science & Engineering, Vol. 2.
