International Journal of Civil and Structural Engineering Research ISSN 2348-7607 (Online) Vol. 9, Issue 2, pp: (16-26), Month: October 2021 - March 2022, Available at: www.researchpublish.com
Wind Mill Reliability: Determining TornadoWind Force Coefficients for Thin-Cylinder Structures with Computer Modeling
Quentin S. Ragan1, R. Panneer Selvam21Graduate Student, 2University Professor of Civil Engineering University of Arkansas, Fayetteville, Arkansas
Abstract: A two-dimensional (2D), Computational Fluid Dynamics (CFD) model was used to study tornado-wind force interaction with a smooth, thin-cylinder structure having a radius less than the tornado radius and little roof area. They are widely used as wind turbine support towers in tornado-prone areas. The Navier-Stokes equations were approximated with a Finite-Difference method. Simulations were performed to determine the minimum required grid resolution to prevent divergence of the program, replicate known straight-wind force coefficients, and determine tornado-wind force coefficients. The ratio of the core, forced-vortex tornado radius to the cylinder diameter (rcore/D) was increased with constant tornado and translation velocities to determine the tornado drag and lift force coefficients (Cd and Cl). The rotational velocity strength (Vtan) and rcore were then simultaneously increased to determine their effects on Cd and Cl. Tornado-wind force coefficients Cd and Cl were corrected for velocity and combined to determine a single tornado-wind force coefficient (C). The combined coefficient was compared to published force coefficients, including ASCE 7, for straight-wind. Force coefficients for tornados approached constant values when rcore exceeded 15D. Tornado-wind force coefficients were 2-3 times the published values for straight-wind.
Keywords: Tornado Wind, Force Coefficient, CFD, Thin-Cylinder.
I. INTRODUCTION
Catastrophic forces of nature from rain, wind, wave, hail, and earthquake have produced challenges in the stability of the built environment. The Insurance Information Institute (III) reported that up to 80% of insured, inflation-adjusted monetary losses were due to hurricanes, tropical storms, and convective events (severe storm, hail, tornado, flash flood, and lightning). Events including tornadoes comprised 40% of losses, with an increasing trend in cost . Understanding the effects of these forces clearly benefits the built environment and can save lives.
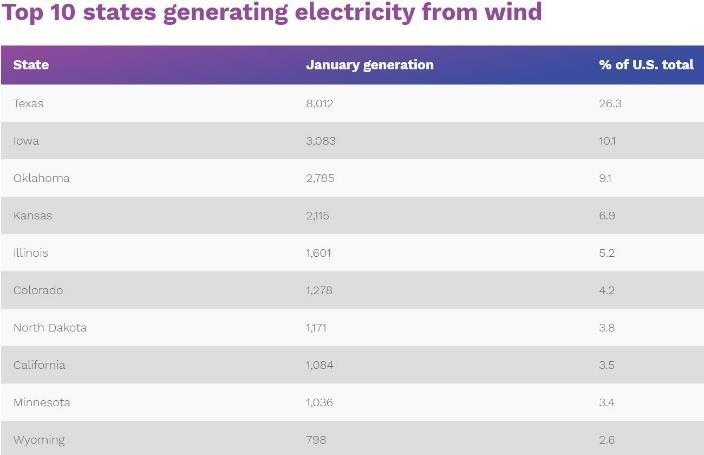
Wind-generated energy is viewed as a cleaner, viable alternative to fossil-fuel produced energy. However, as shown in Fig 1 below, wind turbines are located in states with the highest vulnerability to tornados precisely because of the wind conditions in those states. Since safe electricity production is a necessary requirement for modern life and for national security during catastrophic events such as tornados, design of wind-generated energy facilities for tornado winds would help provide consistent, clean energy during normal times and after catastrophic events.
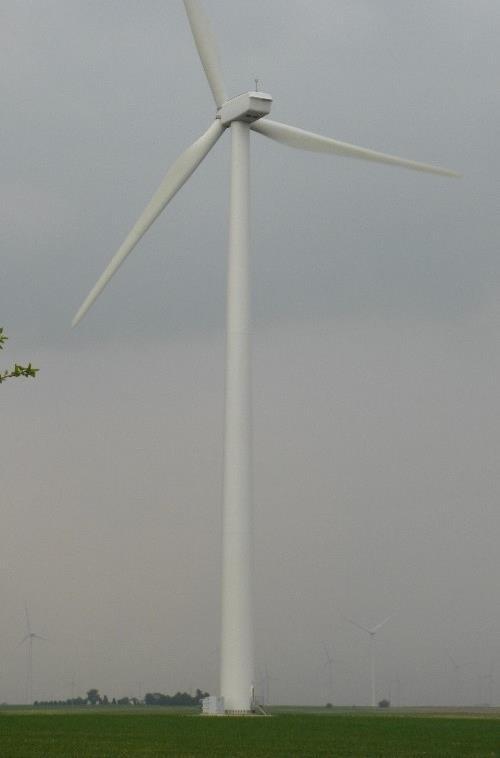
The primary structural component of a wind-turbine facility is the support tower, which as shown in Fig 2 below is a thin-cylinder structure. Thin-cylinder structures are absent appreciable roof area. The design of thin-cylinder structures for wind requires an understanding of the force coefficient in the basic fluid-structure interaction equation F=Cf*(1/2ρV2A). Force coefficients (Cf) reflect the variation of wind force with respect to the type of object. The density of the air (ρ), tornado-wind velocity (V), and cross-sectional area (A) of the structure are generally known, leaving Cf to be determined. Force coefficients for straight-wind interaction with a thin-cylinder has been reasonably understood for many decades. Force coefficients for tornado-wind interaction with a thin-cylinder have only recently been studied. This paper
International Journal of Civil and Structural Engineering Research ISSN 2348-7607 (Online) Vol. 9, Issue 2, pp: (16-26), Month: October 2021 - March 2022, Available at: www.researchpublish.com
focuses on tornado-wind interaction with a thin-cylinder structure and seeks to predict a design force coefficient for such interaction, thus enabling engineers to design round, wind-turbine support towers to resist tornados.
II. TORNADO AND WIND-TURBINE TOWER CHARACTERISTICS
To predict tornado behavior, tornado characteristics, such as size (radii) and velocity, are necessary. These characteristics have been studied in the past.
Hoecker (1960, 1961) studied suspended tracers in the Dallas, Texas tornado of April 02, 1957. He estimated maximum tangential wind speed as 170 mph, translation at 27 mph, and upward vertical wind speed as 150 mph near the ground. Zero vertical velocity was observed in the inner core. Tangential speed dominated as the tornado came in contact with the ground and grew larger. Tornado radius at peak wind varied between 125 feet and 200 feet above the ground. Pressure at the center of the tornado was minimum with respect to the undisturbed pressure (60 millibars difference). Change in pressure was dramatic at the outer edge of the tornado. The sudden change in pressure resulted in the observed upward flow. The highest rate of change in pressure forces on a building occurred over the five seconds just prior to impact, with the forces on the walls as much as 30 times higher than forces due to straight winds.
Fig. 1: Top ten states for tornado occurrence (III 2016) and top ten states generating electricity from wind (www.chooseenergy.com).
Melarngo (1968) found that the translational velocity of a tornado vortex is well documented to range between five miles per hour to sixty-eight miles per hour (5 mph to 68 mph), with an average of forty-five miles per hour (45 mph). Maximum wind speeds have been estimated to vary between five hundred miles per hour (500 mph) down to sixty-five miles per hour (65 mph). Pressure differentials in tornados have been estimated to vary between 3% and 10%.

International Journal of Civil and Structural Engineering Research ISSN 2348-7607 (Online) Vol. 9, Issue 2, pp: (16-26), Month: October 2021 - March 2022, Available at: www.researchpublish.com
Mehta et al. (1976) used building damage information and material resistance and back-calculated the wind speeds in the tornado outbreak of April 3-4, 1974. Their engineering analysis concluded that wind speeds in the tornado outbreak were generally less than the upper bound values of 250-275 mph that were previously estimated. Wind, not atmospheric pressure change, was the governing cause of building failure. Correlation of damage to wind speed was problematic for wind speeds exceeding 175 mph.
In recent years, meteorological methods of determing tornado characteristics have been used. A compilation of tornado characteristics was produced by Karstens et al (2010). Two primary means of recording tornado characteristics were employed: Hardened Tornado In-Situ Pressure Recorder (HITPR) and Mobile Mesonet Stations.
The May 03, 1999 tornado that tracked through Oklahoma City, Oklahoma was measured via dopplar radar. Burgess et al (2002) reported that the tornado diameter was 300 meters at ground level at the start of their analysis, narrowed to less than 200 meters wide then widened to 200-300 meters wide at maximum, low-level wind speed. Diameters aloft were generally higher. Kosiba and Wurman (2010) showed that the maximum, axisymmetric winds of the 1998 Spencer, South Dakota tornado reached 80 m/s with a radius of up to 250 m. The variation in tangential winds with respect to tornado radius closely resembled the Rankine, Modified Rankine, and Burgers Rott tangential wind profiles. They also showed that the radial wind inflow into the tornado decreased as the tornado matured in time. Rotunno (2013) cited work by Alexander and Wurman (2008) and indicated that a median tornado has a radius of maximum wind of 150 meters (500 feet), a median tornado-wind speed of 55-60 m/s (123-134 mph), tornado-wind speeds at the 25th and 75th percentiles of 50 m/s (112 mph) and 80-85 m/s (179-190 mph) respectively, and minimum and maximum wind speeds of 20 m/s (45 mph) and 135 m/s (302 mph) respectively. Maximum intensity is in the lowest few hundred meters. Kosiba and Wurman (2013) and Kosiba et al (2014) extracted approximate diameters of tornados from meteorological data and showed that tornado radii varied between 30 m (98 ft) up to 400 m (1,312 ft).
Brooks (2004) compared tornado-wind velocity and radius parameters to F-Scale. He found that tornado width doubled with each F-Scale level. Correllating path width to velocity from Brooks (2004) would be difficult for EF scale without further information. However, if path width from F-Scale is assigned to a corresponding EF-Scale value based on velocity similarities, path width closely resembles that given in the other literature. Table 1 below makes this approximate correlation. Translational velocity varied widely for various tornado sizes, ranging from 2.3-20 m/s (5-45 mph).
TABLE I: SUMMARY OF TORNADO-WIND VELOCITY AND RADIUS VS. EF-SCALE
EF-Scale
Tornado Rotating Velocity (m/s)
Torndao Rotating Velocity (mph)
Path Width (m) Path Width (ft)
EF0 29.1-38.0 65-85 ~30 98.4
EF1 38.4-49.2 86-110 ~60 197
EF2 49.6-60.4 111-135 ~100 328
EF3 60.8-73.8 136-165 ~130 427
EF4 74.2-89.4 166-200 ~200-500 656-1641 EF5 >89.4 >200 ~300+ 985+
Although these values may not perfectly represent actual tornado parameters due to the means used to extract the data, the research shows that translational, rotational, and radial-inflow velocities are known components of a tornado. Kosiba and Wurman (2010) indicated that radial-inflow velocity appeared to decrease to less than 1/10 of tangential velocity in a mature tornado, similar to Hoecker (1960, 1961). Therefore, primary winds are likely from translation and tangential velocity. Without radial inflow and a minimal horizontal roof surface, vertical force on a thin cylinder due to tornadowinds may be minimal. Using the numbers from Table 1, the ratio of tornado-wind velocity to translational-wind velocity (Vtan/Vtrans) could therefore vary between 1.45 and 38.6, or approximately 1.5 to 40.
In the case of a Wind Turbine Tower, the tower diameter was field measured by the author to be thirteen feet (13ft) or less, or five meters (5m) or less. With the tornado values in Table 1 above, tornado size with respect to structure diameter (rcore/D) is 3 to 50.
International Journal of Civil and Structural Engineering Research ISSN 2348-7607 (Online) Vol. 9, Issue 2, pp: (16-26), Month: October 2021 - March 2022, Available at: www.researchpublish.com
III. COMPUTER MODELING OF TORNADOS
Numerical modelling of wind forces began in the 1970’s with various researchers concentrating on straight-wind forces. Few researchers studied rotational-wind forces such as tornados though, in particular tornado-structure interaction.
Wilson (1977) used computer modelling to study tornado-interaction with a structure. A two-dimensional (2D) Eulerian hydrodynamic code was used to compute the force and pressure for seven runs: four for a translating tornado and three for a stationary vortex. The Rankin Combined Vortex Model (RCVM) was used for the tornado wind-field model. Kinematic viscosity and turbulence were not considered. In addition, a coarse grid was used and was not sufficient to report an accurate result for the force and pressure coefficients. No research with respect to thin-cylinder objects was reported. To date, other research outside of UARK has not been found for numerical simulation of the interaction of tornado-wind forces with a thin-cylinder structure.
UARK has studied different numerical techniques using Computational Fluid Dynamics (CFD) to determine which are able to accurately determine force coefficients for wind-interaction with buildings. Two and three-dimensional (2D and 3D) simulations for straight-wind and tornado-wind interaction with buildings have been performed. However, a limited number of studies included thin-cylinder structures. Table 2 below partially summarizes the 2D work performed at UARK to determine force coefficients for straight-wind and tornado-wind interaction with thin cylinders. The table shows that a force coefficient for interaction between a tornado and a thin-cylinder structure is not well defined, and tornado-wind velocity, translation-wind velocity, and structure size with respect to tornado size do not reflect the tornado characteristics noted above. As a result, a study was conducted to determine the force coefficient (Cf) for tornado-wind interaction with a thin-cylinder structure using the tornado and structure characteristics noted above.
The model used for Selvam et al (2002) and Millet (2003) will be used here. The specifics of the model have been thoroughly covered in these two documents. Additionally, the intricacies of the model have been covered in documents leading up to the publication of the two aforementioned documents. The model is used as developed here to determine whether it can reasonably predict the force coefficients for tornado interaction with a thin-cylinder structure.
TABLE II: SUMMARY OF UARK WORK FOR THIN-CYLINDER STRUCTURES
Tornado Radius (rcore/D) Ratio (Vtan/Vtrans)
Researcher(s) Force Coefficients Cx (Cd), Cy (Cl) (Tornado Travel in x direction)
NA 1.0 Selvam (1998) 1.34 to 1.77 0.0 3 3.5 Selvam et al (2002) Cx>Straight Wind Straight Wind=1.4 Cy>Straight Wind 3 3.5 Selvam and Millet (2003, 2005) Velocity Flow Study Velocity Flow Study 1 to 4 3.0 Selvam and Gorecki (2012) Coef. Trend Increasing Coef. Trend Increasing
The model is two-dimensional (2D). As reported in Strasser (2015), argument exists that wind, flow-field study for Reynolds number above 190-300 should not be performed in 2D because vortex shedding becomes three dimensional (3D). However, this argument fails to recognize the unsteady, turbulent nature of tornado interaction. Strasser (2015) showed that vortex shedding is destroyed when the tornado grows in size with respect to the thin cylinder; therefore, vortex shedding is likely not a concern for tornado interaction with a thin-cylinder. Also, ASCE 7 (2016) tabulates a single coefficient for round structures for straight-wind forces. In the case of a Wind Turbine Tower, wind forces would be applied to a vertical surface. The top, horizontal surface of the tower would be negligible with respect to tower lateral stability. As mentioned earlier, tornado-wind forces were found to be predominately rotational, which would affect the vertical surfaces. Therefore, a 2D analysis could suffice for tornado-wind research.
The 2D model uses a Finite Difference Method (FDM) solution technique to solve the Navier-Stokes equations. A semiimplicit procedure is used. The solution of the Navier-Stokes equations is sequential and uses a Preconditioned Conjugate Gradient (PCG) method as reported in Selvam (1998). Large Eddy Simulation (LES) turbulence model is used per Selvam and Millet (2003). Visualization is per TecPlot software.
International Journal of Civil and Structural Engineering Research ISSN 2348-7607 (Online) Vol. 9, Issue 2, pp: (16-26), Month: October 2021 - March 2022, Available at: www.researchpublish.com
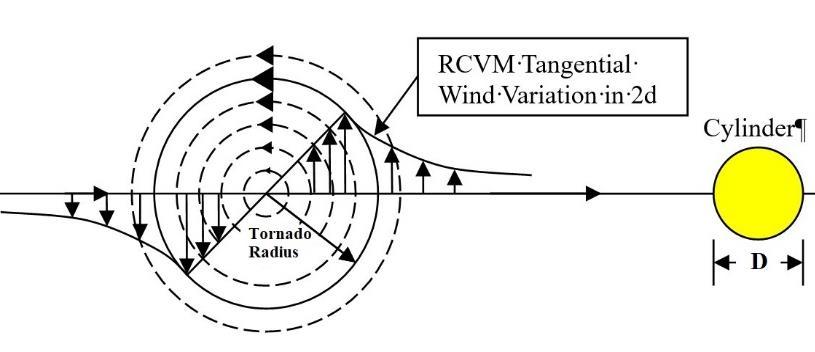
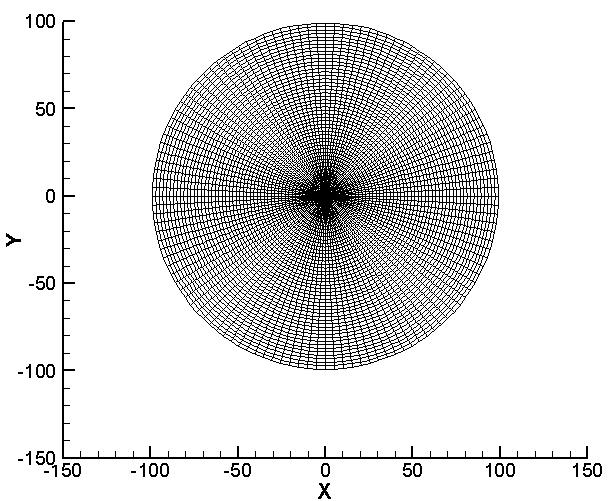
The Rankine Combined Vortex Model (RCVM) shown in Fig 3 was used in the 2D computational domain to represent the increase and dissipation of the tornado-wind velocity, also called the tangential velocity (Vtan), as the tornado-winds approach, interact with, and move beyond the thin-cylinder structure with a D diameter The RCVM model combines a core, forced-vortex region of radius rmax=rcore and a free-vortex region. The core, forced-vortex region represents the actual size of the tornado. Fig 3 also shows how the model would interact with the structure in the 2D computational domain as the rotating tornado translates through the domain. The wind flow-field is generated and modeled in a 2D, circular-shaped, computational domain with the cylinder at the center as shown in Fig. 4.
Fig. 3: (a) Diagram of the RCVM showing the variation of tangential tornado velocity with respect to the distance from the center of the tornado. (b) Diagram of the RCVM tangential wind variation as the tornado translates through the 2D computational domain toward the cylinder.
Parameters used in the model are non-dimensional. The computer input file includes the number of points around the cylinder, total time of tornado translation, rcore, Vtrans, free-stream velocity, tornado rotation constant a for calculation of Vtan, and kinematic Viscosity (). Kinematic Viscosity is a function of Reynolds number (Re), velocity (V), and cylinder diameter (D). Grid spacing next to the cylinder was as low as 0.003D. The largest grid spacing at the outer edge of the computational domain was 2.0 units. Selvam (2008) found that grid spacing close to the cylinder should be 0.003D but could vary away from the cylinder. The diameter of the cylinder is taken as the reference length (D/Lref=1.0), and Length (L), velocity (U and V), and time (t) were: L* = L/Lref, U* = U/V, and t* = tV/Lref
The center of the tornado begins at a "time lag" before the cylinder and translates along the x-axis, coinciding with the cylinder at approximately one-half of total translation time. For each time unit the tornado center is specified, velocities in the computational domain are initiated based on values from the RCVM model, translational velocity, and boundary conditions. A no slip condition is used at the cylinder; therefore, velocity at the cylinder approaches zero. Initial velocities are determined as shown in Fig 4
(a) (b) (a) (b)
For Vx: Vx = (Vtan - y) for rcd rcore
Vx = (Vtan – Cy) for rcd rcore

For Vy: Vy = (x - Vtant) for rcd rcore
Vy = (x – Vtant)C for rcd rcore
Vy = [Vtany + (x – Vtanxt)C] for rcd rcore
Where: C = r 2 core/r2 r 2 = (x-Vtan)2 + y2
Vtan = Tangential Velocity Specified by the RCVM rcd = Radius of computational domain boundary rcore = Radius of forced vortex region of the tornado
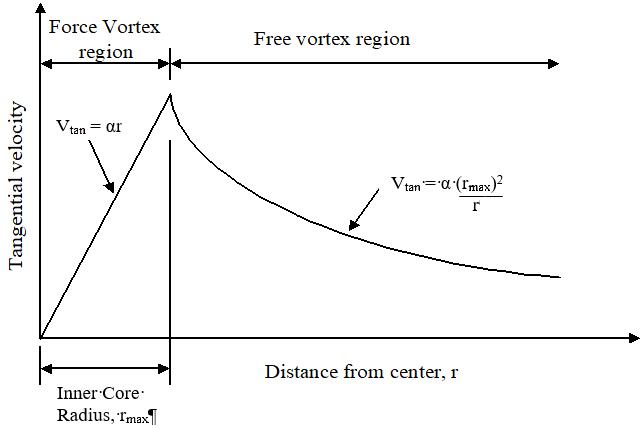
Fig. 4: (a) Representative grid for the computational domain. The cylinder is centered. (b) Initial velocity assumptions.
Error is inherent in computational fluid dynamic modelling. Two significant errors can occur from using a FiniteDifference model: rounding error and discretization error. Rounding error occurs from constant rounding of numbers to
International Journal of Civil and Structural Engineering Research ISSN 2348-7607 (Online) Vol. 9, Issue 2, pp: (16-26), Month: October 2021 - March 2022, Available at: www.researchpublish.com
some significant figure. Discretization error results from grid spacing. Finer grids minimize discretization error but require robust computational capacity. To minimize both errors, the program iterates the solver methods for the NavierStokes equations sequentially until either an error tolerance has been achieved or the number of iterations reaches a specific maximum number. Error is measured by the sum of the errors at each point. If the sum of the errors is higher than the tolerance [error tolerance = (number of grid points)x(0.0001)], another program iteration is performed until error is reduced or the maximum number of iterations has been reached (51 iterations). If the program reaches the specified maximum number of iterations too many times, diffusion of the program results is possible, and the calculations do not converge to finite numbers at each point in the computational domain
The program outputs two data files: a file of velocity and pressure at each node in the computational domain that can be used for visualization in TecPlot, and another file with force coefficients Cx and Cy at each time unit. The force coefficients are computed with the following equations:
Air density is , A is area of obstruction, V is reference velocity, and the forces Fx and Fy are computed by integrating the pressures around the cylinder. ΔP is the reference pressure. Drag and lift coefficients are Cx and Cy respectively (Cd=Cx and Cl=Cy). Two velocities are considered for determination of forces on the cylinder: translation (Vtrans) and rotation (Vtan) from the RCVM. The resultant velocity at the cylinder will be a combination of these two.
The ability of a computer model to achieve a reasonable result is always suspect unless the model has been tested for performance though. Computational domain parameters such as domain size and grid discretization were investigated by Millet (2003), but the study was limited to the technology of the time. Additionally, the program was previously used for small-diameter and fixed-velocity tornados. Verification of the model's ability to execute large-diameter tornados and increasing velocity was needed for this work. Therefore, computational domain parameters were varied independently to determine their effect on the force coefficients. Table 3 shows the grid variation in the computational domain.
TABLE III: COMPUTATIONAL DOMAIN PARAMETER STUDY
Parameter
Grid Size (Points around cylinder x Points away from cylinder) Domain Radius
Domain Radius 121x38-121x78 11.12-91.12 Points Around Cylinder 61x82-289x82 99.12 Points Away from Cylinder 121x82-121x127, 181x82-181x127, 289x82-289x127 99.12
The parameter study considered a cylinder diameter D=1.0, a constant straight-wind or translational velocity of Vtrans=1.0, and constant tornado-wind or rotational velocity of Vtan=3.0 consistent with Selvam and Gorecki (2012). A tornado core radius rcore=15D was used. Previous tornado radii used were well below 5.0 units, so the parameter study reflects the anticipated increase in to core equals Vtan. Drag and lift coefficients (Cd=Cx and Cl=Cy) are compared
The parameter study revealed that the ratio of the computational domain radius to tornado radius should be 5:1 or more for modelling of the forced and free flow regions of the tornado. At least 121 or more points around the cylinder should be used. Spacing close to the cylinder should be between 0.001D-0.003D. Spacing away from the cylinder should be such that numerical diffusion does not occur. Ratio of domain radius to total time could be less than a 2:1 ratio.
IV. STRAIGHT-WIND MODELING
The computer model was first used to determine the change in drag and lift force coefficients (Cd and Cl) with respect to increasing Reynolds number (Re) for straight-wind. Viscosity was fixed at approximately equal to the viscosity of air (0.000126). Reynolds number increased from Re=100 to Re=100,000. Since viscosity and cylinder diameter were constant, fluid velocity varied with change in Reynolds number (Vt=0.00126 to Vt=1.19700). Grid resolution was extremely fine (289x149) to capture the drag coefficient as close as possible to published values. The results were limited to Re≤100,000 due to discretization or other errors unknown at this time. The results were compared to the variation of drag coefficient (Cd) with respect to Reynolds number from Cengel and Cimbala (2005) and Liu (1991). The values were

International Journal of Civil and Structural Engineering Research ISSN 2348-7607 (Online) Vol. 9, Issue 2, pp: (16-26), Month: October 2021 - March 2022, Available at: www.researchpublish.com
comparable up to approximately Re=20,000, at which time the computer simulation overestimated the magnitude of Cd by 1/3. Overestimation was possibly due to grid resolution before and after the cylinder.
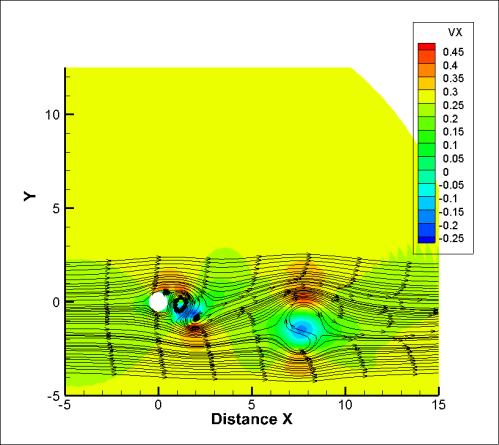
Fig 5 shows that, before Re=20,000, oscillating vortex shedding begins to occur behind the cylinder in the simulation Fig. 5 shows a photograph of vortex shedding from Tsutsui and Igarashi (2002) for Re=15,000. Comparing the two figures shows that initiation of vortex shedding was similar for the same range of Re This was a limited comparison though. Further work on the model used can be studied in Selvam et al (2002) and Millet (2003). However, the limited comparison between the computer model and published values for drag on a cylinder appeared to show that the Finite Difference Model could be considered for straight-wind modelling.

(a)
(b)
Fig. 5: (a) Vortex shedding for velocity flow for Re = 20,000 in the simulation. (b) Stream flow around a cylinder for Reynolds number (Re) 15,000 from Tsutsui and Igarashi (2002).
V. TORNADO-WIND MODELING WITH INCREASING RADIUS
The computer model was next used to determine the change in drag (Cd) and lift (Cl) force coefficients with respect to increasing tornado size (radius). Grid refinement was much less than that used for straight-wind simulations because of computational efficiency and time. Translational-velocity and rotational-velocity were Vtrans=1.0 and Vtan=3.0 respectively, and Re=1,000. Cylinder diameter was D=1.0, and tornado radius (rcore) was increased until force coefficients core) increased to maintain a constant maximum velocity in the RCVM.
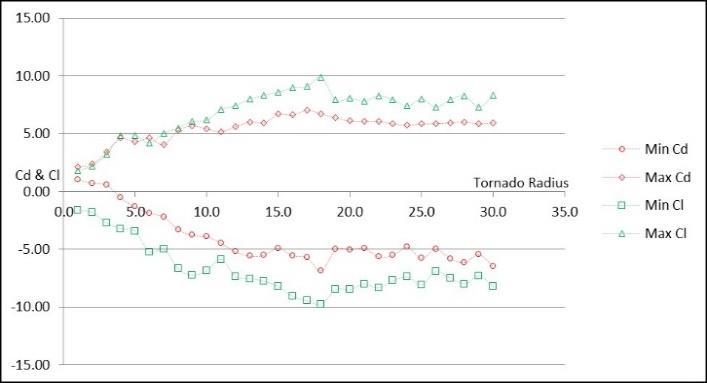
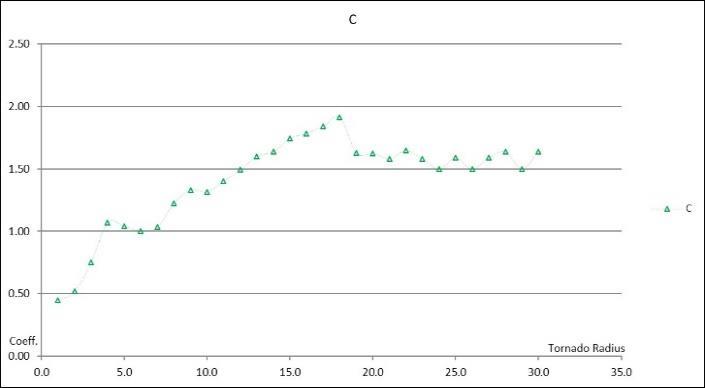
A trend in increasing drag and lift is obvious in Fig. 6 as the tornado radius increases. The force coefficients generally approached constant values when the tornado radius exceeded 15D to 18D. It should be noted though that velocity flow in the computational domain includes translational and rotational velocities (Vtrans and Vtan respectively). ASCE-7 (2016) defines one force coefficient for design of a thin-cylinder structure for straight-wind forces, not separate Cd and Cl. Therefore, the tornado-wind force drag and lift coefficients should be combined into one coefficient (C) for comparison. Furthermore, the resulting drag and lift force coefficients determined from the computer program use a velocity of Vtrans=Vref=1.0 for the coefficient equations. Since the actual velocity of the tornado does not equal 1.0, the velocity used for the force coefficient equations requires correction. This corrected velocity is called Vresultant to distinguish it from Vtrans=Vref . Defining Vresultant is tricky because of the varying nature of tornado flow in time. Cengel and Cimbala (2013) define Vref as the "upstream" velocity for straight-wind, implying that Vref should be measured some distance away from the cylinder, where velocity flow is not influenced by the cylinder. Discussion of the proper Vresultant will be left for a future paper. For the purposes of this work, inspection of the computer data for the case of Vtrans=1.0 and Vtan=3.0 revealed that an average tornado velocity could be Vresultant=2.5. Correcting the maximum drag and lift coefficients (Cd and Cl) for Vresultant=2.5 and combining the coefficients for translational and rotational velocities into a single C value results in the graphs shown in Fig. 6. The graph shows that the coefficient trended upward until a tornado radius of 15D18D, with C=1.50-1.60. At rcore≥12D, maximum C exceeds the force coefficient for straight-wind, generally shown to be as high as 1.4. The value C=1.91 may be an anomaly due to numerical diffusion or incorrect Vresultant calculation. The real value may be closer to the convergence of C=1.50-1.60. Similar results were observed in Strasser (2015).
International Journal of Civil and Structural Engineering Research ISSN 2348-7607 (Online) Vol. 9, Issue 2, pp: (16-26), Month: October 2021 - March 2022, Available at: www.researchpublish.com
(a) (b)
Fig 6: (a) Trend of unadjusted maximum drag and lift coefficients (Cd and Cl) for increasing tornado radius (Vtrans=1.0, Vtan=3.0, Vref=1.0). (b) Trend of maximum force coefficient (C) for increasing tornado radius.
VI. TORNADO-WIND MODELING WITH INCREASING VELOCITY
The computer model was then used to determine the change in drag and lift force coefficients as the ratio of rotational velocity to translational velocity increased (Vtrans/Vtan increasing). Previous studies in the UARK group used constant Vtrans/Vtan ratios and a constant cylinder dimension, so structure dimension maintained a similar proportionality to maximum velocities. This is not the case with real tornados. Increasing velocity increases Re though, possibly changing the dynamics of the wind-flow around the cylinder. However, Strasser (2015) showed that vortex shedding was destroyed for large-diameter tornados and low velocities. Therefore, wind flow is already highly unsteady for large-diameter tornados, so velocity increase simply continues the unsteady flow.
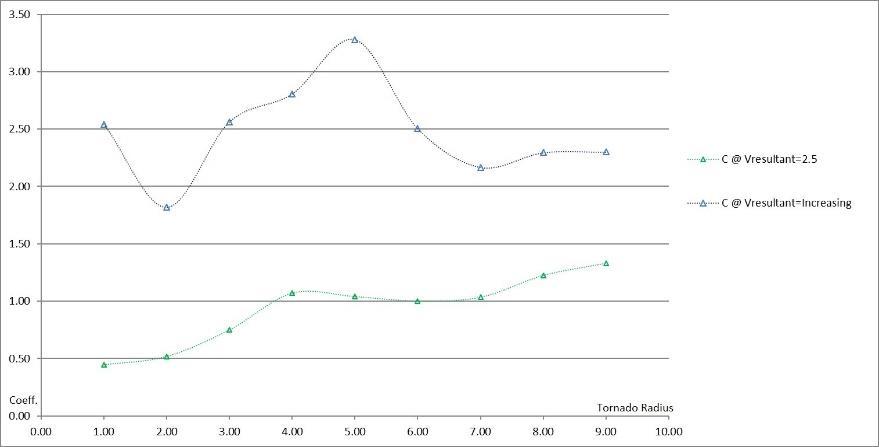
Grid refinement was again much less than that used for the straight-wind simulations because of computational efficiency and time; some of the simulations required days for completion. A constant Re=1,000 was used for computational simplicity. Translational-velocity was held constant at Vtrans=1.0, but rotational velocity Vtan, was increased by Fig 7 shows the trend of a combined force coefficient (C) for increasing tornado strength using a corrected reference velocity. The curve from Fig. 6 for increasing tornado radius with constant velocities is also shown for comparison. It can be seen that:
C=1.50-1.60 for increasing tornado radius but constant velocities. C=2.20-2.50 for increasing tornado radius and increasing tornado-wind velocity, as much as 67% higher
The graph for increasing rotational velocity is highly variable before rcore=6D. This may be due to the minimal size of the tornado, numerical diffusion in the program, and possibly inaccuracies in determining Vresultant. However, once the tornado radius exceeds rcore=6D, the trend in the force coefficient begins to replicate that for constant rotational velocity, albeit at a higher value. Further research is needed for the increasing velocity coefficient though
Fig 7: Trend of maximum force coefficient (C) for increasing tornado radius (Vtrans=1.0, Vtan=3.0, Vresultant=2.5) and for increasing tornado velocity and radius and consequently increasing Vresultant.
International Journal of Civil and Structural Engineering Research ISSN 2348-7607 (Online) Vol. 9, Issue 2, pp: (16-26), Month: October 2021 - March 2022, Available at: www.researchpublish.com
VII. COMPARISON OF TORNADO-WIND TO STRAIGHT-WIND COEFFICIENTS
The force coefficients for straight winds would not necessarily apply to interaction with rotating winds. However, some comparison is warranted.
ASCE 7 (2016) provides guidance for the definition of a thin-cylinder structure with respect to straight-wind forces. ASCE 7 (2016) shows that, for a smooth thin-cylinder with high-wind conditions, a condition most closely resembling that analyzed in this study, the force coefficient would likely be C=0.7. The ACSE values are primarily based on researched performed by MacDonald et al (1988, 1990), a study of wind loads on isolated circular storage bins, silos, and tanks. The study had uniform flow conditions with low turbulence, conditions not quite that of tornado winds
Roshko (1961) looked at wind flow at high Reynolds number for circular cylinders. Roshko’s work showed the trend of Cd from 1.2 to 0.3 to 0.7 as Re increased. He followed up with measurements of drag coefficients (Cd), base pressure coefficients (Cpb), and shedding frequency (S) for Reynolds numbers approaching 107. His experiments showed that for what he described as Supercritical and Transcritical Reynolds numbers (4.5x10⁵ ≤Re≤3.5x10⁶ and Re≥3.6x10⁶ respectively), the drag coefficient increased from around Cd=0.3 up to Cd=0.7 then leveled off This seems to imply that once wind flow around the thin cylinder becomes highly turbulent, the force coefficient changes little. He showed that the base pressure coefficient at the back of the cylinder approached Cpb=-0.85.
Previous three-dimensional work, particularly from Alrasheedi (2012) and Millet (2003), showed that tornado-wind force coefficients for building walls were one and one-half those for straight-wind and two times for roofs. Haan et al (2010) also showed that tornado force coefficients for buildings were at least one and one-half times those for straight-wind for walls and close to two or more for roofs.
As indicated previously, C=1.50-1.60 for increasing tornado radius but constant velocities, and C=2.20-2.50 for increasing tornado radius and tornado-wind velocity. These results appear to coincide with those from Alrasheedi (2012), Millet (2003), and Haan et al. (2010). When compared to ASCE 7 (2016) and Roshko (1961), this study appears to show that the force coefficients from tornado winds could be 2-3 times those for straight-wind for smooth thin cylinders. Similar results were observed in Strasser (2015). Dynamic effects were not considered here, but further treatment of the dynamic effects of tornado wind can be found in Strasser (2015).
VIII. CONCLUSIONS
A two-dimensional (2D), Computational Fluid Dynamics (CFD) model was used to study tornado-wind force interaction with a smooth, thin-cylinder structure having a radius less than the tornado radius and little roof area. They are widely used as wind turbine support towers in tornado-prone areas. The Navier-Stokes equations were approximated with a Finite-Difference method. Simulations were performed to determine the minimum required grid resolution to prevent divergence of the program, replicate known straight-wind force coefficients, and determine tornado-wind force coefficients. The ratio of the core, forced-vortex tornado radius to the cylinder diameter (rcore/D) was increased with constant tornado and translation velocities to determine the tornado drag and lift force coefficients (Cd and Cl). The rotational velocity strength (Vtan) and rcore were then simultaneously increased to determine their effects on Cd and Cl Tornado-wind force coefficients Cd and Cl were corrected for velocity and combined to determine a single tornado-wind force coefficient (C). The combined coefficient was compared to published force coefficients, including ASCE 7, for straight-wind. Force coefficients for tornados approached constant values when rcore exceeded 15D. Tornado-wind force coefficients were 2-3 times the published values for straight-wind. Dynamic effects were not considered here. Also, further work on tornado velocity and Reynolds number effects are also warranted, as the current research limited the Reynolds number and velocities due to computational efficiency.
REFERENCES
[1] Alrasheedi, N.H., 2012. Computer Modeling of the Influence of Structure Plan Areas on Tornado Forces, Ph.D. Dissertation, University of Arkansas Department of Civil Engineering, Fayetteville, Arkansas, USA.
[2] ASCE 7-16, 2017. Minimum Design Loads for Buildings and Other Structures, ASCE Standard ASCE/SEI 7-16, American Society of Civil Engineers, Reston, Virginia, USA
[3] Alexander, C.R. and Wurman, J., 2008. Updated Mobile Radar Climatology of Supercell Tornado Structures and Dynamics, Proceedings of the 24th Conference of Severe Local Storms Paper 24, American Meteorological Society, Boston, Massachusetts, USA.
International Journal of Civil and Structural Engineering Research ISSN 2348-7607 (Online) Vol. 9, Issue 2, pp: (16-26), Month: October 2021 - March 2022, Available at: www.researchpublish.com
[4] Brooks, H.E., 2004. On the Relationship of Tornado Path Length and Width to Intensity, Weather and Forecasting, vol. 19, pp. 310-319.
[5] Burgess, D.W., Massig, M.A., Wurman, J., Dowell, D. and Richardson, Y., 2002. Radar Observations of the 3 May 1999 Oklahoma City Tornado, Weather and Forecasting, vol. 17, pp. 456-471.
[6] Cengel, Y.A. and Cimbala, J.M., 2005, 2013. Fluid Mechanics: Fundamentals and Principles, McGraw-Hill, New York, New York, USA.
[7] Haan Jr., F.L., Balaramudu, V.K. and Sarkar, P.P., 2010. Tornado-Induced Wind Loads on a Low-Rise Building, ASCE Journal of Structural Engineering, vol. 136, no. 1, pp. 106-116.
[8] Hoecker, W.H., 1960. Wind Speed and Air Flow Patterns in the Dallas Tornado of April 02, 1957, Monthly Weather Review, Edited by James E. Caskey, United States Department of Commerce Weather Bureau, vol. 88, no. 5, pp. 168-180.
[9] Hoecker, W.H., 1961. Three-Dimensional Pressure Pattern of the Dallas Tornado and Some Resultant Implications, Monthly Weather Review, United States Department of Commerce Weather Bureau, vol. ??, no. ?, pp. 533-542.
[10] Karstens, C.D., Samaras, T.M., Lee, B.D., Gallus Jr., W.A. and Finley, C.A., 2010. Near Ground Pressure and Wind Measurements in Tornadoes, Monthly Weather Review, American Meteorological Society, vol. 138, pp. 2570-2588.
[11] Kosiba, K. and Wurman, J., 2010. The Three-Dimensional Axisymmetric Wind Field Structure of the Spencer, South Dakota, 1998 Tornado, Journal of the Atmospheric Sciences, vol. 67, pp. 3074-3083.
[12] Kosiba, K. and Wurman, J., 2013. The Three-Dimensional Structure and Evolution of a Tornado Boundary Layer, Weather and Forecasting, preliminary version.
[13] Liu, H., 1991. Wind Engineering: A Handbook for Structural Engineers. Prentice Hall, Upper Saddle River, NJ, USA.
[14] MacDonald, P.A., Kwok, K.C.S. and Holmes, J.D., 1988. Wind Loads on Circular Storage Bins, Silos, and Tanks: I. Point Pressure Measurements on Isolated Structures, Journal of Wind Engineering and Industrial Aerodynamics, vol. 31, pp. 165-188.
[15] MacDonald, P.A., Holmes, J.D. and Kwok, K.C.S., 1990. Wind Loads on Circular Storage Bins, Silos, and Tanks: II. Effect of Grouping, Journal of Wind Engineering and Industrial Aerodynamics, vol. 34, pp. 77-95.
[16] MacDonald, P.A., Holmes, J.D. and Kwok, K.C.S., 1990. Wind Loads on Circular Storage Bins, Silos, and Tanks: III. Fluctuating and Peak Pressure Distributions, Journal of Wind Engineering and Industrial Aerodynamics, vol. 34, pp. 319-337.
[17] Mehta, K.C., Minor, J.E. and McDonald, J.R., 1976. Wind Speed Analysis of April 3-4, 1974 Tornados, ASCE Journal of the Structural Division, vol. 2, ST9, pp. 1709-1724.
[18] Melaragno, M.G., 1968. Tornado Forces and Their effects on Buildings, Faculty Research, Kansas State University, Manhattan, Kansas.
[19] Millet, P.C., 2003. Computer Modeling of the Tornado-Structure Interaction: An Investigation of the Structural Loading on a Building, Master's Thesis, University of Arkansas Department of Civil Engineering, Fayetteville, Arkansas, USA.
[20] Roshko, Anatol, 1961. Experiments on the Flow Past a Circular Cylinder at Very High Reynolds Number, Guggenhiem Aeronautical Laboratory, California Institute of Technology, Pasadena, California, USA.
[21] Rotunno, R, 2013. The Fluid Mechanics of Tornados, Annual Review of Fluid Mechanics, vol. 45, pp. 59-84.
[22] Selvam, R.P., 1998. Computational Procedures in Grid Based Computational Bridge Aerodynamics, Bridge Aerodynamics, pp. 327-336.
[23] Selvam, R.P., Roy, U.K., Jung, Y. and Mehta, K.C., 2002. Investigation of Tornado Forces on a 2D Cylinder Using Computer Modeling, Wind Engineering: Proceedings of the National Conference of Wind Engineering (NCWE 2002), Roorkee, India, Edited by K. Kumar, Phoenix Publishing House, New Delhi, India, pp. 342-353.
Publish Journals
International Journal of Civil and Structural Engineering Research ISSN 2348-7607 (Online) Vol. 9, Issue 2, pp: (16-26), Month: October 2021 - March 2022, Available at: www.researchpublish.com
[24] Selvam, R.P. and Millet, P.C., 2003. Computer Modeling of Tornado Forces on a Cubic Building Using Large Eddy Simulation, Journal of the Arkansas Academy of Sciences, vol. 57, pp. 140-146.
[25] Selvam, R.P. and Millet, P.C., 2003. Computer Modeling of the Tornado Forces on Buildings, Journal of Wind Engineering and Structures, vol. 6, pp. 209-220.
[26] Selvam, R.P., 2008. Developments in Computational Wind Engineering, Journal of Wind & Engineering, vol. 5, no. 1, pp. 47-54.
[27] Selvam, R.P. and Gorecki, P., 2012. Effect of Tornado Size on Forces on Thin 2D Cylinder, Proceedings of 3rd American Association of Wind Engineering (AAWE) Workshop, Hyannis, Massachusetts, USA.
[28] Strasser, M.N., 2015. The Aerodynamic and Dynamic Loading of a Slender Structure by an Impacting TornadoLike Vortex: The Influence of Relative Vortex-to-Structure Size on Structural Loading, Ph.D. Dissertation, University of Arkansas Department of Civil Engineering, Fayetteville, Arkansas, USA.
[29] Tsutsui, T. and Igarashi, T., 2002. Drag Reduction of a Circular Cylinder in an Air Stream, Journal of Wind Engineering, vol. 90, pp. 527-541.
[30] Wilson, T., 1977. Tornado Structure Interaction: A Numerical Simulation, Report: UCRL-52207, Distribution Category: UC-11, 80, Lawrence Livermore Laboratory, University of California, Livermore, California, USA.
