ISSN 2348-1196 (print)
International Journal of Computer Science and Information Technology Research ISSN 2348-120X (online) Vol. 8, Issue 3, pp: (195-200), Month: July - September 2020, Available at: www.researchpublish.com

ISSN 2348-1196 (print)
International Journal of Computer Science and Information Technology Research ISSN 2348-120X (online) Vol. 8, Issue 3, pp: (195-200), Month: July - September 2020, Available at: www.researchpublish.com
Abstract: As data mining techniques are becoming more essential for many life aspects, it has many significant additions to the field of sports. Using data mining, we can predict performance of teams, predict game outcomes, identify outstanding players, relate between positions and players statistics, find the most important factors in determining best players or best teams, and much more. Experts, coaches, players and even fans can benefit a lot of such effort.
Keywords: Data mining; K-means clustering; Linear and Quadratic regression.
It is very significant for experts, teams' managers, players and fans to utilize the techniques and methodologies of data mining in the field of sports. National Basketball Association (NBA) league is one of the most well-known leagues in the whole world and hence it is more interesting to apply data mining techniques on the NBA league. The most exciting in sports is to forecast the next stage whether to expect game outcome or to predict teams' rank in the next season. Also, it is exciting to detect outstanding players depending on the statistics collected over 30 years and therefore more accurate players' ranking. Moreover, the team's managers and experts are interested in players' positions and related statistics in order to study and outline the strategies of their teams or opposing teams.
Outstanding Players Detection: How can experts confirm outstanding players list? Good idea is to locate the most influencing features (statistics such as number of points or rebounds made) that classify players and then use these features to rank the players.
Positions Inference: Can players' positions determine statistics? can statistics determine positions? It is very important for experts to have this information and hence form better field strategies.
Ranking Forecast: How can we use historic NBA data to predict future seasons? People are interested either in predicting individual game outcome or in forecasting new season rank. In this report, I will focus on predicting the teams' ranking as well as to explore the most important statistics to determine the season winner.
The next sections are organized as follows: related work discussing existing or similar solutions; followed by describing the datasets and their pre-processing; followed by the algorithms and methodologies implemented to resolve the problems; followed by showing the result and analysis.
[1] The effort was to predict the outcomes of individual Major League Baseball (MLB) games as well as to explore the more important features of a team. The data was aggregated to have 18,717 individual games' score between 1971 and 2000. Using 25 features, the project implemented logistic regression, Naive Bayes, Support Vector Machine (SVM) and an ensemble classifier. The pre-processing of features was done in Perl and others in Matlab except for SVM that was done by SVM-light. This work achieved an accuracy of 50-58%.
[2] This paper focused on the National Basketball Association (NBA) to predict and analyze the performance. Data was collected from 2007-2008 NBA seasons for both teams and players. The paper initially shows that there is no relation between the statistics and time as the season progress. Logistic regression was implemented in Matlab to predict team performance using 25 features to achieve 66.7% accuracy. Also, SVM was implemented using SVM-Light with 67.8% accuracy.
ISSN 2348-1196 (print)
International Journal of Computer Science and Information Technology Research ISSN 2348-120X (online) Vol. 8, Issue 3, pp: (195-200), Month: July - September 2020, Available at: www.researchpublish.com
[3] This effort was to predict games scores, detect outliers and detect optimal player positions in the NBA league. The data was taken from the NBA website (1991-1997) and then inserted in SQL database. Predicting game outcome was handled by four techniques: linear regression, logistic regression, SVM and Artificial Neural Network (ANN). Position Inference utilized k-means clustering. Outlier detection (outstanding players) was just identified by plotting two ready statistics from the NBA league. The game prediction achieved an accuracy up to 73% with a clear outperformance of linear regression over other methodologies.
I have borrowed most of my ideas from the last paper with different perspectives. My focus is to detect the most influencing features and based on these features, predict the next season rank (whole rank not per game), detect outstanding players and relate positions to statistics. Also, I have borrowed from the last paper the way they used to display the results.
Datasets:
The data is obtained from http://www.databasebasketball.com. The dataset contains data about:
Players dataset: 3231 different players' statistics aggregated through more than 40 years. The statistics include for each player
o Number of game and total minutes played
o Points, rebounds, assists, steals, block, turnover and fouls
o Field throws attempted, field goals attempted and 3pts attempted
o Field throws made, field goals made and 3pts made
Teams dataset: 525 teams record aggregated through more than 40 years. Records are associated with all teams played in NBA season by season. The statistics include for each team record
o Number of wins, losses, total points made by the teams and total points made by the opponents
o Pace statistic which is used to measure the ball possession by a team
o Total rebounds, assists, steals, block, turnover and others made by the team itself or by its opponents.
o Total defensive rebounds, assists, steals, block, turnover and others made by the team itself or by its opponents.
o Total Field throws attempted/made, field goals attempted/made, 3pts attempted/made and others by the team and its opponents.
Players positions: 3231record associated with each player and his position.
Steps to pre-process Players datasets:
The data was in text files. I have adapted the data to be suitable in Matlab.
Major step was to merge positions data with the main player dataset. It had to be done manually as some differences between the two original datasets.
It was very interesting/important to calculate each player's performance as an average per minutes he played.
I have eliminated a lot of invalid data that was detected by the outstanding players detection methodology
Steps to pre-process Teams datasets:
The data was in text files. I have adapted the data to be suitable in Matlab.
I have calculated each team points (points here do not mean goals made but mean wins versus losses) per season. Moreover using the points. I have ranked the teams as first place, second, third, ... etc
A lot of figures before 1980s were missing and hence I have eliminated all seasons before 1985 and focus on data between 1985-2004
ISSN 2348-1196 (print)
International Journal of Computer Science and Information Technology Research ISSN 2348-120X (online) Vol. 8, Issue 3, pp: (195-200), Month: July - September 2020, Available at: www.researchpublish.com
Prior to detect outstanding players, I have investigated the most influencing features that determine the good players. To accomplish that, K-mean clustering as well as forward feature selection methodologies were implemented. The implementation has been carried out in Matlab using the massaged datasets.
K-means clustering is a method of cluster analysis which aims to partition n observations into k clusters in which each observation belongs to the cluster with the nearest mean. Given a set of observations (x1, x2, …, xn), where each observation is a d-dimensional real vector, k-means clustering aims to partition the n observations into k sets (k ≤ n) S = {S1, S2, …, Sk} so as to minimize the within-cluster sum of squares (WCSS):
where μi is the mean of points in Si. [4]
Feature selection is the technique of selecting a subset of relevant features for building robust learning models and by removing most irrelevant and redundant features from the data, feature selection helps improve the performance of learning models by enhancing generalization capability, speeding up learning process and improving model interpretability. In forward selection, features are progressively incorporated into larger and larger subsets until k selected features located (starts with empty set). [4]
Using these two algorithms, I have initially utilized the Matlab built-in algorithm to cluster players into 5 clusters (kmeans with k=5). The k-means clustering was implemented in both total players' figures as well as in the averaged per minutes figures. Based on these clusters, I have implemented forward feature selection algorithm in Matlab to detect the most important features.
To find the relationship between players positions and their statistics as well to discover if position can infer statistics and vice versa, I have strived to implement algorithm that determine the previous matter. Here and as we have three different positions in basketball (center, guard and forward), the best decision is to first cluster the data into 3 clusters and then compare and get the correctness proportion. My methodology is to first have each feature in a separate table. Then, perform Matlab k-means clustering with k=3. I have used the averaged per minutes statistics since it guarantees more accurate results. Having these clusters and comparing them to the players positions (3 positions vs. 3 clusters) allows us to calculate the accuracy of features implying position and vice versa and hence find the relation strength between positions and features.
The more exciting application of data mining in the field of sports is to predict the outcome of next season or game. Based on the data available online regarding teams performance in season per season, I have utilized different algorithms to predict the next season ranking or standing. That is, which team will be in the first, second or other places knowing the previous seasons ranking.
Before prediction implementation, I attempted to trace the most influencing features that lead to win the season. That is, which features determine the winner? To resolve this matter, I have used same methodologies used in the outstanding player detection: consider the rank as the cluster number and then apply forward feature selection.
The next step is to use these features in predicting next season results. I have used the best 10 features by first assigning weight to them depending on their power in determining the season winner. Then, implement linear regression, quadratic regression and logistic regression to model relationship between the features and ranking and estimate future.
Linear regression attempts to model the relationship between two variables by fitting a linear equation to observed data. One variable is considered to be an explanatory variable, and the other is considered to be a dependent variable. A linear

ISSN 2348-1196 (print)
International Journal of Computer Science and Information Technology Research ISSN 2348-120X (online) Vol. 8, Issue 3, pp: (195-200), Month: July - September 2020, Available at: www.researchpublish.com
regression line has an equation form Y = a + bX, where X is the explanatory variable and Y is the dependent variable. The slope of the line is b, and a is the intercept (the value of y when x = 0). My implementation used the below equations to find slope and intercept and then to predict next season results:
slope = n*∑(x*y) - ∑(x*∑(y)) / (n*∑(x^2) - (∑(x))^2)
intercept = mean(y) - a1*mean(x); The implementation has been performed in Matlab.
For quadratic and logistic regression implementations, I have utilized Matlab built-in tools to plot the data and then structure the quadratic and logistic regression equations.

Notice that I have divided data into different parts depending on the number of teams in that season. It is incorrect to compare performance of a team within 23 teams’ season with another season having 27 teams. One season is considered as the training set while next season is the testing set.
As per the above implementations, the following features were identified as the most influencing features:
Total player statistics
o rebound, blocks, assists, steals, field throws made, filed throw attempt, points made Averaged per minute statistics
o rebound, defensive rebound, points made, assists, blocks, steals, 3pts attempted


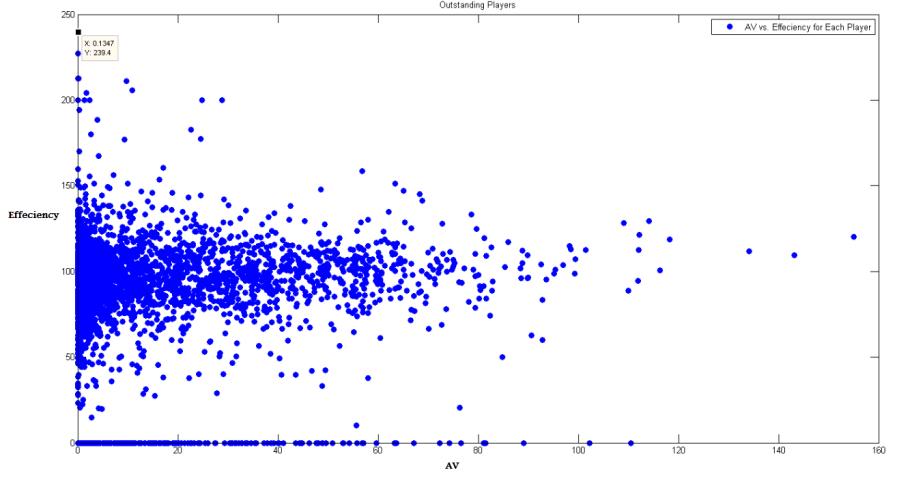
Now and after identifying the features, we need some approach to project them on the data and detect the outstanding players. For this case, I have utilized two figures derived from these top features. The two figures is used by NBA experts and analysts for this purpose. They are Approximate Value (AV) and Efficiency. The both measurements utilize about 90% of the features found above. Figure1 plots these two measurements and hence identify outstanding players.
Figure 1: Outstanding players (AV vs. Efficiency)
AV provides implication of long-time performance while efficiency provides implication for short time performance or per game performance
We can see from figure1 that famous players have more AV. This is clear since great players keep on long time with their outstanding performance.
ISSN 2348-1196 (print)
International Journal of Computer Science and Information Technology Research ISSN 2348-120X (online) Vol. 8, Issue 3, pp: (195-200), Month: July - September 2020, Available at: www.researchpublish.com
Table1 summarizes the relation between features and positions. We can see for example that rebound feature is the most related feature to positions or in another term it is the better feature to determine positions (accuracy is 0.658). Table1 provides 8 features accuracy that are varying from 0.421 to 0.658. The best features are rebounds, assists and blocks.
Feature Pts Rebound Assts Steal Block Fouls 3pt Made 3pt Attempt
Accuracy 0.425 0.658 0.576 0.481 0.548 0.544 0.421 0.449
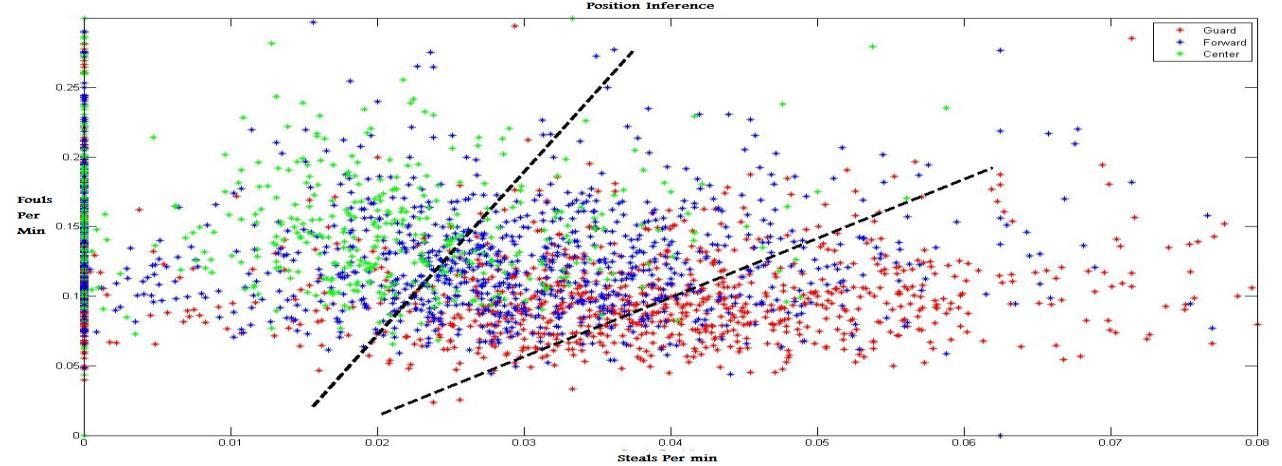
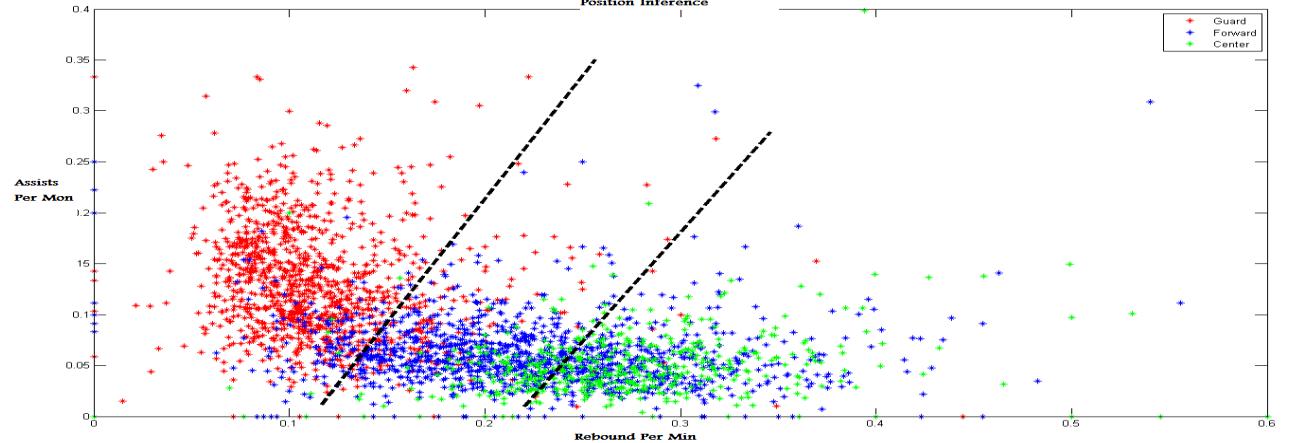
Figure2 and figure3 plot the relation between positions and statistics. From figure2, we can see that center position players have the highest rebounds while guards have the lowest. This is can be easily interpreted as center players are near to the basket and hence they have more likelihood to rebound the ball while guard are outside the basket arc and hence away from the rebounded ball. Similarly, the assists are expected to be from guard players more than center and forward players. Guard players as per basketball strategies are responsible for the assists while center players for scoring. Figure3 also describes the defensive situation. Center players are more probably to perform fouls as they defend near to their basket while guard players are more probably to have steals as they defend outside the arc and hence more likely to steal the ball from playmakers.
Many significant information can be derived from this approach. Experts and team coaches can utilize these figures to determine the optimal player position. For example, if a center player has few rebound and more steals, then the guard position will be better for him. Also, the opposing teams can benefit from these figures to concentrate on the other team's weakness. For example, if a guard player with high fouls, then he can direct his team to concentrate on him.
Figure 2: Position Inference (rebound vs. assists)

Figure 3: Position Inference (steals vs. fouls)

ISSN 2348-1196 (print)
International Journal of Computer Science and Information Technology Research ISSN 2348-120X (online) Vol. 8, Issue 3, pp: (195-200), Month: July - September 2020, Available at: www.researchpublish.com
The most influencing features that determines the season winners are: number of wins, number of losses, pace, points (scores) made, opponent points made, defensive rebound, 3pts attempt, turnovers, opponent field goal made, opponent assist. It is clear that number of wins and losses will determine the season winners. Therefore, it is more interesting to focus on the other features such as pace (ball possession) and points scored.
Based on these features and after assigning them weights, the regression has been implemented to predict next season ranking.
Table2 below summarizes the results of accuracy of using linear, quadratic and logistic regression in forecasting next season ranking.
As per table2, the logistic regression outperforms other two algorithms in all cases (cases are seasons with 23 teams, seasons with 27 teams and seasons with 29 teams). Linear regression comes next in prediction accuracy.
Season with 23 teams (Accuracy) Season with 27 teams (Accuracy) Season with 29 teams (Accuracy)
Linear Regression 0.60 0.67 0.62
Quadratic Regression 0.60 0.52 0.55 Logistic Regression 0.70 0.67 0.66
Data mining and its techniques can add great advantages to almost all our life aspects. Analyzing and correlating the data can produce amazingly very useful information to be utilized in developing businesses, enhancing decision making, securing assets, better resources utilization and many more. On this study, using some data mining techniques helped to identify major areas to predict performance and outstanding players which leads to identify the area of improvements to players and coaches to excel.
[1] Gregory Donaker , Applying Machine Learning to MLB Prediction & Analysis.
[2] Jonathan Chu, Predicting Performance in the National Basketball Association.
[3] Matthew Beckler, Hongfei Wang, Michael Papamichael; NBA Oracle.
[4] Wikipedia; www.wikipedia.org